March 16, 2026
A steady stream of international tensions continues to make headlines, at times influencing the housing market by pushing mortgage rates higher.
Rising Rates Can Impact Demand
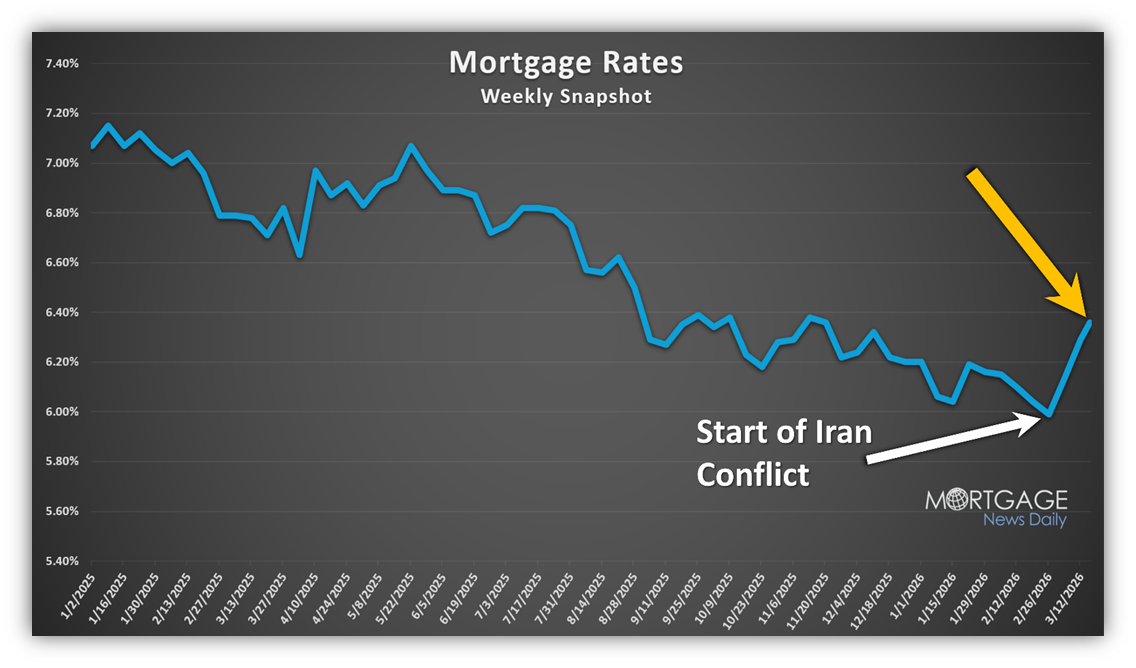
After dropping to 5.99% a few weeks ago, mortgage rates have increased to 6.36% amid rising gas prices and the threat of higher inflation.
The economic term “exogenous shock” refers to an unexpected, external, unpredictable event that disrupts a system from the outside. For example, a sudden heat wave hits a kid’s lemonade stand, where demand skyrockets. The kid had nothing to do with the instant change in the weather, yet lemonade sales went through the roof. Or when a hit TV show is filmed in a small town. In the blink of an eye, hotels and vacation rentals are completely booked, and there are no more restaurant reservations available. The sleepy town quickly became a tourist destination when it was unexpectedly featured on TV.
There are many examples of exogenous shocks that have had a major impact on the economy. A prime example is the U.S. COVID-19 lockdown of March 2020, six years ago. It was the largest worldwide pandemic in a century, and it touched almost every corner of the economy for years.
The Iran conflict, which began on February 28, 2026, is the latest exogenous shock to hit the U.S. and global economies. Due to the effective closure of the Strait of Hormuz, gas prices abruptly soared. According to AAA, a gallon of gas in California was $4.64 on February 28th, and today it has soared to $5.53, an increase of $0.89, or 19%. With the rapid change in prices, many are turning to COSTCO for gas, averaging $5.12 per gallon across the state, a substantial savings.
The sudden shift in gas prices has many economists and investors concerned about inflation and, ultimately, the Federal Reserve’s response to the threat to price stability. As a result, according to Mortgage News Daily, mortgage rates have climbed from 5.99% on February 27th to 6.36% today. That means that a $1 million mortgage has increased monthly from $5,989 to $6,229, up $240 per month, or $2,880 per year.
Even with the recent climb in mortgage rates, it is still below last year’s level. It was at 6.8% a year ago, and eclipsed 7% in April and in May. At 6.8%, that $1 million mortgage increases to $6,519, up $290 from today, and at 7%, it would be $6,653, up $424, or $5,088 per year.
The Federal Reserve’s dual mandate is to maintain price stability and promote maximum employment. According to CPI, after rising during the second half of 2025, inflation had been slowly easing. In addition, the labor market was showing further signs of weakening. On March 6th, the February Jobs Report was released, revealing that the U.S. had lost 92,000 jobs. Without the conflict in Iran, mortgage rates would have dropped below their recent 5.99% lows to levels not seen since August 2022.
Housing is about to transition to the Spring Market, the busiest time of the year for buyer activity, which typically peaks between April and May. Where will buyer demand go from here? That largely depends on mortgage rates.
If mortgage rates eclipse 6.5% as prices at the pump continue to climb, expect year-over-year differences in buyer demand and closed sales volume to be nearly the same. However, if the Iran conflict is resolved soon or the Strait of Hormuz reopens, gas prices would drop, easing inflation concerns and putting downward pressure on mortgage rates. The Federal Reserve would likely shift its focus back to the weakening job market and reconsider cutting the Federal Funds Rate. Mortgage rates could fall back to 6%, or even lower if upcoming jobs reports are weak, a substantial year-over-year improvement in affordability. This would likely push buyer demand (a snapshot of the number of new pending sales over the prior month) and closed sales activity higher than levels seen over the past three years.
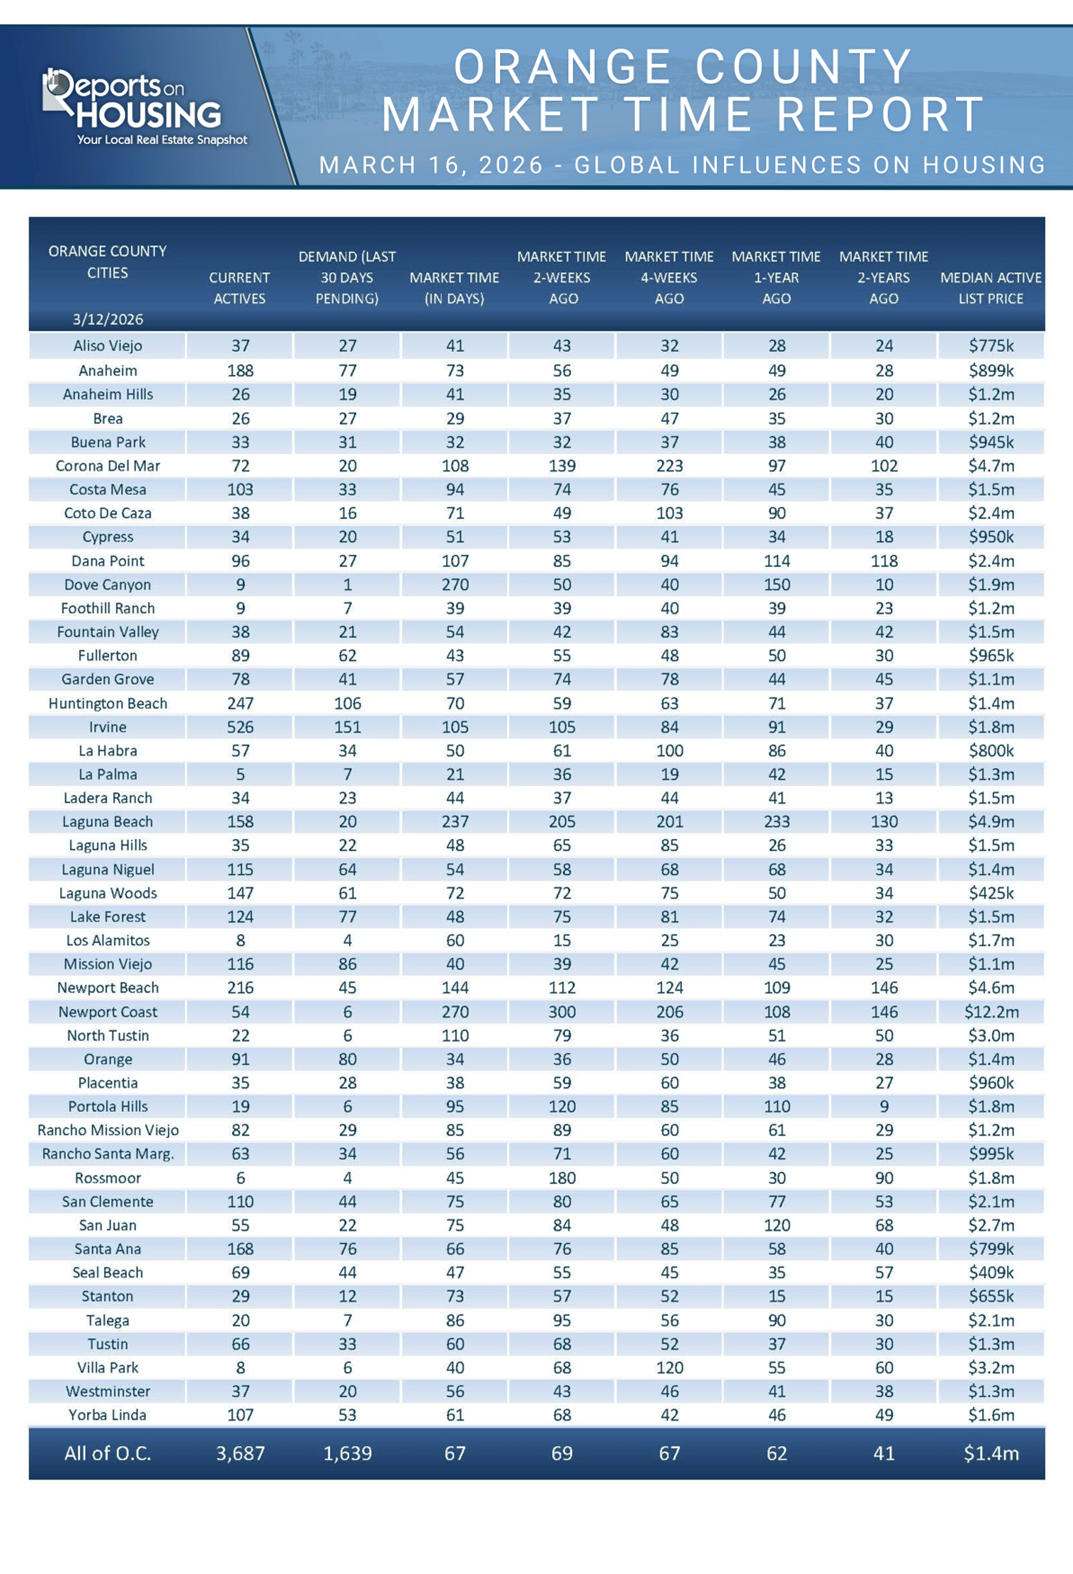
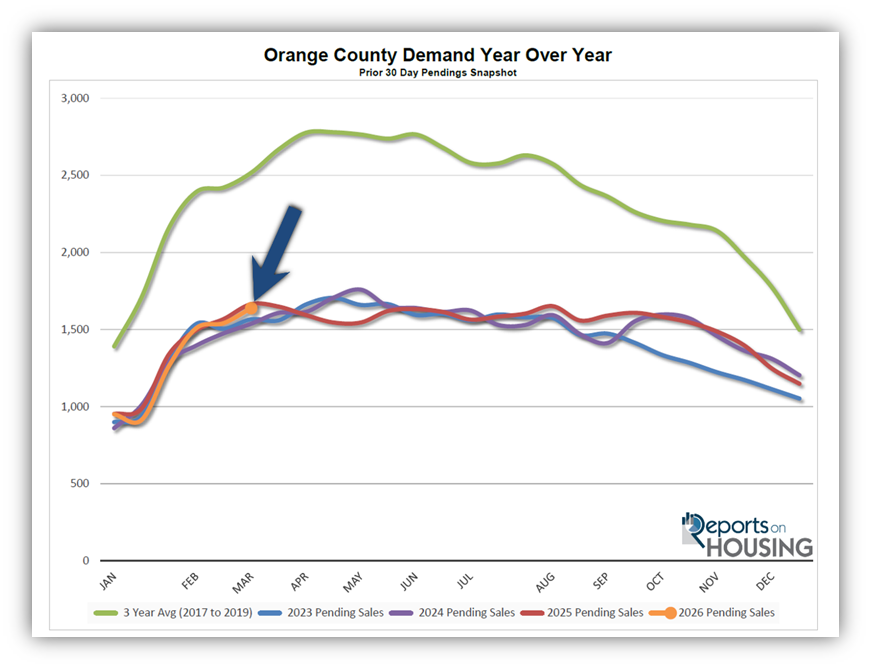
Orange County demand is currently at 1,639 pending sales, down 26 from last year’s 1,665 level, or 2%. In 2024, it was at 1,538 pending sales (-6%), and in 2023, it was at 1,568 (-4%). The 3-year average buyer demand before the pandemic (2017 to 2019) was 2,429 (+48%).
ATTENTION SELLERS: Rather than betting on the trajectory of mortgage rates, the better strategy is to price with precision and carefully arrive at a home’s Fair Market Value. Carefully consider all recent comparable closed and pending sales. Do NOT overprice. It will only result in wasted market time and less fanfare when the home is properly priced. In a market with plenty of seller competition, pricing is the ultimate strategy.
ATTENTION BUYERS: Even with the recent rise in mortgage rates, they are still lower than last year. With the Spring Market upon us, there will be plenty of buyer competition, and homes that are attractive and expertly priced will fly off the market. Waiting on the sidelines for conditions to improve is often an exercise in futility and in missing plenty of timely opportunities.
Active Listings
The inventory increased by 4% in the past couple of weeks.
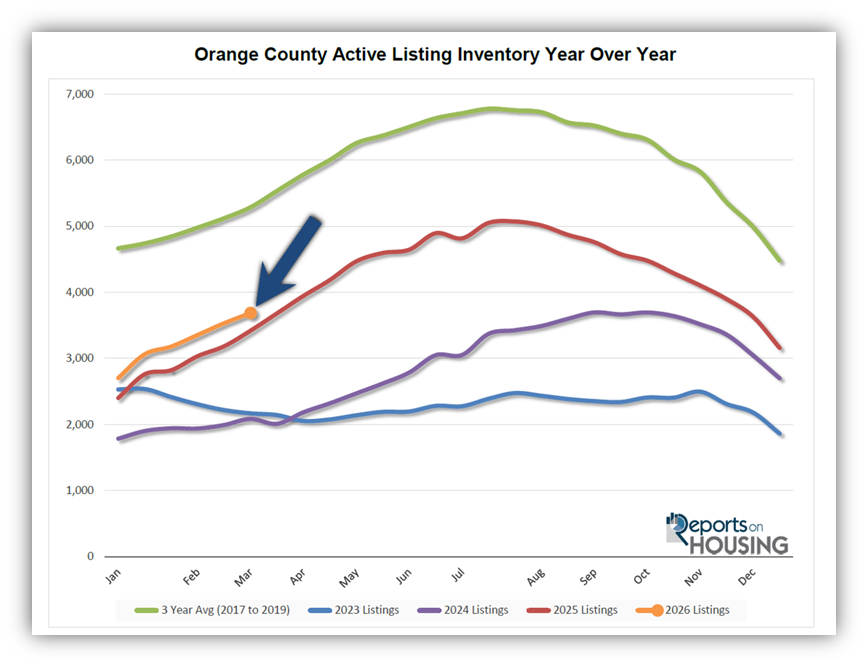
The active listing inventory increased by 156 homes over the past two weeks, up 4%, to 3,687. As Orange County transitions to the Spring Market, expect the inventory to slowly but surely climb from now until it reaches its peak, sometime between July and August. So far this year, the inventory has climbed from 2,703 homes to 3,687, up 36% or 984 homes.
Last year, the inventory was at 3,419 homes, 7% lower, or 268 fewer. The year-over-year gap is narrowing. The 3-year average before COVID (2017 through 2019) was 5,100, an additional 1,413 homes, or 38% more.
Homeowners continue to “hunker down” in their homes, unwilling to move because of their current, underlying, locked-in, low fixed-rate mortgage. This trend has been easing from the lows established in 2023. Through February, 4,803 homes were placed on the market in Orange County, 1,383 fewer than the 3-year average before COVID (2017-2019), 22% less. In 2025, 5,041 homes entered the market (5% more), compared to 4,119 in 2024 (14% less), and 3,472 in 2023 (40% less). Slightly fewer homes have been coming on the market this year compared to last.
Demand
Demand increased by 6% in the past couple of weeks.
Demand, a snapshot of the number of new pending sales over the prior month, increased from 1,542 to 1,639 in the past couple of weeks, up 97 pending sales, or 6%, the highest level since last August. During the upcoming Spring Market, expect demand to peak sometime between April and May. From there, demand will fall at a very slow pace through the Spring and Summer Markets. The changes in buyer demand will be almost undetectable within the market. A key caveat to this outlook would be a sudden easing of inflation concerns driven by falling gas prices. That would result in lower mortgage rates and could ultimately boost demand. Only time will tell.
Last year, demand was 1,665, with 26 additional pending sales, or 2% more. The 3-year average before COVID (2017 to 2019) was 2,429 pending sales, 48% more than today, or an additional 790.
As the Federal Reserve has indicated, it is essential to watch all economic releases for signs of slowing. That is the only path to lower mortgage rates at this time. These releases can cause mortgage rates to rise or fall, depending on how they compare with market expectations. This week, Retail Sales will be released on Tuesday, and on Wednesday, the Federal Reserve will meet and hold a press conference to announce its decision on the Federal Funds rate. They will ultimately reveal their appetite to cut rates in the near future and into 2026. It will be a pivotal week for mortgage rates.
Expected Market Time
In the past two weeks, the market time has decreased by two days.
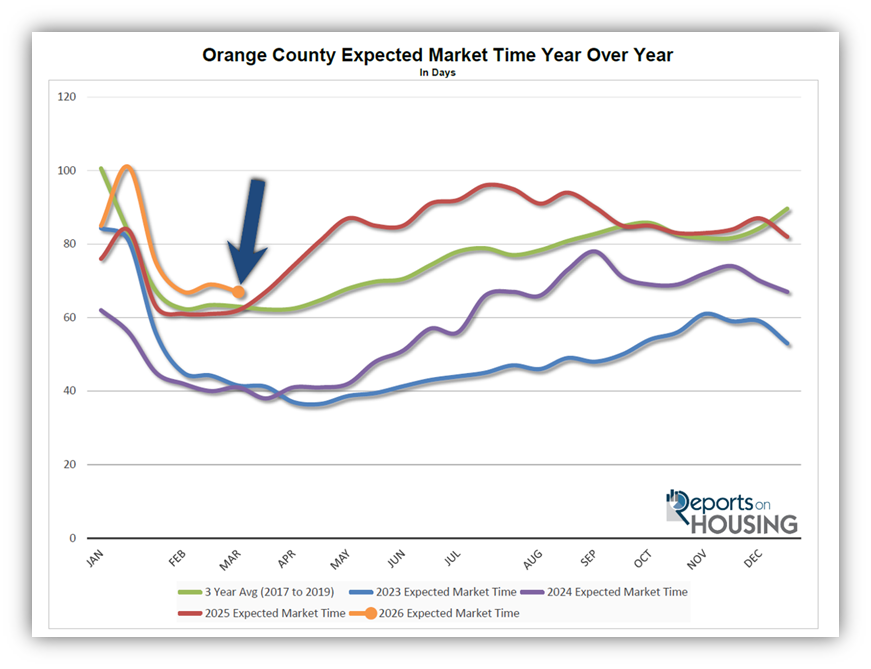
With the supply of available homes rising by 156 homes, up 4%, and demand rising by 97 pending sales, up 6%, the Expected Market Time (the number of days it takes to sell all Orange County listings at the current buying pace) decreased from 69 to 67 days in the past couple of weeks, identical to one month ago and its fastest level of the year.
Last year, it was 62 days, slightly faster than today. The 3-year average before COVID (2017 to 2019) was 63 days, also slightly quicker than today.
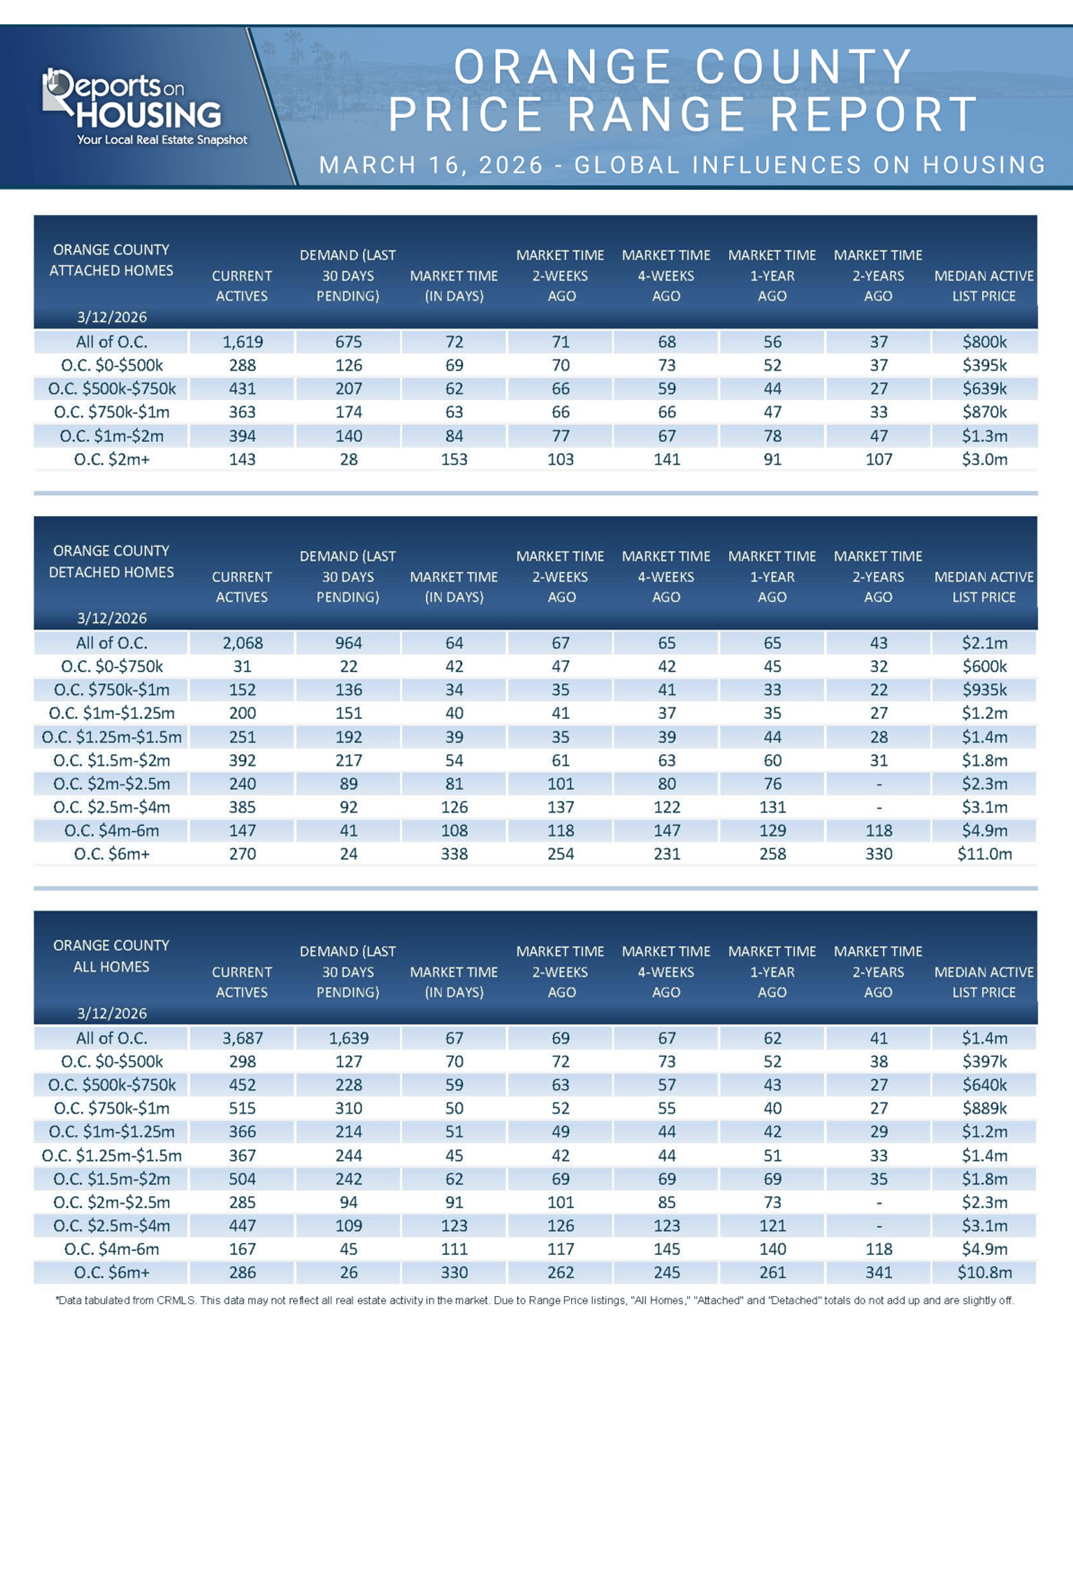
The Expected Market Time for condominiums and townhomes increased from 71 to 74 days in the past two weeks. It was at 56 days last year. For detached homes, the Expected Market Time decreased from 67 to 64 days, its fastest reading of the year. It was 65 days a year ago, nearly the same as today. The detached-home market is faster than the attached-home market.
Luxury End
The luxury market did not change much over the past couple of weeks.
In the past couple of weeks, the luxury inventory of homes priced above $2.5 million (the top 10% of the Orange County housing market) increased from 854 to 900 homes, up 46 or 5%. Luxury demand increased by 7 pending sales, up 4%, to 180, its highest level since November. With supply slightly outpacing demand, the Expected Market Time for luxury homes priced above $2 million increased from 148 to 150 days. Due to the increased volatility of Wall Street and the uncertainty surrounding the economy, luxury may slow further from here.
Year over year, the active luxury inventory is down by 78 homes (8%), and luxury demand is down by 16 pending sales (8%). Last year’s Expected Market Time was 150 days, the same as today.
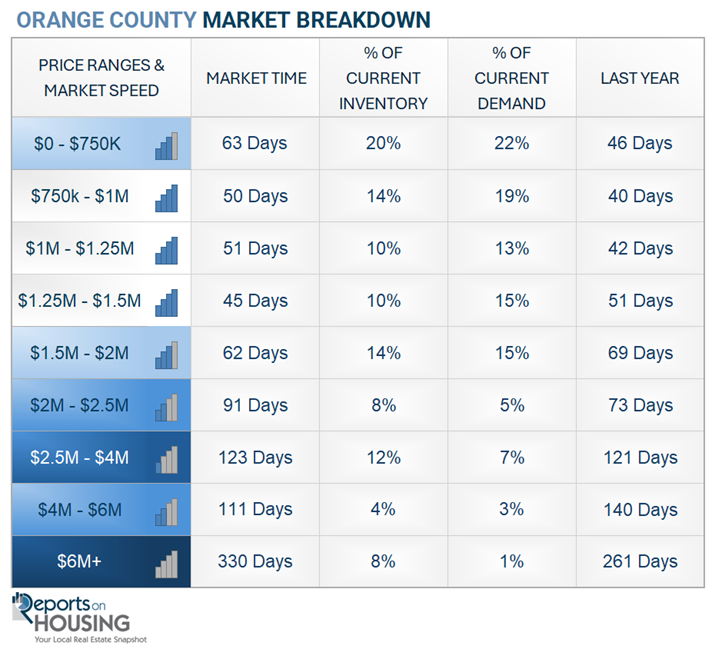
In the past two weeks, the Expected Market Time for homes priced between $2.5 million and $4 million decreased from 126 to 123 days. For homes priced between $4 million and $6 million, the Expected Market Time decreased from 117 to 111 days. For homes priced above $6 million, the Expected Market Time increased from 262 to 330 days. Luxury is at 150 days overall. At this pace, a seller would be looking at becoming a pending sale around August 2026.
Orange County Housing Summary
- INVENTORY: The active listing inventory in the past couple of weeks increased by 156 homes, up 4%, and now stands at 3,687. Last year, there were 3,419 homes on the market, 268 fewer homes, or 7% less. The 3-year average before COVID (2017 to 2019) was 5,100, which is 38% higher. From January through February, 22% fewer homes came on the market than the 3-year average before COVID (2017 to 2019), 1,383 fewer. There were 238 fewer than last year, 684 more than in 2024, and 1,331 more than in 2023.
- DEMAND: Buyer demand, the number of pending sales over the prior month, increased by 97 in the past two weeks, up 6%, and now stands at 1,639. Last year, there were 1,665 pending sales, 2% more than today. The 3-year average before COVID (2017 to 2019) was 2,429, which is 48% higher.
- MARKET TIME: With demand increasing faster than supply, the Expected Market Time, the number of days to sell all Orange County listings at the current buying pace, decreased from 69 to 67 days in the past couple of weeks. Last year, it was 62 days, slightly faster than today. The 3-year average before COVID (2017-2019) was 63 days, also slightly quicker than today.
- LUXURY: In the past two weeks, the Expected Market Time for homes priced between $2.5 million and $4 million decreased from 126 to 123 days. For homes priced between $4 million and $6 million, the Expected Market Time decreased from 117 to 111 days. For homes priced above $6 million, the Expected Market Time increased from 262 to 330 days.
- DISTRESSED HOMES: Short sales and foreclosures combined, comprised only 0.2% of all listings and 0.2% of demand. Two foreclosures and five short sales are available today in Orange County, bringing the total of distressed homes on the active market to seven, up three from two weeks ago. Last year, four distressed homes were on the market, similar to today.
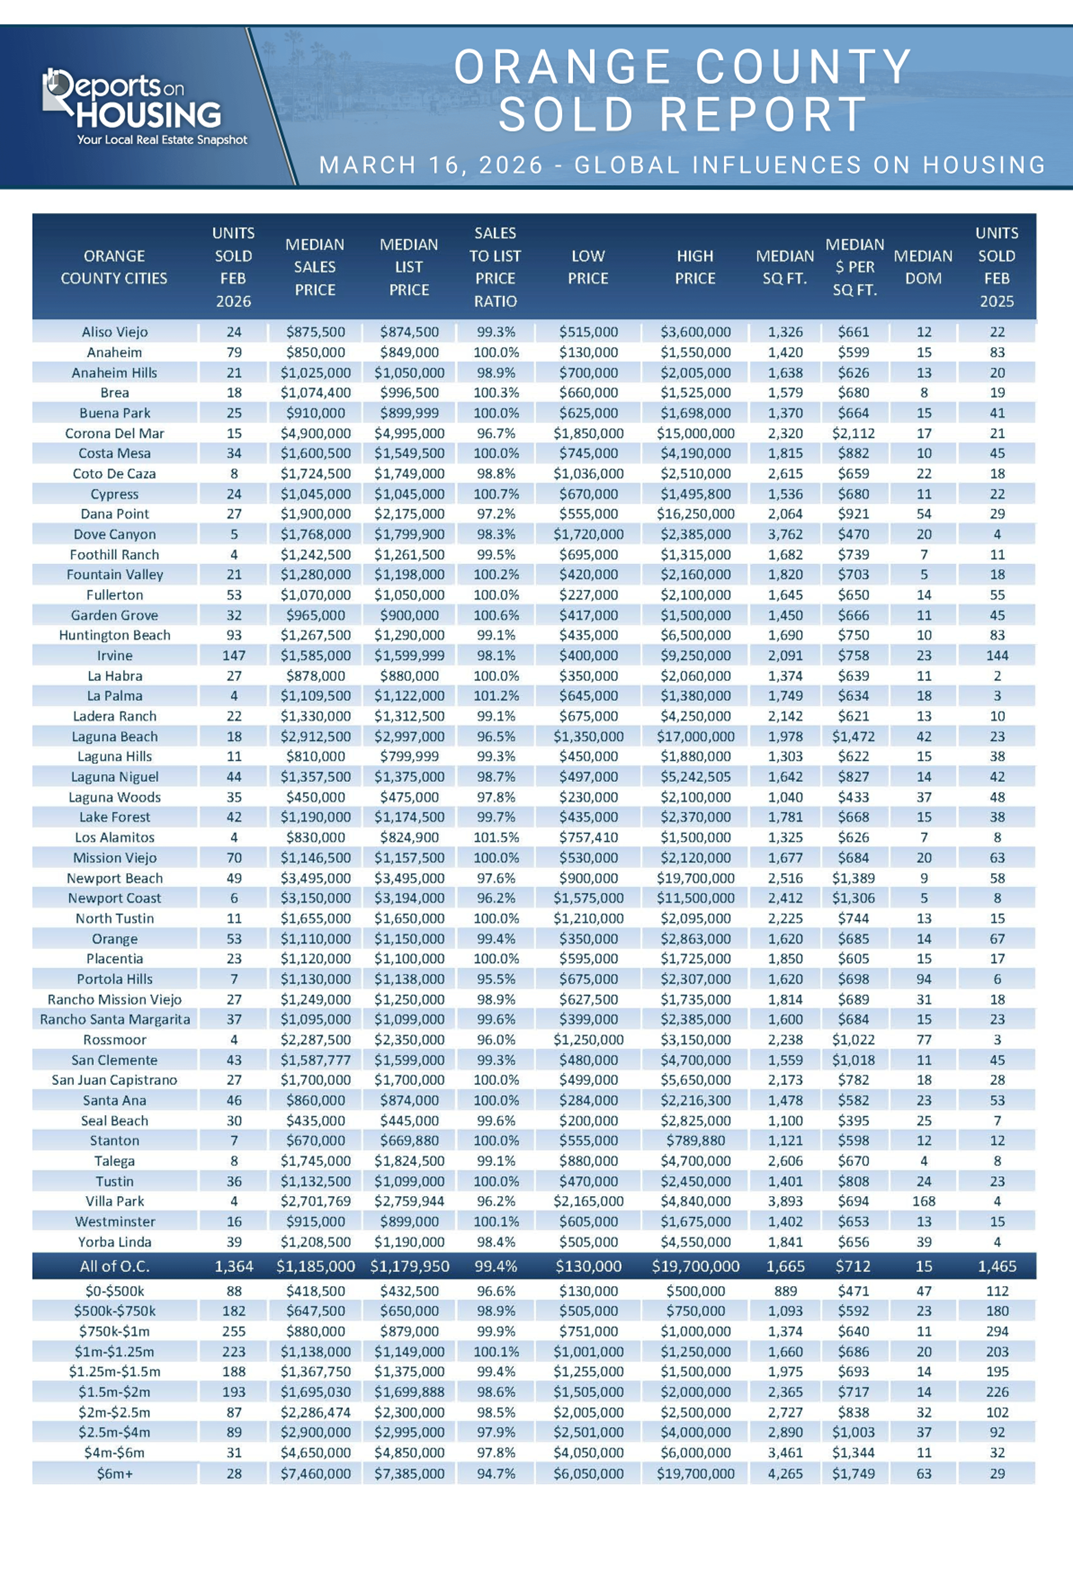
- CLOSED SALES: There were 1,364 closed residential resales in February, down 7% compared to February 2025’s 1,465 sales, and up 12% from January 2026. The sales-to-list price ratio in Orange County was 99.4%. Foreclosures accounted for 0.2% of all closed sales, and there were no short sales. That means that 99.8% of all sales were sellers with equity.
Have a great week.
Sincerely,
Steven Thomas
Quantitative Economics and Decision Sciences
Copyright 2026—Steven Thomas, Reports On Housing—All Rights Reserved. This report may not be reproduced in whole or in part without express written permission from the author.