November 10, 2025
Housing is about to transition to the Holiday Market, the slowest time of the year for real estate, when both supply and demand drop to their lowest levels of the year on New Year’s Day.
The Holiday Market
Due to all the holiday distractions, from the week before Thanksgiving through the end of the year, supply and demand will plunge.
That was quick! All the kids just went door-to-door trick-or-treating, filling their pillow cases full of as much candy as they could carry. Lawns were garnished with cleverly phrased tombstones, and giant spiderwebs blanketed houses and trees. There were large blowups, skeletons that stretched to the sky, and creatively carved pumpkins glowing from the candles within. In the blink of an eye, all the decorations disappeared, neatly put back into their boxes and placed back onto the shelves in the garage. Starbucks launched its next set of holiday cups, and advertisements began reminding everyone that Santa was back and the shopping season had arrived. Meanwhile, some of the neighbors started trimming their homes with lights. The holidays have arrived!
It is an excellent reminder that housing is about to transition from the Autumn Market to the Holiday Market, from the week before Thanksgiving through the first couple of weeks of the New Year. Without fail, the holidays are a time when inventory and demand plunge, and the Expected Market Time — the speed of the market — remains relatively unchanged. This is the season when many sellers and buyers will place their real estate goals on hold while they enjoy all of the holiday festivities. It is time to pause, celebrate, gather, and reflect.
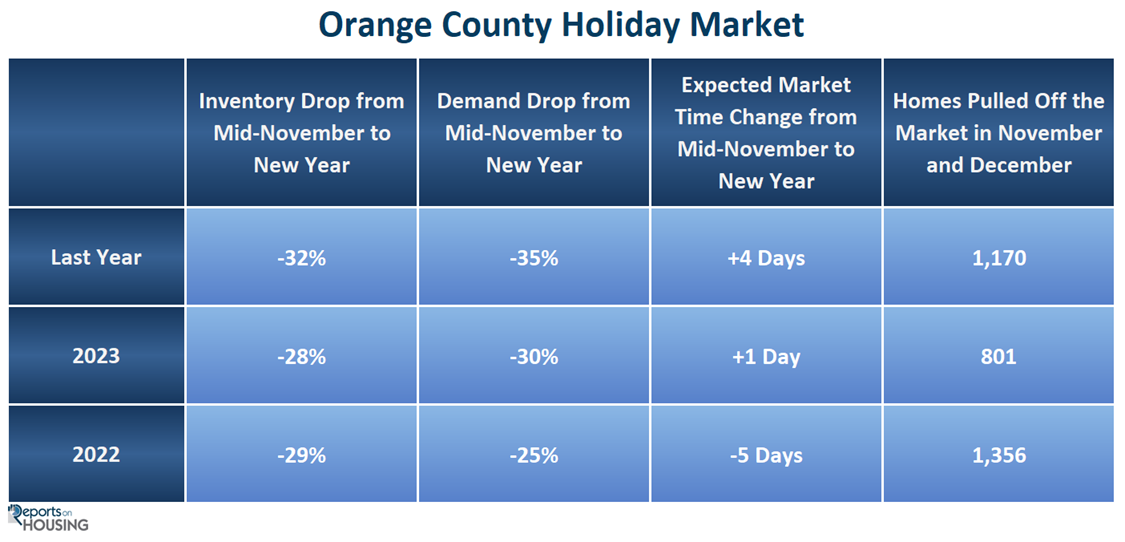
Over the past couple of years, more homeowners have decided to place their homes on the market. With demand remaining almost unchanged over the past three years, the extra “FOR SALE” signs have resulted in more homes accumulating on the market. The number of available homes was higher in 2024 than in 2023, and it was even higher this year than last year. Yet, there are still fewer homes on the market than before the pandemic. Last year, after peaking in September at 3,695 homes, the inventory dropped to 3,516 by the start of November, a 5% decrease. During the Holiday Market, the inventory plummeted by 32%, reaching 2,401 by the first week of January. In 2023, it dropped by 28% from 2,496 to 1,785. In 2022, it fell by 29%, from 3,581 to 2,530. This year, after peaking at 5,071 homes at the end of July, the inventory has decreased by 19% to 4,103 as of today. With all the holiday distractions, expect the inventory to drop by about 30% through the end of the year.
December is home to the fewest number of homes placed on the market, followed by November, which has the second fewest. Intuitively, homeowners recognize that the holidays are not the best time of year to sell their homes for top dollar. In addition, the greatest number of sellers throw in the towel and pull their homes off the market to enjoy the holidays. So far this year, there are 6,906 sellers who have thrown in the towel, which is up 73% compared to last year. The current trend of more sellers throwing in the towel this year, due to a higher number of listings languishing on the market, will continue through year’s end.
Demand drops substantially during the holidays as well. Many buyers wait eagerly on the sidelines for fresh inventory to hit the market. With minimal new listings and many sellers opting out as the year draws to a close, the market will face a noticeable shortage of fresh inventory. Additionally, many buyers embrace all the holiday festivities and are ready to take a break until after the New Year. Demand tumbled by 35% last year, from 1,458 pending sales in November to 953 during the first week of January. In 2023, it dropped from 1,223 in November to 861 during the first week of January 2024, a 30% decrease. It sank from 1,202 in November 2022 to 900 during the first week of January 2023, representing a 25% decline.
Demand (a snapshot of the number of new pending sales over the prior month) is similar to last year, 1,487 pending sales today versus 1,458 a year ago. Yet, demand will most likely not decline as much as it did last year, by 35%, because mortgage rates are currently at 6.34%, substantially lower than the over 7% rate last year. Nonetheless, demand will still drop considerably to close out 2025.
Interestingly, as both supply and demand decrease, the overall speed of the market remains relatively unchanged. Many buyers believe that the end of the year is when the market speed comes to a screeching halt. While it may be true that the remaining sellers who opt to remain on the market during this time of the year are more willing to negotiate, it is not the market for “low-ball” offers.
With supply and demand dropping at a similar pace, the Expected Market Time (the number of days it takes to sell all Orange County listings at the current buying pace) does not change much for the rest of the year. That has been the case since 2020, changing by only a few days. This year will be no different.
There is no escaping it. The season’s silent nights of the Holiday Market have arrived. With a noticeable drop in supply and demand, the buyers and sellers that remain need to adjust their expectations accordingly.
Active Listings
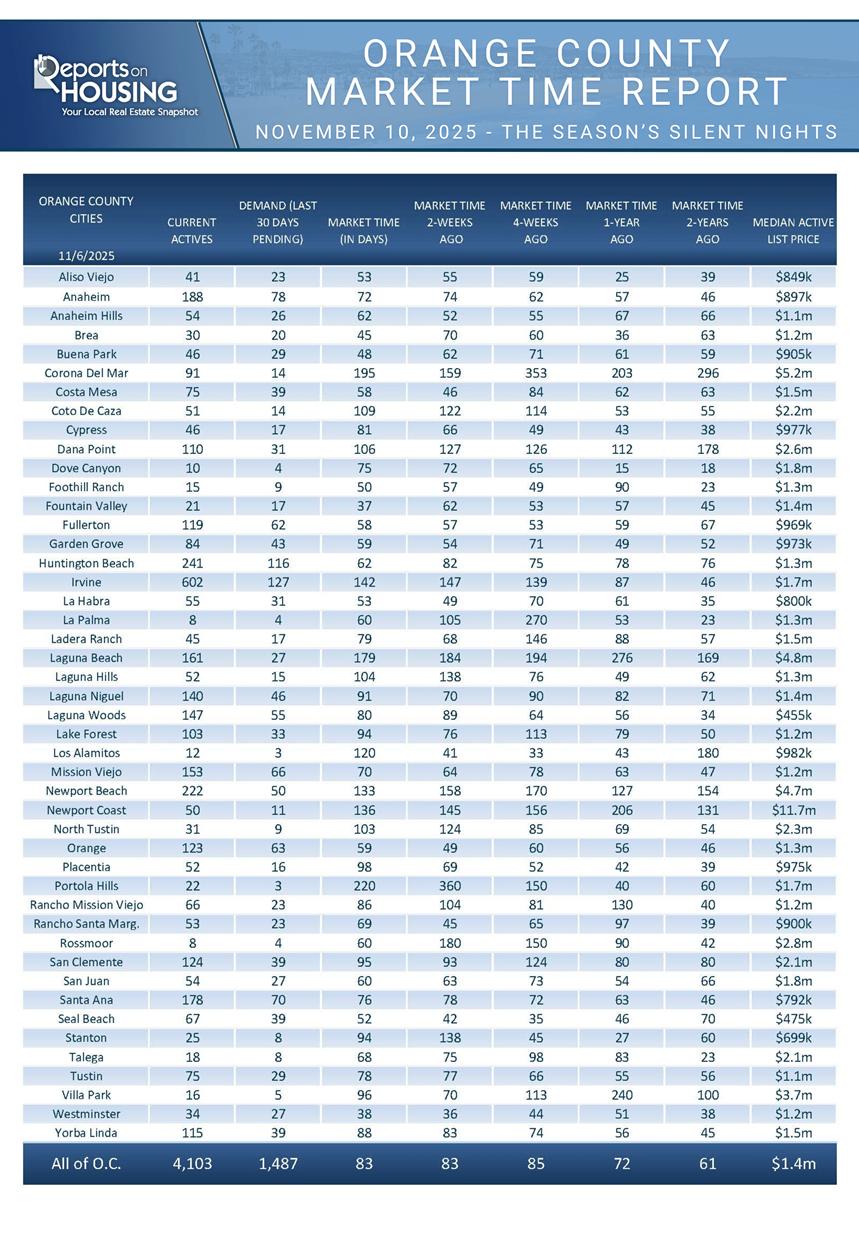
The inventory dropped by 4% in the past couple of weeks.
The active listing inventory decreased by 185 homes over the past two weeks, a 4% decline, and now stands at 4,103, its lowest level since the start of April. The inventory has plunged by 8% in just four weeks. It is the tail end of the Fall Market, with both supply and demand falling at a similar pace. From here, as the Orange County housing market transitions to the Holiday Market, expect the inventory to drop at a faster pace through the end of the year. Fewer homes will be listed on the market, and more sellers will give up due to a lack of success, contributing to the rapid decline in supply.
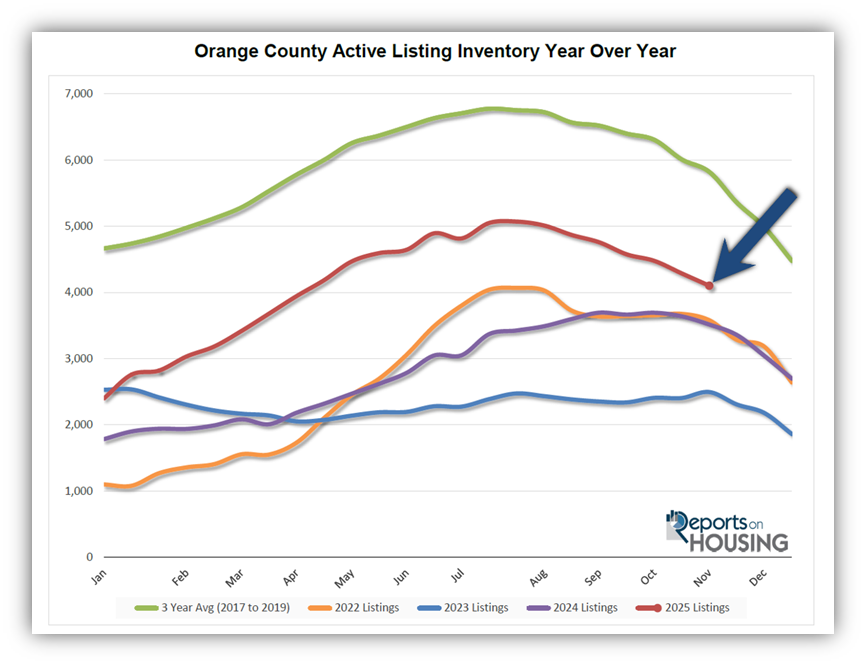
Last year, the inventory was at 3,516 homes, 14% fewer, or 587 less. The 3-year average before COVID (2017-2019) was 5,822, an additional 1,719 homes, or 42% more.
Homeowners continue to “hunker down” in their homes, unwilling to move because of their current, underlying, locked-in, low fixed-rate mortgage. This trend has been easing from the lows established in 2023. Through October, 26,246 homes were placed on the market in Orange County, 9,170 fewer than the 3-year average before COVID (2017-2019), 26% less. In 2024, 24,108 homes entered the market, compared to 20,624 in 2023. More sellers are opting to sell in 2025. Yet, for the third month in a row, the number of homes coming on the market was fewer compared to the prior year. In October, 2,138 homes came on the market, 6% less than last year’s 2,263.
Demand
Demand decreased by 4% in the past couple of weeks.
Demand, a snapshot of the number of new pending sales over the prior month, decreased from 1,546 to 1,487 in the past couple of weeks, representing a 59-pending-sale drop, or 4%, its lowest level since the end of January. Demand is almost identical to last year, despite today’s considerably lower mortgage rate environment. This may be due to the economic uncertainty caused by the government shutdown, which appears to be on the verge of reopening later this week. Mortgage rates have recently been moving on very little economic data. As the government reopens and the data spigot turns back on, rates could be a little more volatile in the weeks to come. Any noticeable slowing in the economy will lead to lower rates, while data indicating economic resilience will push rates higher. The end of the year will be interesting as housing transitions to the slowest time for real estate, the Holiday Market.
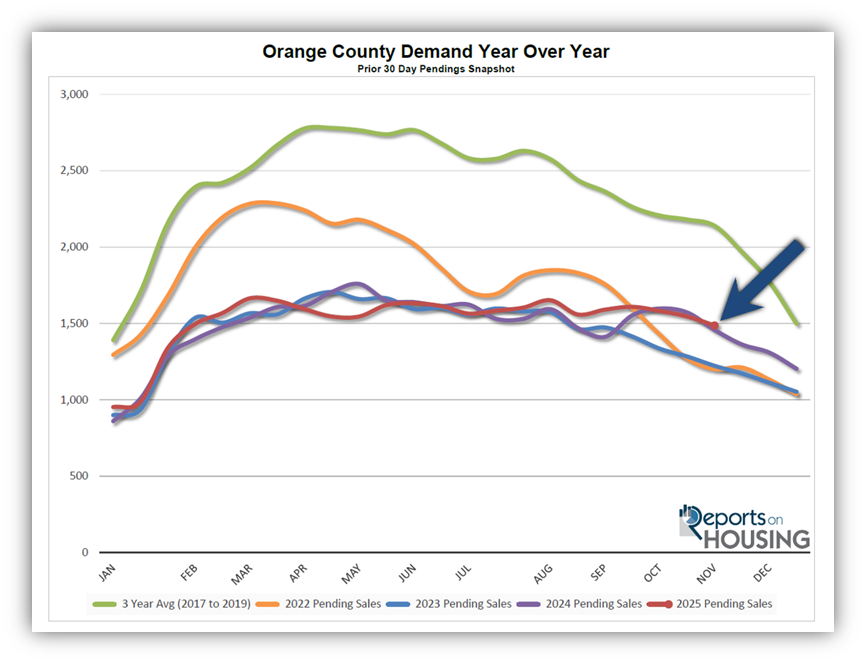
Last year, demand was 1,458, with 29 fewer pending sales, or 2% less. The 3-year average before COVID (2017-2019) was 2,139 pending sales, 44% higher than today, representing an additional 652 pending sales.
As the Federal Reserve has indicated, it is essential to watch all economic releases for signs of slowing. That is the only path to lower mortgage rates at this time. These releases can cause mortgage rates to rise or fall, depending on how they compare with market expectations. Yet, with the government shutdown, most critical data will not be released until the shutdown is resolved. Even with a reopening, it could be weeks before the data spigot is reopened.
Expected Market Time
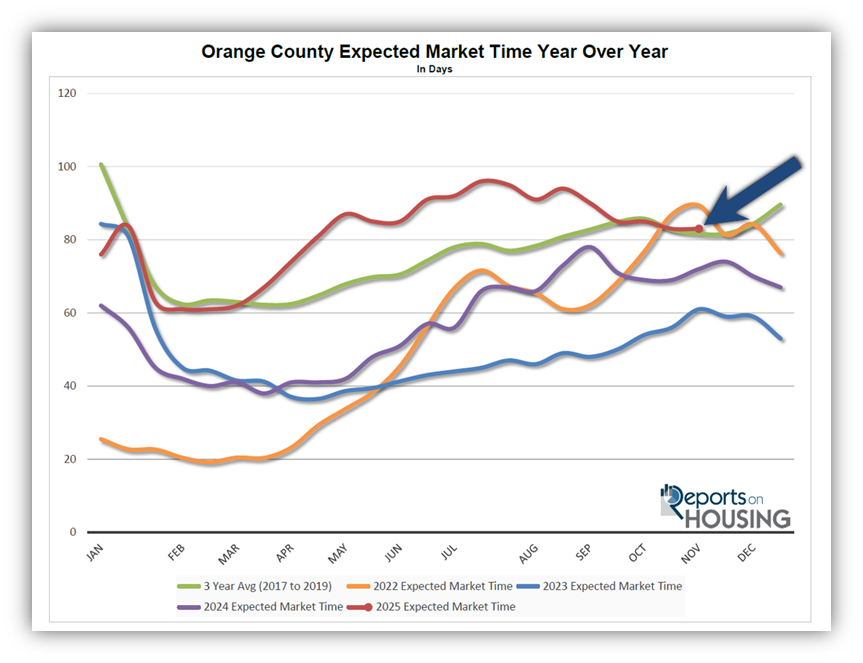
The Expected Market Time remained unchanged over the past couple of weeks.
With the supply of available homes falling by 185 homes, down 4%, and demand dropping by 59 pending sales, down 4%, the Expected Market Time (the number of days it takes to sell all Orange County listings at the current buying pace) remained unchanged at 83 days in the past couple of weeks, its lowest reading since April. Yet, it is the highest start to November since 2022.
Last year, it was 72 days, faster than today. The 3-year average before COVID was 85 days, similar to today.
The Expected Market Time for condominiums and townhomes increased from 88 to 92 days in the past two weeks. It was at 69 days last year. For detached homes, the Expected Market Time decreased from 80 to 77 days. It was 75 days a year ago, similar to today. The detached home market is stronger than the attached home market.
Luxury End
The luxury market improved over the past couple of weeks.
The luxury home inventory priced above $2.5 million (the top 10% of the Orange County housing market) decreased from 1,050 to 1,973, a decline of 77 homes, or 7%. Luxury demand increased by one pending sale, up 1%, to 173. The Expected Market Time for luxury homes priced above $2.5 million decreased from 183 to 169 days, its strongest level since March. The luxury market experienced growth despite the uncertainty surrounding the government shutdown.
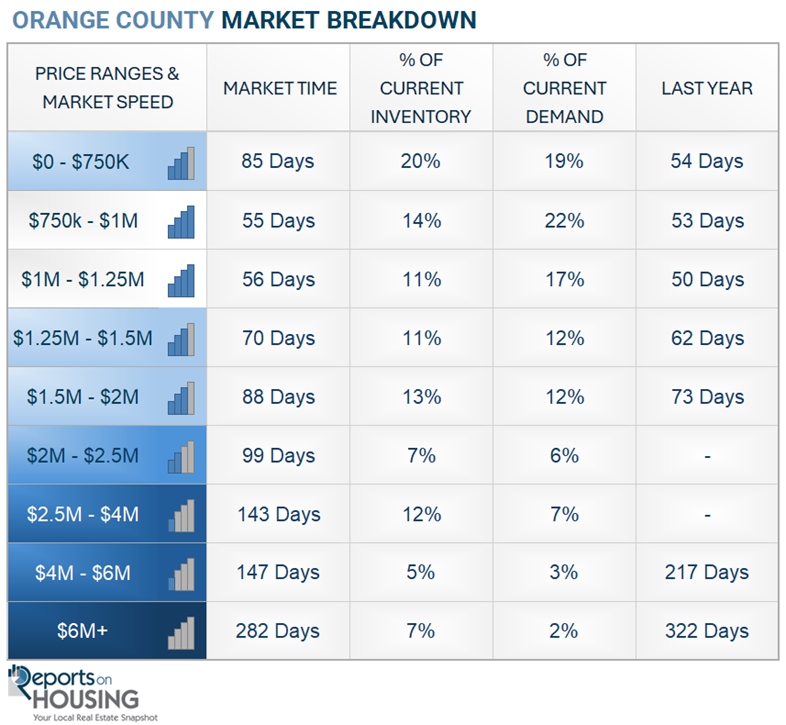
In the past two weeks, the Expected Market Time for homes priced between $2.5 million and $4 million decreased from 152 to 143 days. For homes priced between $4 million and $6 million, the Expected Market Time decreased from 188 days to 147. For homes priced above $6 million, the Expected Market Time increased from 278 to 282 days. Luxury is at 169 days overall. At this pace, a seller would be looking at becoming a pending sale around April 2026.
Orange County Housing Summary
- INVENTORY: The active listing inventory in the past couple of weeks decreased by 185 homes, down 4%, and now stands at 4,103, its lowest level since the start of April. Last year, there were 3,516 homes on the market, 587 fewer homes, or 14% less. The 3-year average before COVID (2017-2019) was 5,822, which is 42% higher. From January through October, 26% fewer homes came on the market compared to the 3-year average before COVID (2017-2019), 9,170 less. Yet, 2,138 more sellers came on the market this year than last, and 5,622 more compared to 2023.
- DEMAND: Buyer demand, the number of pending sales over the prior month, decreased by 59, down 4%, and now stands at 1,487. Last year, there were 1,458 pending sales, 2% fewer than today. The 3-year average before COVID (2017-2019) was 2,139, which is 44% higher.
- MARKET TIME: With supply and demand falling at a similar pace, the Expected Market Time, the number of days to sell all Orange County listings at the current buying pace, remained unchanged at 83 days in the past couple of weeks, its fastest pace since April. It is the highest start to November pace since 2022. Last year, it was 72 days, faster than today. The 3-year average before COVID (2017-2019) was 85 days, similar to today.
- LUXURY: In the past two weeks, the Expected Market Time for homes priced between $2.5 million and $4 million decreased from 152 to 143 days. For homes priced between $4 million and $6 million, the Expected Market Time decreased from 188 days to 147. For homes priced above $6 million, the Expected Market Time increased from 278 to 282 days.
- DISTRESSED HOMES: Short sales and foreclosures combined, comprised only 0.1% of all listings and 0.4% of demand. No foreclosures and three short sales are available today in Orange County, with a total of three distressed homes on the active market, down two from two weeks ago. Last year, nine distressed homes were on the market, similar to today.
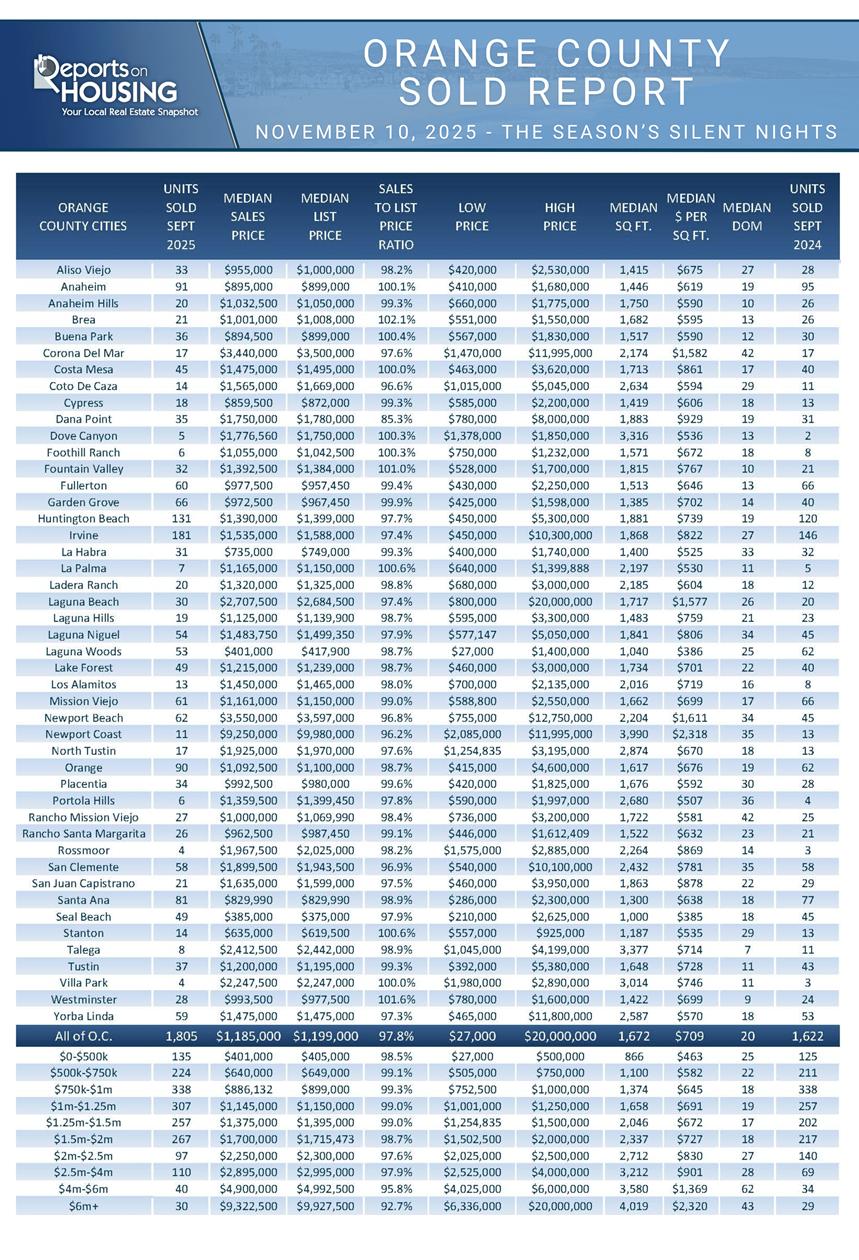
- CLOSED SALES: There were 1,805 closed residential resales in September, 11% higher than September 2024’s 1,622 sales, but down 4% from August 2025. The sales-to-list price ratio in Orange County was 97.8%. Foreclosures accounted for 0.2% of all closed sales, and there were no short sales. That means that 99.8% of all sales were sellers with equity.
Have a great week.
Sincerely,
Steven Thomas
Quantitative Economics and Decision Sciences
Copyright 2025—Steven Thomas, Reports On Housing—All Rights Reserved. This report may not be reproduced in whole or in part without express written permission from the author.