October 27, 2025
With mortgage rates at their lowest levels in over a year, housing supply up 18% from last year, and many homes still waiting for offers, it’s an excellent moment for buyers to make a move.
Now is a Great Time to Buy
Buying now will prove a wise decision, as the lower-rate environment is projected to continue into next year, fueling increased demand and a more competitive housing market in the coming spring.
Disneyland is known as the “Happiest Place on Earth,” yet it is also known for massive crowds and extremely long lines, especially during the summer and around holidays. Seasoned Disney fans know that there is a magic “window of opportunity” when the park first opens, that special first hour and a half where the lines are short and you can practically stroll onto the top rides. The moment those gates swing open at 8 AM, the pros hustle straight to their favorites. By 9:30, the crowds have poured in, and the lines grow longer by the minute.
Right now, and for the remainder of the year, is a window of opportunity for buyers before the market heats up after the New Year, growing hotter as housing moves towards spring. The current conditions are ideal. Mortgage rates dipped below 6.5% and are at their best level since September of last year. Buyer demand will wane as the year draws to a close. Many homes have been on the market for months without success, and sellers are more willing to negotiate.
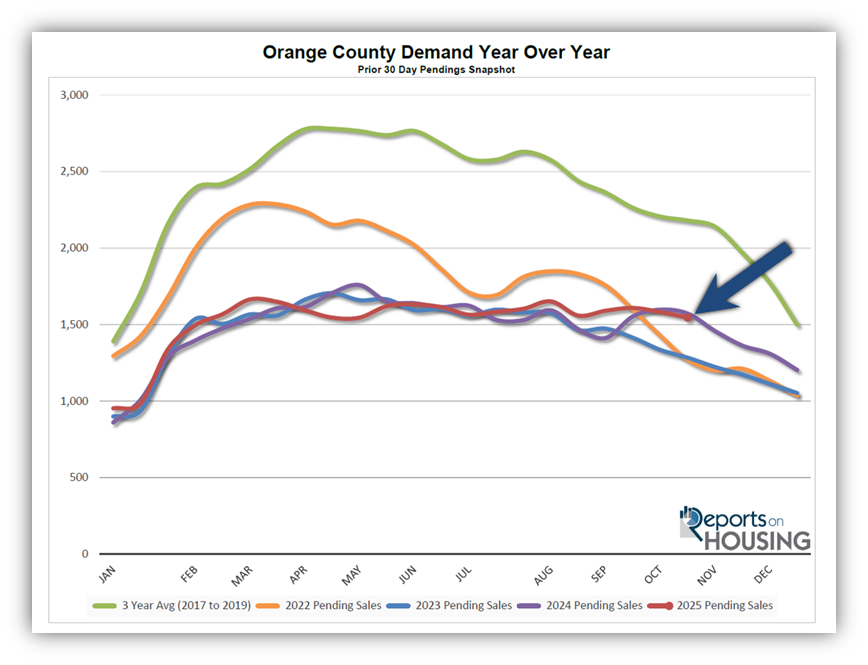
Mortgage rates dipped below 6.5% on September 3rd and have remained at these lows for 54 consecutive days. Rates are at their lowest levels since September last year. Last year, from August 20th to October 3rd, rates dropped below 6.5% for 45 consecutive days. It was by far the best mortgage rates of the year after eclipsing 7.5% in April 2024. The favorable rate environment ignited demand (a snapshot of the number of new pending sales over the prior month), jumping from 1,413 pending sales in mid-September to 1,598 in mid-October, a 13% uncharacteristic rise during the Fall Market. Despite rates climbing above 6.5% in early October and surpassing 7% by the end of the month, demand remained elevated through the end of the year. Yet the demand boost disappeared after ringing in 2025, as mortgage rates remained above 7% in January and February.
Mortgage rates rose back to 7% in October 2024 after U.S. economic data came in stronger than expected. The data continued to show economic resilience for the first half of this year as well. Yet the labor market has deteriorated considerably since June, and additional economic headwinds have emerged. As a result, mortgage rates have been slowly declining since, dropping just below 7% at the start of June. They bumped around 6.75% throughout July, and then dropped towards 6.5% in August. They broke below 6.5% at the beginning of September and have never looked back. Unlike last year, these rates are projected to remain at these lower levels through the end of the year and into 2026, with a weaker economy.
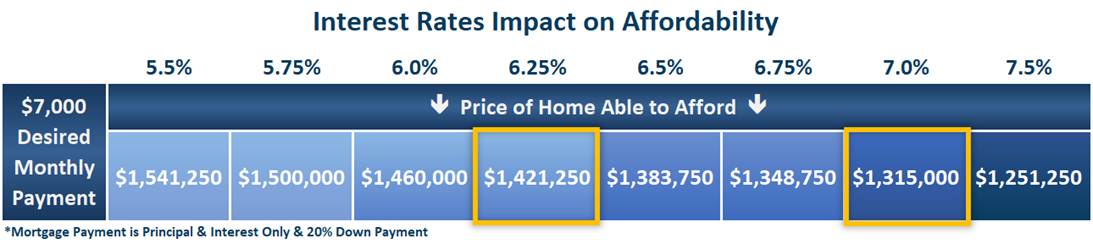
As rates drop, affordability improves. Many buyers have been waiting on the sidelines for a more favorable environment. For buyers looking for a $7,000 monthly payment with 20% down, at 7%, they were looking at a $1,315,000 home. At today’s 6.25% rate, they can now afford a home at $1,412,250, which translates into an additional $97,250 in purchasing power.
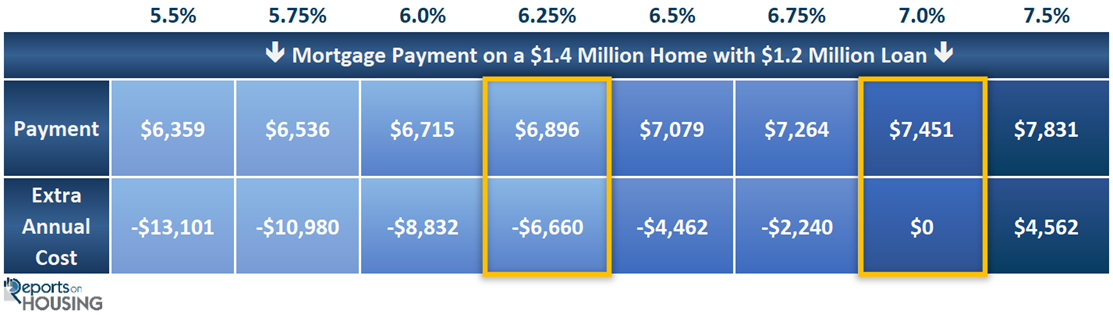
Another way to look at the improvement in affordability is to compare the payment on a specific-priced home as rates drop. For a $1.4 million home with 20% down, the payment is $7,451 at 7%. The payment drops to $6,896 per month at today’s 6.25% rate, a $555 savings per month, or $6,660 per year.
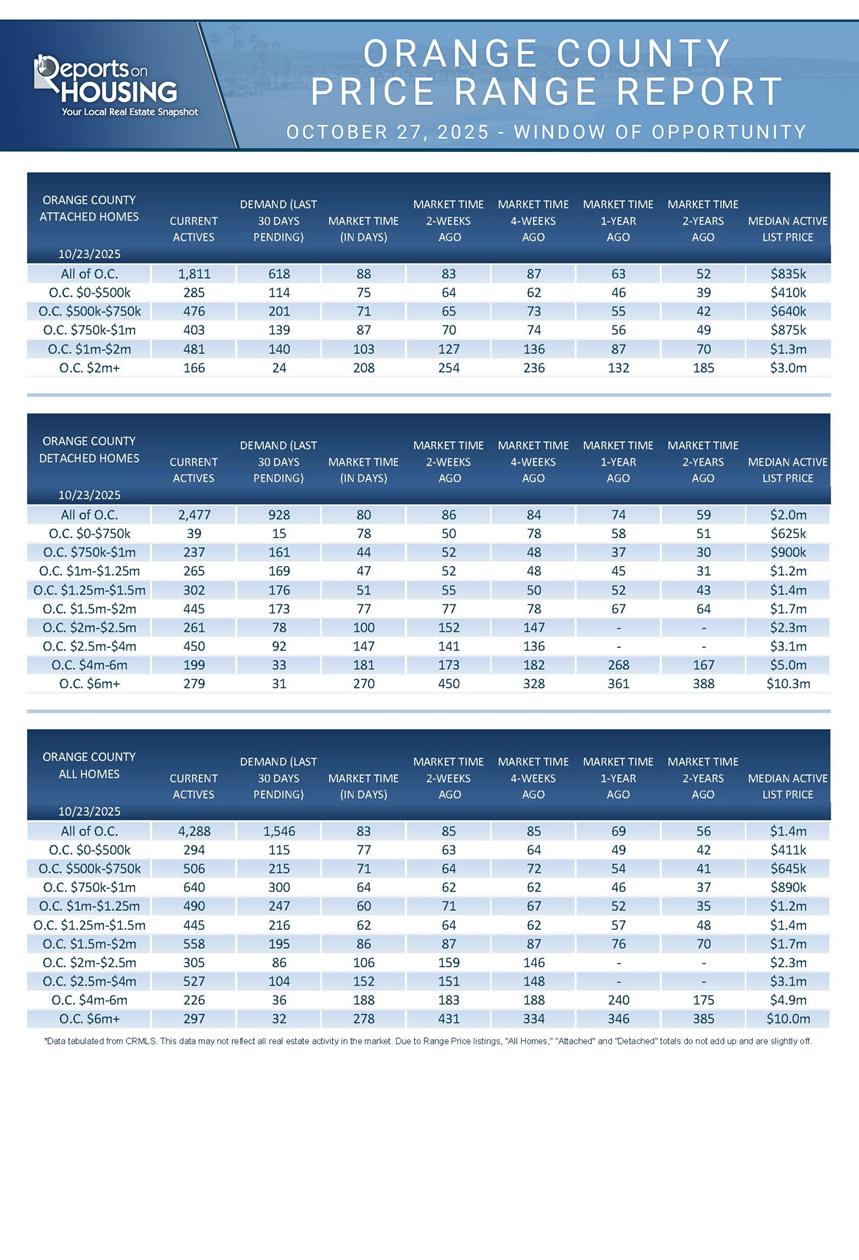
Not only are rates at their lowest level in a year, but the active inventory has also been elevated compared to the last couple of years. There are 4,288 homes on the market today, 648 more than last year’s 3,640, an 18% increase. It is 78% higher than in 2023, 1,882 more homes. Buyers have the most choices for this time of year since 2019, when there were 5,921.
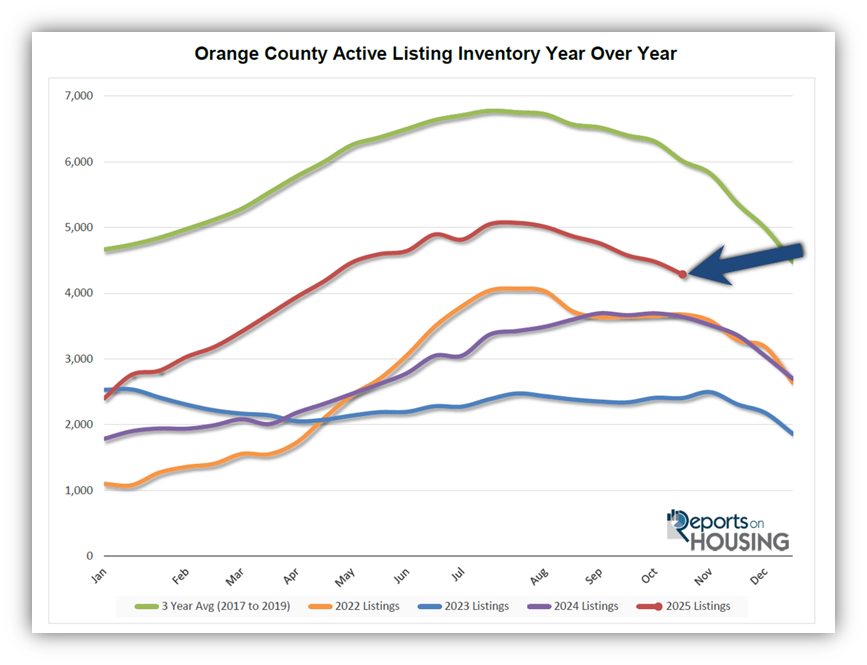
Homeowners have been unwilling to move due to their current, underlying, locked-in, low fixed-rate mortgage since rates climbed sharply in 2022. Yet, the last time rates were below 6% was August 2022, 38 months ago. Many homeowners are tired of waiting for rates to fall so that they can sell. Consequently, there are 10% more new sellers so far this year compared to last year, 2,221 extra FOR-SALE signs, and 28% more than in 2023, an additional 5,333 signs. These extra sellers have been accumulating over time, resulting in the stark rise in inventory this year.
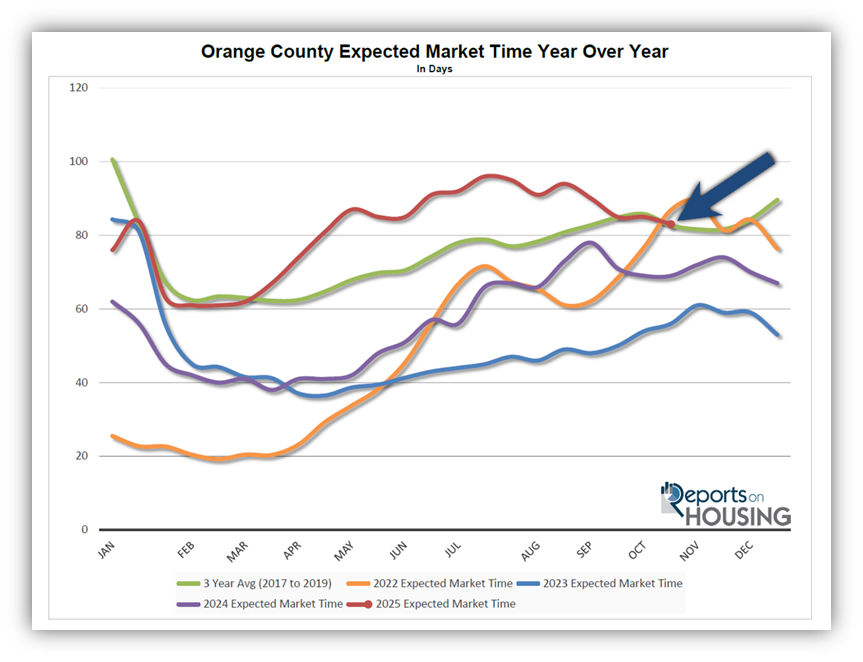
Many more sellers have been languishing on the market without success. Today’s Expected Market Time (the number of days it takes to sell all Orange County listings at the current buying pace) is at 83 days, its slowest late October pace since 2022. It was at 69 days last year, and 56 days in 2023. After sitting on the market for a long time, today’s sellers are much more willing to negotiate price and terms. It does not mean that a seller would be willing to entertain a “low-ball” offer, but they are more inclined to negotiate the price, pay some of the buyer’s closing costs, and even buy down the buyer’s interest rate by paying mortgage points.
REMEMBER: This is a “window of opportunity” for buyers. Mortgage rates are projected to remain below 6.5% through the end of the year and into 2026. That will be months at these lower levels compared to last year’s brief 45 days. The favorable mortgage rate environment is poised to ignite spring demand, the busiest time of the year for housing. From mid-January through March, demand accelerates far faster than the rise in available inventory. The Orange County housing market is poised to heat up significantly, and buyers who delay may later regret missing the ideal moment to purchase… right now.
Active Listings
The inventory dropped by 4% in the past couple of weeks.
The active listing inventory decreased by 190 homes over the past two weeks, a 4% decline, and now stands at 4,288, the largest drop of the year and its lowest level since April. With an elevated number of homes available, many more sellers have been unsuccessful. As a result, more homes are being pulled off the market and delisting at the fastest pace in years. For the first three weeks of October, 574 sellers threw in the towel and delisted compared to 353 during the same time last year. That is up 65% or an additional 231 towels. With more sellers coming off the market and the cyclical phenomenon of the fewest number of new sellers to close out the year, inventory will continue to fall rapidly.
Last year, the inventory was at 3,640 homes, 15% fewer, or 648 less. The 3-year average before COVID (2017-2019) was 6,010, an additional 1,722 homes, or 40% more.
Homeowners continue to “hunker down” in their homes, unwilling to move because of their current, underlying, locked-in, low fixed-rate mortgage. This trend has been easing from the lows established in 2023. Through September, 24,066 homes were placed on the market in Orange County, 8,347 fewer than the 3-year average before COVID (2017-2019), 26% less. In 2024, 21,845 homes entered the market, compared to 18,773 in 2023. More sellers are opting to sell in 2025. Yet, for the second month in a row, the number of homes coming on the market was fewer compared to the prior year. In September, 2,211 homes came on the market, 4% less than last year’s 2,303.
Demand
Demand decreased by 2% in the past couple of weeks.
Demand, a snapshot of the number of new pending sales over the prior month, decreased from 1,582 to 1,546 in the past couple of weeks, representing a 36-pending-sale drop, or 2%. Last year at this time, mortgage rates had just eclipsed 7% for the first time since July, and they remained elevated until the end of February with only a few exceptions. Today’s more favorable mortgage rate environment will translate to elevated demand to close out the year and will instigate stronger demand into 2026. Typically, demand drops at a pace similar to that of inventory, but it is currently falling much more slowly. This is resulting in the housing market improving from week to week.
Last year, demand was 1,572, with 26 additional pending sales, or 2% more. The 3-year average before COVID (2017-2019) was 2,180 pending sales, 41% higher than today, representing an additional 634 pending sales.
As the Federal Reserve has indicated, it is essential to watch all economic releases for signs of slowing. That is the only path to lower mortgage rates at this time. These releases can cause mortgage rates to rise or fall, depending on how they compare with market expectations. Yet, with the government shutdown, most critical data will not be released until the shutdown is resolved. This week, the Federal Reserve meets and will hold a news conference on Wednesday, ultimately revealing its appetite to cut rates now and in the near future — a crucial day for mortgage rates.
Expected Market Time
The Expected Market Time dropped to its fastest pace since April.
With the supply of available homes falling by 190 homes, down 4%, and demand dropping by 36 pending sales, down 2%, the Expected Market Time (the number of days it takes to sell all Orange County listings at the current buying pace) decreased from 85 to 83 days in the past couple of weeks, its lowest reading since April. Yet, it is still the highest end-of-October reading since 2022’s 87 days.
Last year, it was 69 days, faster than today. The 3-year average before COVID was 85 days, similar to today.
The Expected Market Time for condominiums and townhomes increased from 83 to 88 days in the past two weeks. It was at 63 days last year. For detached homes, the Expected Market Time decreased from 86 to 80 days. It was 74 days a year ago, slightly faster than today. The detached home market is marginally stronger than the attached home market.
Luxury End
The luxury market improved over the past couple of weeks.
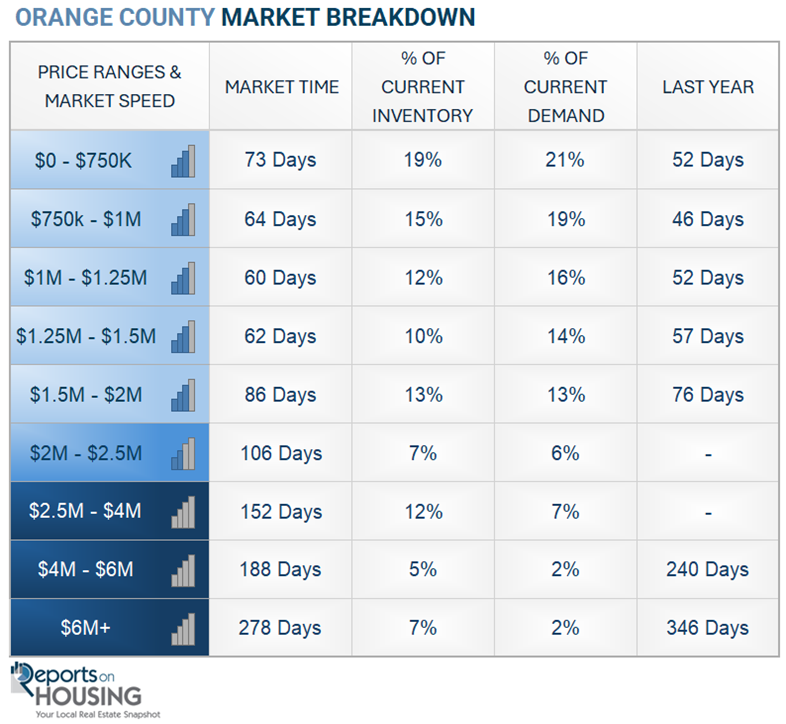
The luxury home inventory priced above $2.5 million (the top 10% of the Orange County housing market) decreased from 1,079 to 1,050, a decline of 29 homes, or 3%. Luxury demand increased by five pending sales, up 3%, to 172. The Expected Market Time for luxury homes priced above $2.5 million decreased from 194 to 183 days. The luxury market improved for the first time since the start of the government shutdown.
In the past two weeks, the Expected Market Time for homes priced between $2.5 million and $4 million increased from 151 to 152 days. For homes priced between $4 million and $6 million, the Expected Market Time remained unchanged at 188 days. For homes priced above $6 million, the Expected Market Time decreased from 431 to 278 days. Luxury is at 183 days overall. At this pace, a seller would be looking at becoming a pending sale around April 2026.
Orange County Housing Summary
- INVENTORY: The active listing inventory in the past couple of weeks decreased by 190 homes, down 4%, and now stands at 4,288, its largest drop of the year and its lowest level since April. Last year, there were 3,640 homes on the market, 648 fewer homes, or 15% less. The 3-year average before COVID (2017-2019) was 6,010, which is 40% higher. From January through September, 26% fewer homes came on the market compared to the 3-year average before COVID (2017-2019), 8,347 less. Yet, 2,221 more sellers came on the market this year than last, and 5,333 more compared to 2023.
- DEMAND: Buyer demand, the number of pending sales over the prior month, decreased by 36, down 2%, and now stands at 1,546. Last year, there were 1,572 pending sales, 2% more than today. The 3-year average before COVID (2017-2019) was 2,180, which is 41% higher.
- MARKET TIME: With the inventory falling at a faster pace than demand, the Expected Market Time, the number of days to sell all Orange County listings at the current buying pace, decreased from 86 to 83 days in the past couple of weeks, its fastest pace since April. It is the highest October level since 2022. Last year, it was 69 days, faster than today. The 3-year average before COVID (2017-2019) was 85 days, similar to today.
- LUXURY: In the past two weeks, the Expected Market Time for homes priced between $2.5 million and $4 million increased from 151 to 152 days. For homes priced between $4 million and $6 million, the Expected Market Time remained unchanged at 188 days. For homes priced above $6 million, the Expected Market Time decreased from 431 to 278 days.
- DISTRESSED HOMES: Short sales and foreclosures combined, comprised only 0.2% of all listings and 0.2% of demand. Only four foreclosures and four short sales are available today in Orange County, with a total of eight distressed homes on the active market, up one from two weeks ago. Last year, five distressed homes were on the market, similar to today.
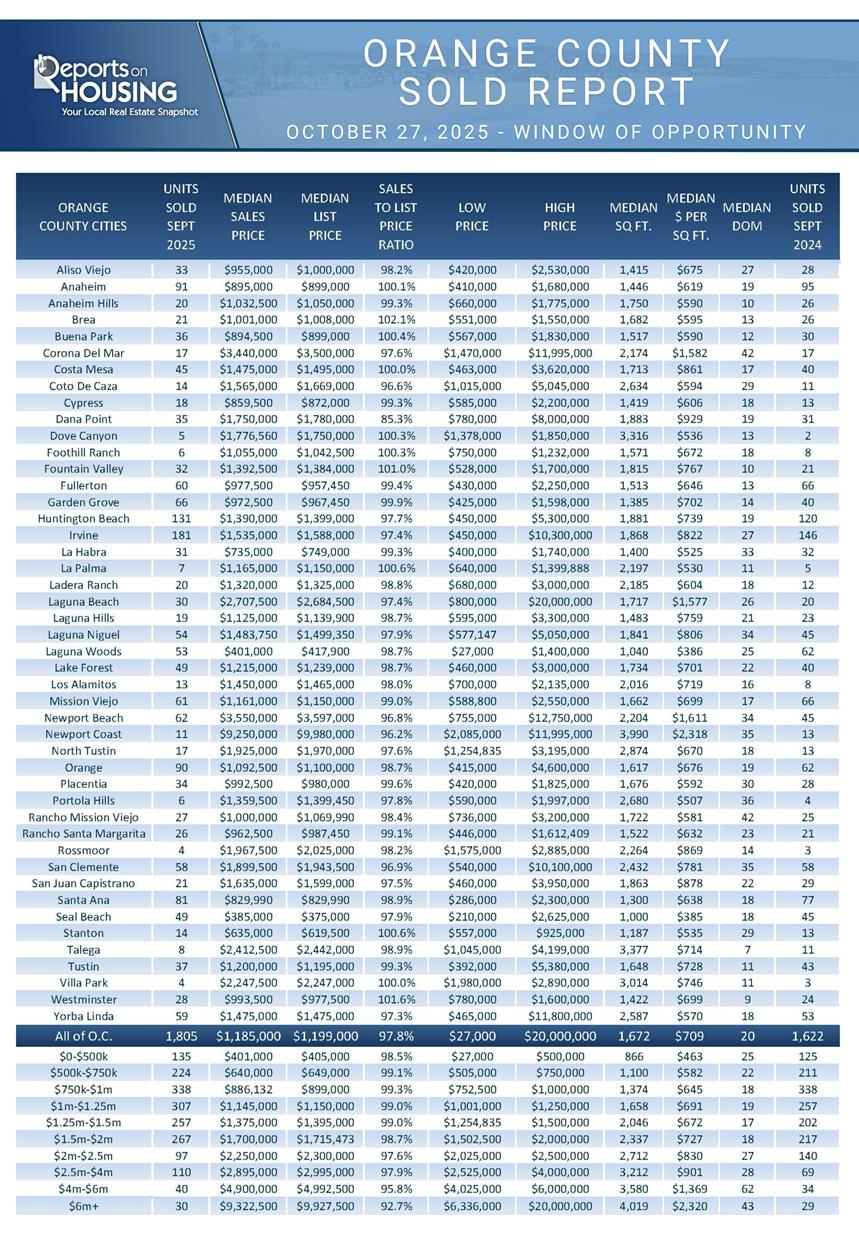
- CLOSED SALES: There were 1,805 closed residential resales in September, 11% higher than September 2024’s 1,622 sales, but down 4% from August 2025. The sales-to-list price ratio in Orange County was 97.8%. Foreclosures accounted for 0.2% of all closed sales, and there were no short sales. That means that 99.8% of all sales were sellers with equity.
Have a great week.
Sincerely,
Steven Thomas
Quantitative Economics and Decision Sciences
Copyright 2025—Steven Thomas, Reports On Housing—All Rights Reserved. This report may not be reproduced in whole or in part without express written permission from the author.