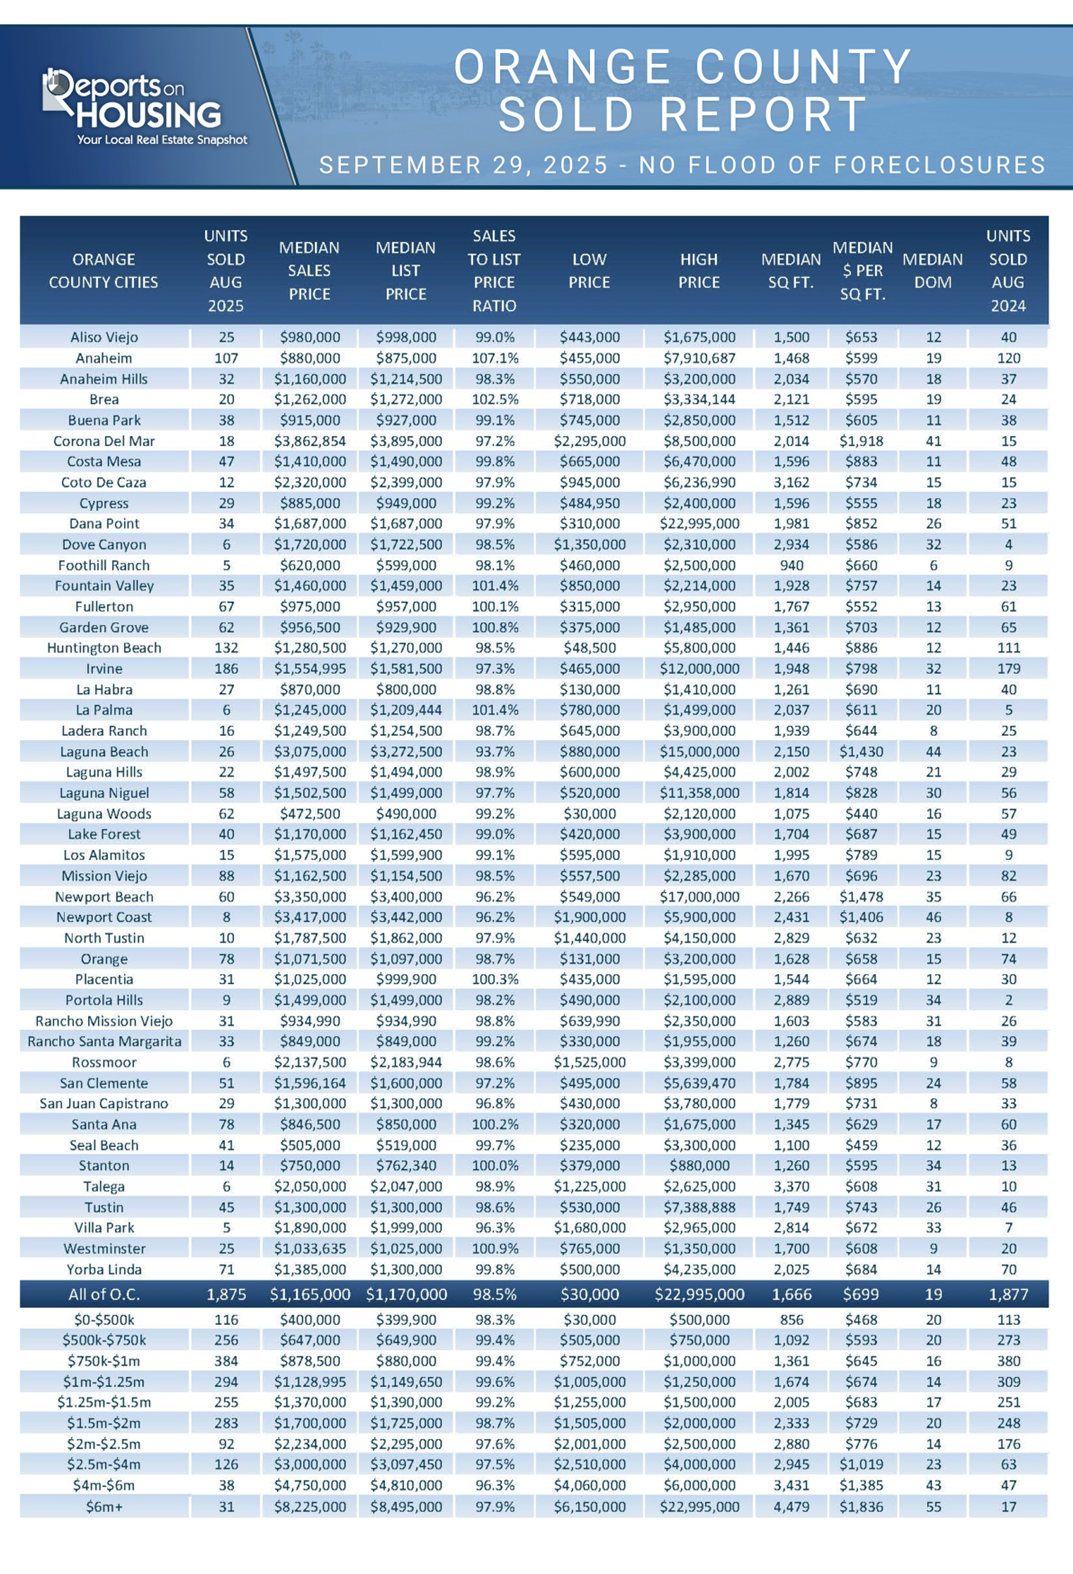
September 29, 2025
With the jobs market slowing and the collapse in home affordability due to the high-rate environment, many wrongly assume that there will be a sharp increase in foreclosure and short-sale activity that rivals the Great Recession.
A Foreclosure Breakdown
Homeowners across the U.S. are healthier than ever before, which will prevent a sharp rise in distressed sales.
People often jump to incorrect conclusions. When an airplane experiences turbulence, many passengers assume that the plane is going to crash. Many flights experience turbulence, but it does not necessarily mean disaster is imminent. In watching a favorite sports team fall decisively behind at the beginning of a game, fans often give up hope, feeling certain that their team will lose. Falling behind early is a challenge, but it does not determine the outcome. There are countless examples of teams clawing their way back to victory.
Similarly, many have drawn an incorrect conclusion regarding housing. The housing market has been critically unaffordable for over three years, resulting in a waterfall dive in the number of closed sales. As home prices skyrocketed during the pandemic, followed by mortgage rates more than doubling, the pool of potential buyers evaporated. As a result, many people have mistakenly assumed that the housing market would resemble the Great Recession, with a flood of foreclosures. Unfortunately, the general public often jumps to conclusions without considering all the facts and trends.
The Great Recession was fueled by a credit bubble inflated by loose lending standards, which allowed just about anyone to obtain a loan. There were subprime loans, pick-a-payment plans, zero-down-payment loans, teaser-rate adjustable mortgages, and numerous fraudulent lending practices. Many borrowers qualified despite having poor credit scores. These high-risk borrowers were vulnerable to fluctuations in their rates or economic changes. Thus, a flood of foreclosure and short sale activity developed. It is far different today. With tight lending standards that date back to the Dodd-Frank Act of 2010, the number of foreclosures and short sales has dwindled to only a handful. In Orange County, there are only four foreclosures and four short sales available for purchase, totaling eight. That is only 0.2% of the 4,576 homes available today. Last year, there was a total of five, and there were six two years ago. The 3-year average number of foreclosures and short sales before COVID (2017 to 2019) was 70, considerably higher than today. In September 2008, there were 5,650 distressed homes available to purchase.
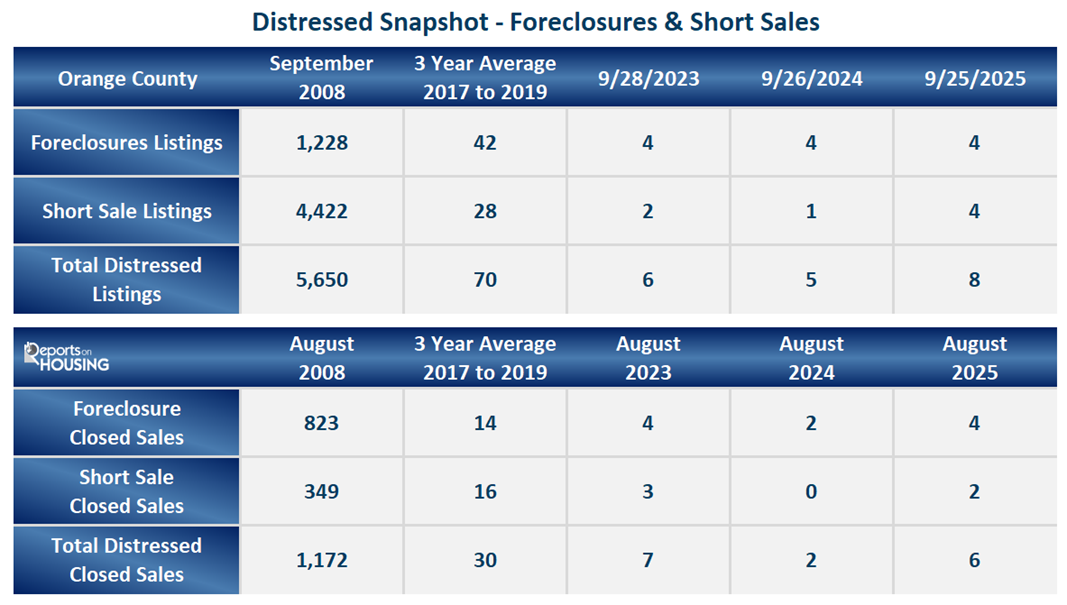
A similar story unfolds for closed sales. There were four foreclosure closed sales and two short sale closed sales in August, totaling six, or 0.3% of all sales. Last year there were two total, and there were seven two years ago. The pre-pandemic 3-year average was 30. In August 2008, there were 1,172, a revealing 51% of all closed sales.
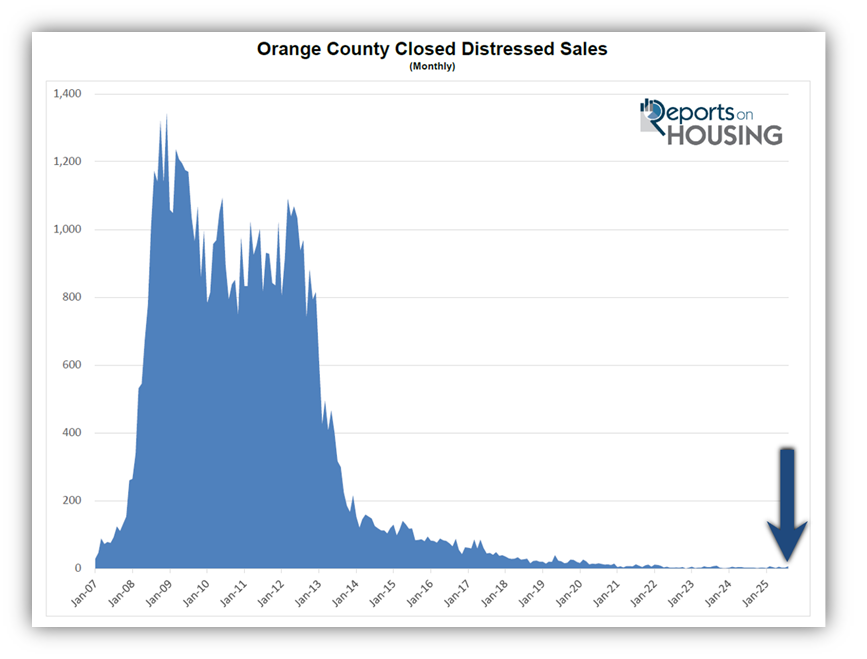
People rooting for the demise of the housing market broadcast the “substantial changes” in foreclosure activity. When there are virtually no distressed sales, even a slight rise can be distorted when examining the percentage change. For example, the number of distressed sales “jumped” from two to six, which is a 200% increase. The percentage change lacks proper context. In these circumstances, it is better to examine where distressed sales have occurred over time. The real story is that the number of distressed will increase and return to pre-pandemic levels. The rise will not be indicative of a flood of foreclosures and short sales, but more of a return to normal levels.
The national delinquency rate is currently at 3.27% of all loans, which remains at historically low levels. It is still far below pre-pandemic levels of 3.85%. From 2000 to 2005, the delinquency rate averaged 4.35%. There is a limited number of homeowners across the United States who have entered the foreclosure process.
Today’s housing stock is the strongest ever. Ever since the Great Recession, buyers have been purchasing homes with stricter qualifications and lending standards, higher down payments, strong credit, good jobs, and low fixed payments. There is a record amount of tappable equity (the amount of equity a homeowner can use for a loan while still retaining at least 20% equity), a record number of equity-rich properties (those with 50% or more equity), and a record number of homeowners who own their homes free and clear. There will be no repeat of the Great Recession because of the strength of the homeowner and the limited supply, even if the supply eventually returns to pre-pandemic levels. There will be no flood of foreclosures.
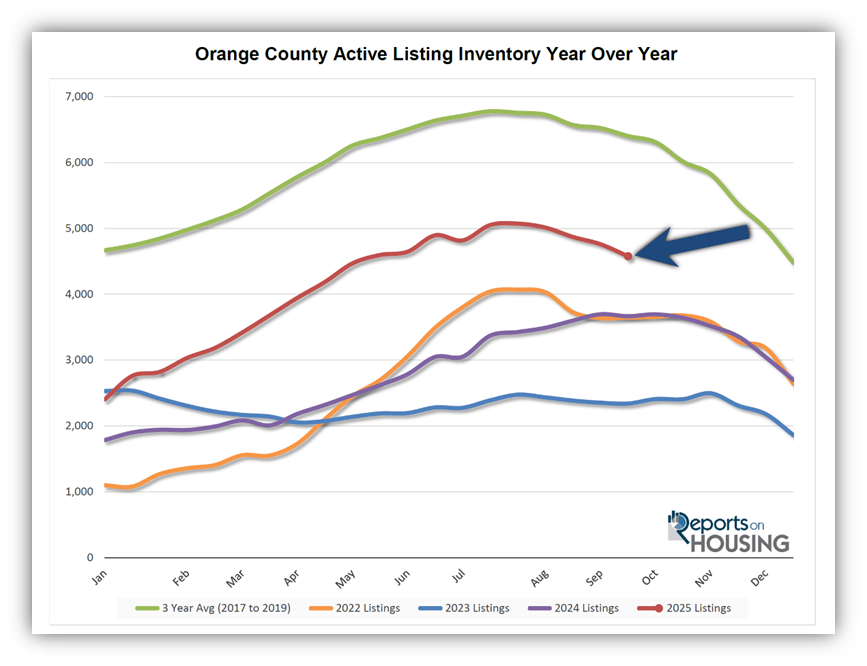
Active Listings
The inventory plunged by 4% in the past couple of weeks, its largest drop of the year.
The active listing inventory decreased by 182 homes over the past two weeks, representing a 4% decrease, and now stands at 4,576, its lowest level since May. It was the largest drop of the year. There is a chance that rates will drop at the end of the week, following Friday’s critical jobs report, which details the number of jobs created or lost. If it shows further weakness, rates could approach 6%, triggering more buyer demand, which will ultimately reduce the number of homes available for sale. The inventory is already heading lower and will continue to drop throughout the Autumn Market. As more homes are pulled off the market due to a lack of success during the holiday season, beginning in mid-November, along with the fewest number of homes coming on the market in November and December, the inventory will drop at a faster pace to close out the year.
Last year, the inventory was at 3,666 homes, 20% lower, or 910 fewer. The 3-year average before COVID (2017-2019) was 6,400, an additional 1,824 homes, or 40% more.
Homeowners continue to “hunker down” in their homes, unwilling to move due to their current underlying, locked-in, low fixed-rate mortgage. This trend has been easing from the lows established in 2023. Through August, 21,823 homes were placed on the market in Orange County, 7,561 fewer than the 3-year average before COVID (2017-2019), 26% less. In 2024, only 19,542 homes entered the market, and in 2023, it was only 16,770. More sellers are opting to sell in 2025. Yet, for the first time since November 2023, the number of homes coming on the market was fewer compared to the prior year. In August, 2,363 homes came on the market, 5% less than last year’s 2,490.
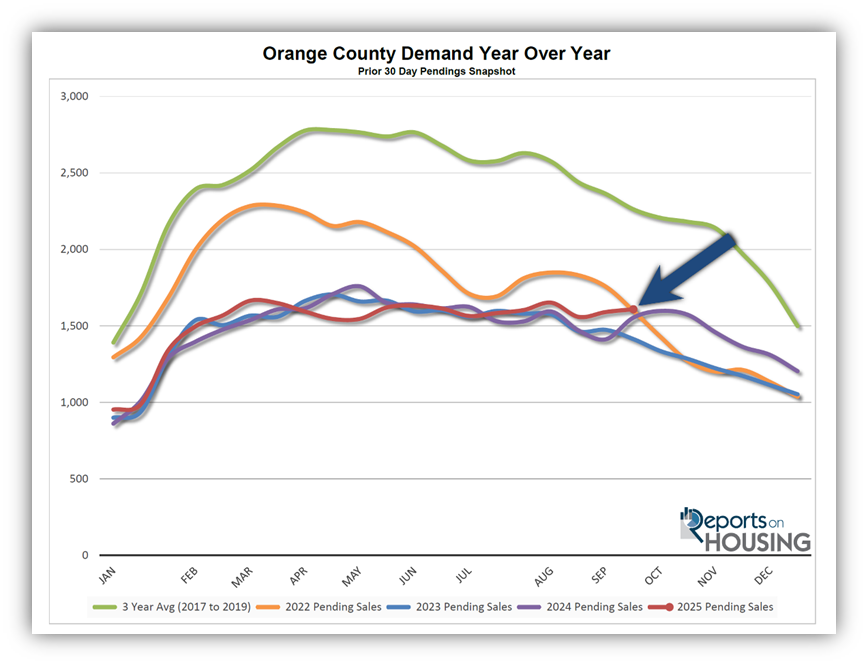
Demand
Demand increased by 1% in the past couple of weeks.
Demand, a snapshot of the number of new pending sales over the prior month, increased from 1,591 to 1,609 in the past couple of weeks, representing an 18-pending-sale rise, or 1%. That is the highest demand level since the end of March. This year’s peak occurred in mid-March at 1,665 pending sales, only 3% higher than today, or 56 more. Rates dropped below 6.5% on September 3rd, for the first time since last October. As of September 25th, it has been 23 days below that threshold. Last year, it was only below 6.5% for 47 days. This time around, if it remains at these levels for months, the housing market will begin to thaw, home buyer demand will increase, and the number of closed sales will rise as well. Carefully monitoring the job market and inflation trends will pave the path for mortgage rates.
Last year, demand was 1,554, with 55 fewer pending sales, or 3% less. The 3-year average before COVID (2017-2019) was 2,262 pending sales, 41% higher than today, representing an additional 653 pending sales.
As the Federal Reserve has indicated, watching all economic releases for signs of slowing is essential. That is the only path to lower mortgage rates at this time. These releases can cause mortgage rates to move higher or lower, depending on how they compare to market expectations. This week is Jobs Week, which includes the number of job openings, wages, and the number of jobs created or lost – one of the month’s most important economic data points.
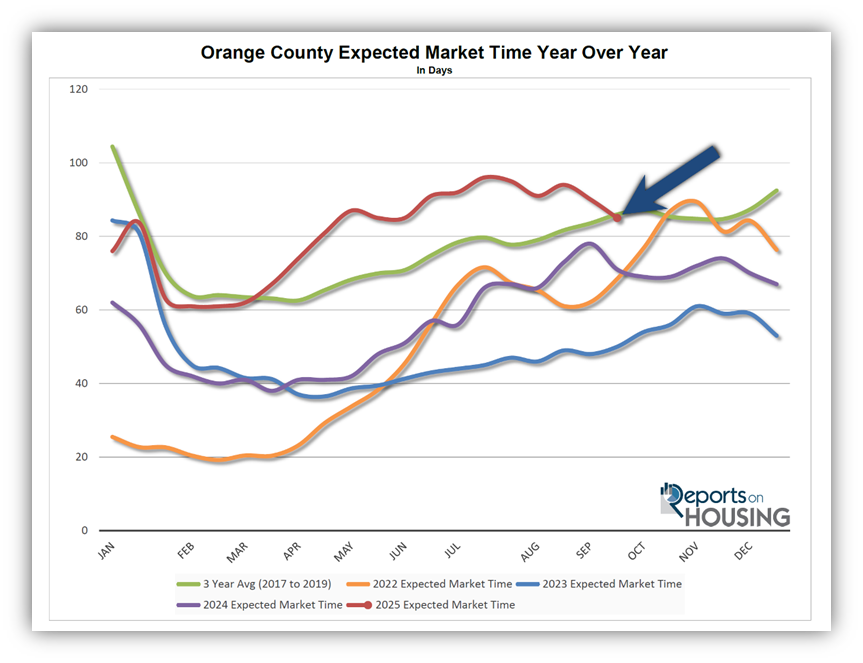
Expected Market Time
The Expected Market Time dropped by five days.
With the supply of available homes falling by 182 homes, down 4%, and demand rising by 18 pending sales, up 1%, the Expected Market Time (the number of days it takes to sell all Orange County listings at the current buying pace) decreased from 90 to 85 days in the past couple of weeks, its lowest level since the beginning of June. Yet, 85 days is the highest mid-September reading since 2019, before the pandemic.
Last year, it was 71 days, faster than today. The 3-year average before COVID was 86 days, similar to today.
The Expected Market Time for condominiums and townhomes decreased from 93 to 87 days in the past two weeks. It was at 61 days last year. For detached homes, the Expected Market Time decreased from 88 to 84 days. It was 77 days a year ago. The detached home market is slightly stronger than the attached home market.
Luxury End
The luxury market continued to improve dramatically over the past couple of weeks.
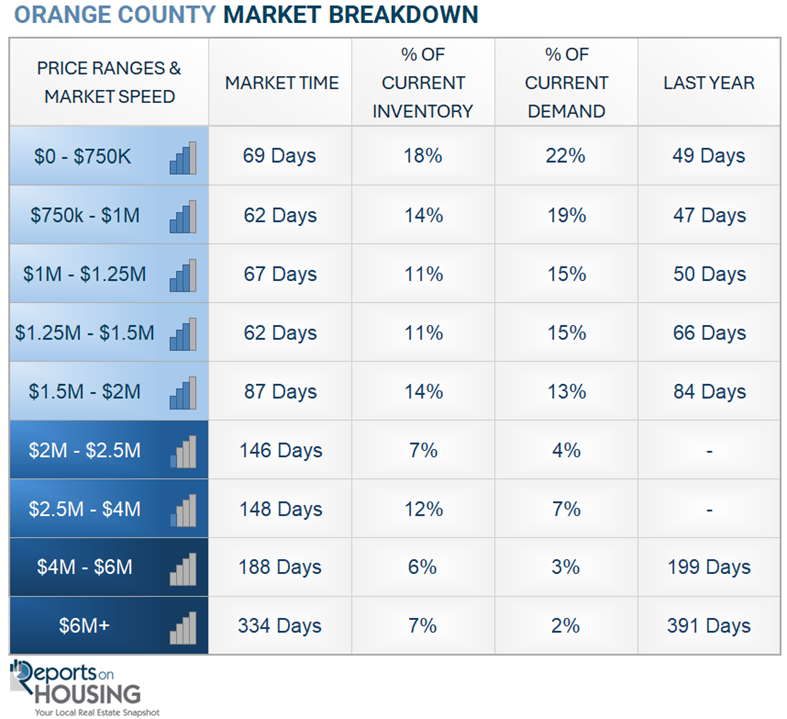
The luxury inventory of homes priced above $2.5 million (the top 10% of the Orange County housing market) decreased from 1,156 to 1,135 homes, a decline of 21 homes, or 2%. Luxury demand increased by 21 pending sales, up 13%, and now stands at 182, its highest level since June. The Expected Market Time for luxury homes priced above $2.5 million dropped from 215 to 187 days, its best reading since the end of March. With Wall Street continuing to outperform expectations, along with an improvement in overall demand due to falling rates, the luxury market has strengthened.
In the past two weeks, the Expected Market Time for homes priced between $2.5 million and $4 million decreased from 163 to 148 days. For homes priced between $4 million and $6 million, the Expected Market Time decreased from 224 to 188 days. For homes priced above $6 million, the Expected Market Time decreased from 447 to 334 days. Luxury is at 182 days overall. At this pace, a seller would be looking at becoming a pending sale around March 2026.
Orange County Housing Summary
- INVENTORY: The active listing inventory in the past couple of weeks decreased by 182 homes, down 4%, and now stands at 4,576, its largest drop of the year. Last year, there were 3,666 homes on the market, 910 fewer homes, or 20% less. The 3-year average before COVID (2017-2019) was 6,400, which is 40% higher. From January through August, 26% fewer homes came on the market compared to the 3-year average before COVID (2017-2019), 7,561 less. Yet, 2,281 more sellers came on the market this year than last, and 5,053 more compared to 2023.
- DEMAND: Buyer demand, the number of pending sales over the prior month, increased by 18 homes, up 1%, and now stands at 1,609, its highest level since the end of March. Last year, there were 1,591 pending sales, 3% lower than today. The 3-year average before COVID (2017-2019) was 2,262, which is 41% higher.
- MARKET TIME: With inventory falling and demand rising, the Expected Market Time, the number of days to sell all Orange County listings at the current buying pace, decreased from 90 to 86 days in the past couple of weeks, its lowest level since June. Yet, it is still the highest end-of-September level since 2019. Last year, it was 71 days, slightly faster than today. The 3-year average before COVID (2017-2019) was 86 days, similar to today.
- LUXURY: In the past two weeks, the Expected Market Time for homes priced between $2.5 million and $4 million decreased from 163 to 148 days. For homes priced between $4 million and $6 million, the Expected Market Time decreased from 224 to 188 days. For homes priced above $6 million, the Expected Market Time decreased from 447 to 334 days.
- DISTRESSED HOMES: Short sales and foreclosures combined, comprised only 0.2% of all listings and 0.2% of demand. Only four foreclosures and four short sales are available today in Orange County, with a total of eight distressed homes on the active market, down one from two weeks ago. Last year, five distressed homes were on the market, similar to today.
- CLOSED SALES: There were 1,875 closed residential resales in August, nearly identical to August 2024’s 1,877 sales, and down 3% from July 2025. The sales-to-list price ratio was 98.5% for Orange County. Foreclosures accounted for 0.2% of all closed sales, and short sales accounted for 0.1%. That means that 99.7% of all sales were sellers with equity.
Have a great week.
Sincerely,
Steven Thomas
Quantitative Economics and Decision Sciences
Copyright 2025—Steven Thomas, Reports On Housing—All Rights Reserved. This report may not be reproduced in whole or in part without express written permission from the author.