September 2, 2025
Home affordability has been at crisis levels ever since mortgage rates rocketed higher in 2022, impacting the housing market in so many ways.
An Affordability Crunch
Mortgage rates have been stuck at higher levels for three years now, floating between 6.5% and 7.5% with very few exceptions.
Everything is a lot more expensive compared to 2019, before the pandemic that changed the world and shut down the global economy and trade. Groceries have increased by 28%. Beef is up 52% and eggs are up 87%. The price of dining out at a restaurant is up 32%. New cars are up by 20%, and used cars jumped by 31%. Everyone’s wallets have been stretched.
Nothing was hit harder than housing. Monthly rents have increased by 29% nationwide, and home values soared 51%. Household incomes in California have only increased by 15% since 2019. In looking at home affordability, it is critical to look at home prices, household incomes, and the prevailing mortgage rate. The gap between the rise in home prices and incomes explains why housing affordability quickly became an issue as the pandemic wore on. Then in 2022, mortgage rates rocketed from 3.25% in January to 7.37% in October. Home affordability was squeezed. Not only did prices surge, but the jump in rates created a crisis in home affordability.
During the pandemic, 30-year mortgage rates reached record low levels. In fact, in 2020 and 2021, there were a series of new record lows, with a total of 16 new records reached in 2020, and one in 2021. The lowest rate on record was achieved in January 2021 at 2.65%. Despite rapidly increasing home values (utilizing the Zillow Home Value Index), payments for the typical home in Orange County did not change much. In May 2018, the typical home payment was $2,917. In January 2021, it had dropped to $2,573 due to the record low rate. By January 2022, the payment had grown to $3,340, up $423 per month since May 2018.
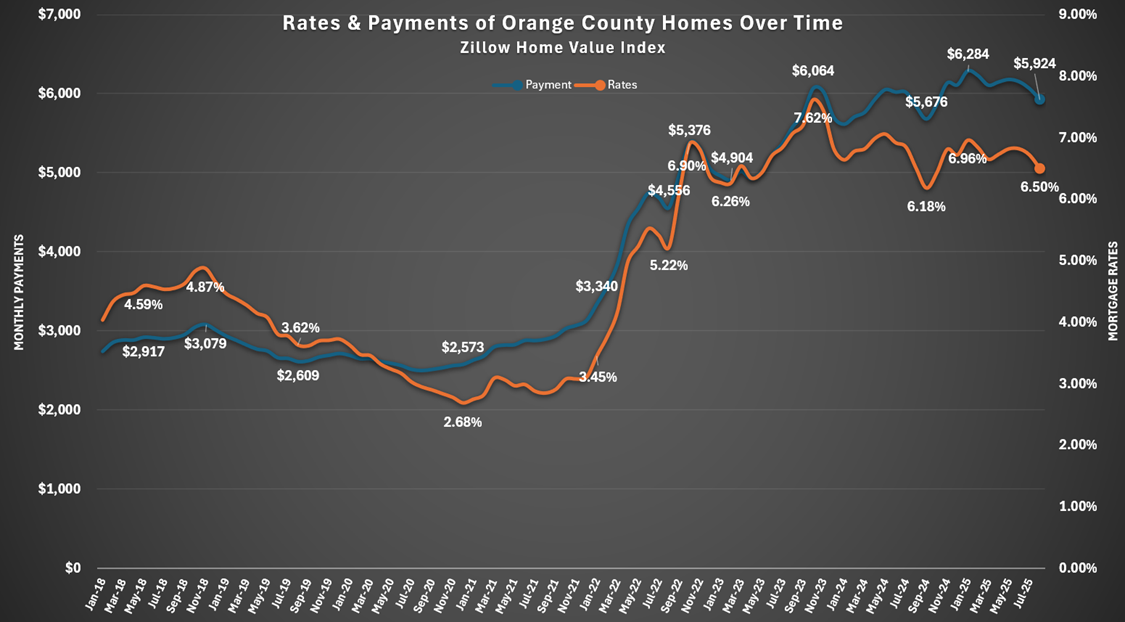
As rates climbed in 2022, home values did not stop growing until June of that year, rising 41% from January 2020. The typical house payment grew from $3,340 in January 2022 to $4,336 in April, just a few months later. It eclipsed $5,000 in October 2022 and $6,000 in November 2023. The payment on the typical home has remained above $6,000 from November 2024 through July 2025. In August, rates dropped to their lowest level since last October, 6.5%, and the payment finally improved to $5,924, its lowest level since last October. Even at $5,924, that is still $2,584 more per month, or $31,008 per year, compared to January 2022, before rates rapidly rose.
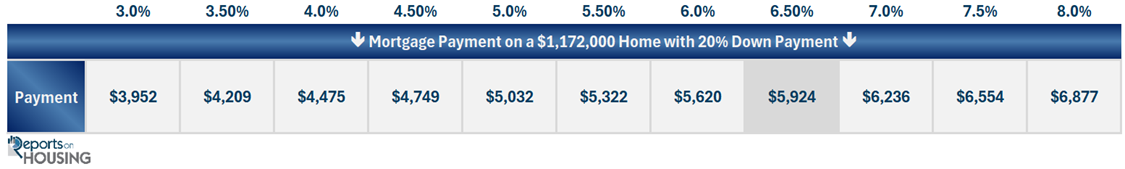
For home affordability to improve, mortgage rates need to drop further. At the current Zillow Home Price Value for Orange County, $1,172,000, the payment would drop by $304 per month, or $3,648 per year, if mortgage rates ease to 6%. At 5.5%, it would be a $602 per month or $7,224 per year improvement. The lower the mortgage rates drop, the more home affordability improves. Every half-of-a-percent drop is a substantial increase in home affordability, opening up the pathway to a significant rise in buyer demand.
Many expect home values to plunge to improve affordability, similar to the Great Recession. Yet, the Great Recession was fueled by loose lending requirements, pick-a-payment plans, teaser-rate adjustable mortgages, subprime loans, zero-down loans, fraudulent lending practices, elevated bankruptcies, and surging delinquencies, short sales, and foreclosures. Today’s U.S. housing stock is the healthiest ever: 40% own their homes free and clear, record equity-rich (50% plus equity), low fixed-rate mortgages, large down payments, strong credit, tight lending requirements, and great jobs. The national delinquency rate is at 3.35%, considerably lower than the nearly 4% level before the pandemic, or the 4.27% average between 2000 and 2005.
Prices could drop in the low single digits due to increased inventories that are approaching pre-pandemic levels, but there is no path to plunging prices. This year’s supply is higher than in the past couple of years, and it is being matched against similar year-over-year ultra-low demand levels that have remained unchanged since rates exceeded 7% in October 2022. There are currently 4,869 homes on the market in Orange County, 35% more than last year’s 3,599 level, and more than double 2023’s 2,385 homes. Despite the higher mortgage rate environment, home values climbed in 2023 due to a limited inventory. In 2024, they continued to climb, but at a slower pace, due to a higher inventory. This year, home values are starting to slowly fall as the inventory makes its way towards 2019 levels.
The slight declines in home values only help home affordability improve marginally. In the end, it will take a significant drop in mortgage rates to drastically boost affordability and ultimately thaw out a frozen housing market.
Active Listings
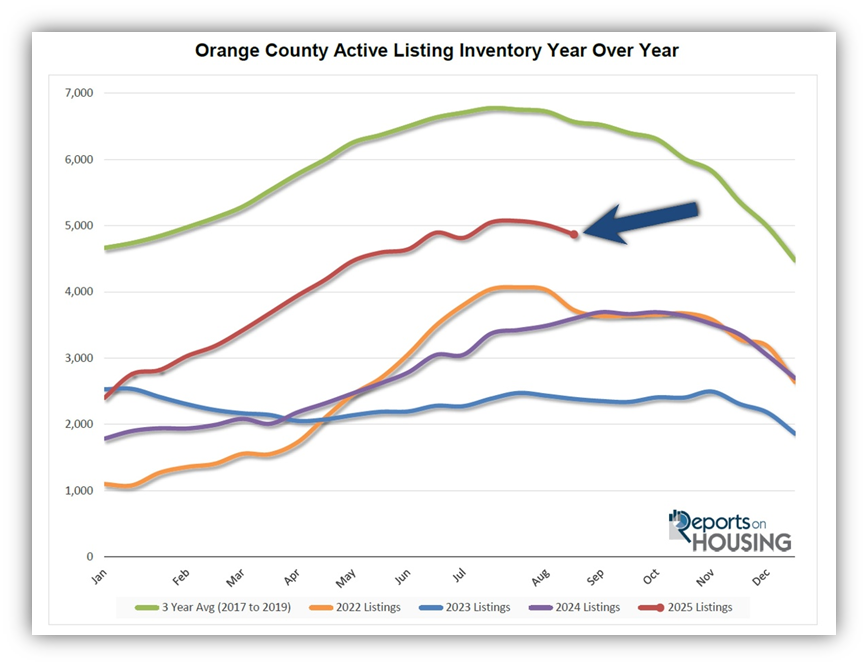
The inventory decreased by 142 homes in the past couple of weeks, its largest drop of the year.
The active listing inventory decreased by 142 homes over the past two weeks, representing a 3% decrease, and now stands at 4,869. It now looks like the inventory peak was reached at the end of July at 5,071, its first normal peak in several years. The housing market transitions to the Autumn Market as of the start of September. The kids are back in school, summer vacations and all the summer distractions fade after Labor Day weekend. Expect the housing inventory to decline slowly for the remainder of the year. It will pick up steam and drop at a faster rate during the Holiday Market, from mid-November through the end of the year. Now that both the Spring and Summer Markets are in the rearview mirror, many sellers will throw in the towel. An elevated number of sellers will pull their homes off the market for the remainder of the year.
Last year, the inventory was at 3,599 homes, 26% lower, or 1,270 fewer. The 3-year average before COVID (2017-2019) was 6,569, an additional 1,700 homes, or 35% more.
Homeowners continue to “hunker down” in their homes, unwilling to move due to their current underlying, locked-in, low fixed-rate mortgage. This trend has been easing from the lows established in 2023. Through August, 21,823 homes were placed on the market in Orange County, 7,561 fewer than the 3-year average before COVID (2017-2019), 26% less. In 2024, only 19,542 homes entered the market, and in 2023, it was only 16,770. More sellers are opting to sell in 2025. Yet, for the first time since November 2023, fewer homes came on the market compared to the prior year. In August, 2,363 homes came on the market, 5% less than last year’s 2,490.
Demand
Demand decreased by 6% in the past couple of weeks, its largest drop of the year.
Demand, a snapshot of the number of new pending sales over the prior month, decreased from 1,652 to 1,559 in the past couple of weeks, representing a 93-pending-sale rise, or 6%, its largest drop of the year. The Labor Day weekend holiday, which marks the last hurrah of summer, negatively impacts demand. For many, it is one last time to hit the beach or pool. It’s another excuse for a neighborhood or family party. Of course, there is a barbecue involved. The Orange County housing market has officially transitioned to the Autumn Market. That is when demand typically slowly falls for the remainder of the year. It appears as if this year will be no different. The only caveat to that is if the labor market deteriorates further, necessitating further action from the Federal Reserve. If that occurs, mortgage rates could ease towards the 6% level, similar to last year. That scenario would lead to improved demand and an increase in closed sales.
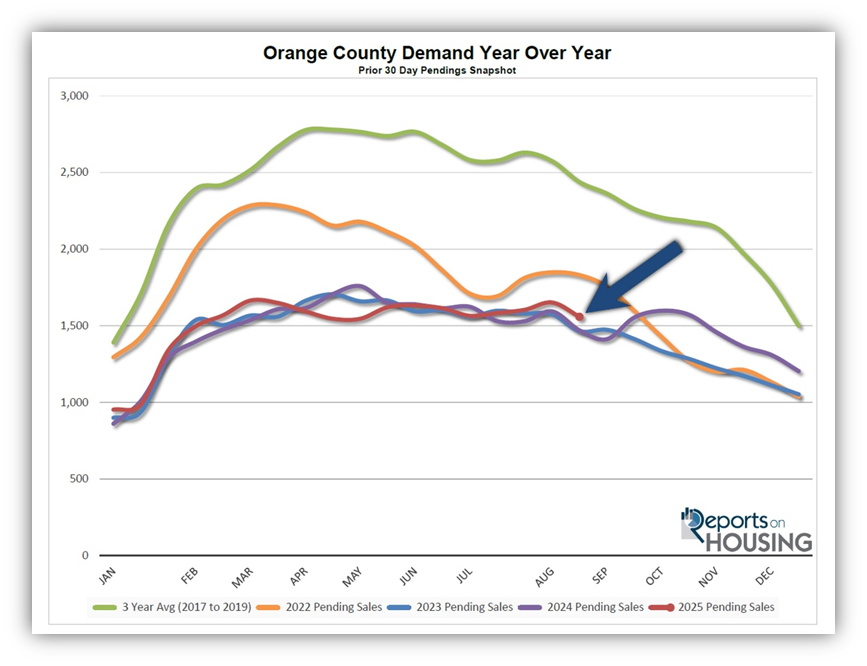
Last year, demand was 1,470, with 89 fewer pending sales, or 6% less. The 3-year average before COVID (2017-2019) was 2,438 pending sales, 56% higher than today, representing an additional 879 pending sales.
As the Federal Reserve has indicated, watching all economic releases for signs of slowing is essential. That is the only path to lower mortgage rates at this time. These releases can cause mortgage rates to move higher or lower, depending on how they compare to market expectations. This week is jobs week, which includes the number of job openings, wages, and the number of jobs created or lost, one of the month’s most important economic data points. Next week, the Producer Price Index (PPI) and the Consumer Price Index (CPI) will be released, two key indicators of inflation. It will be a pivotal two weeks for mortgage rates.
Expected Market Time
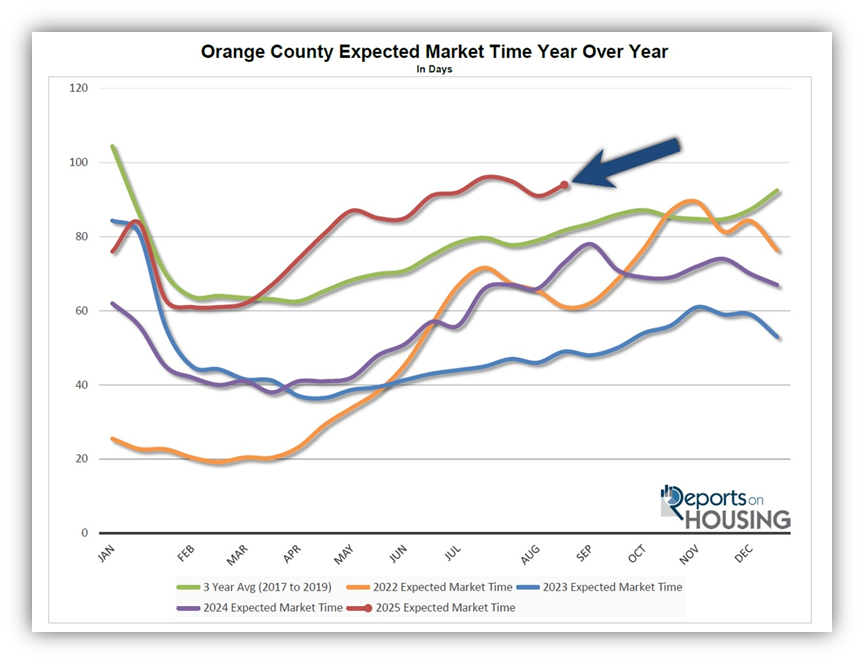
The Expected Market Time has slowed by three days over the past couple of weeks.
With the supply of available homes falling by only 142 homes, down 3%, and demand falling by 93 pending sales, down 6%, the Expected Market Time (the number of days it takes to sell all Orange County listings at the current buying pace) increased from 91 to 94 days in the past couple of weeks. 94 days is the highest end-of-August reading since 2018.
Last year, it was 73 days, substantially faster than today. The 3-year average before COVID was 82 days, which is also quicker than today.
The Expected Market Time for condominiums and townhomes increased from 85 to 91 days in the past two weeks. It was at 62 days last year. For detached homes, the Expected Market Time remained unchanged at 95 days. It was 81 days a year ago.
Luxury End
The luxury market slowed substantially over the past couple of weeks.
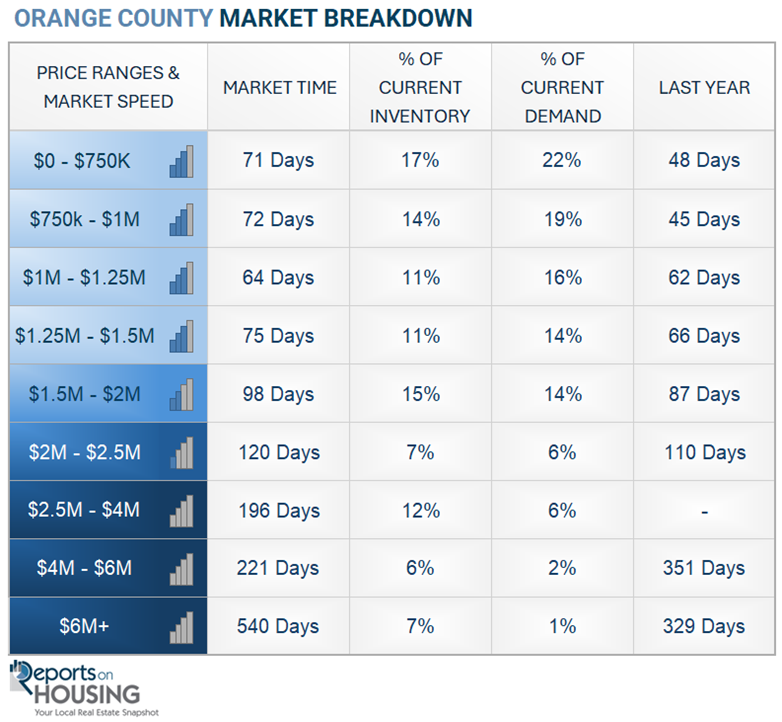
The luxury inventory of homes priced above $2.5 million (the top 10% of the Orange County housing market) decreased from 1,191 to 1,189 homes, a decline of two homes, nearly unchanged. Luxury demand decreased by 25 pending sales, down 15%, and now stands at 144. The Expected Market Time for luxury homes priced above $2.5 million jumped from 211 to 248 days, its slowest level of the year. As the year wanes, the Luxury Market cools.
In the past two weeks, the Expected Market Time for homes priced between $2.5 million and $4 million increased from 180 to 196 days. For homes priced between $4 million and $6 million, the Expected Market Time increased from 202 to 221 days. For homes priced above $6 million, the Expected Market Time increased from 321 to 540 days. Luxury is at 248 days overall. At this pace, a seller would be looking at becoming a pending sale around May 2026.
Orange County Housing Summary
- INVENTORY: The active listing inventory in the past couple of weeks decreased by 142 homes, down 3%, and now stands at 4,869, its largest drop of the year. Orange County reached its peak a month ago, marking its first normal July-to-August peak since 2022. Last year, there were 3,599 homes on the market, 1,270 fewer homes, or 26% less. The 3-year average before COVID (2017-2019) was 6,569, which is 35% higher. From January through August, 26% fewer homes came on the market compared to the 3-year average before COVID (2017-2019), 7,561 less. Yet, 2,281 more sellers came on the market this year than last, and 5,053 more compared to 2023.
- DEMAND: Buyer demand, the number of pending sales over the prior month, decreased by 93 homes, down 6%, and now stands at 1,559, its largest drop of the year. Last year, there were 1,470 pending sales, 6% lower than today. The 3-year average before COVID (2017-2019) was 2,438, which is 56% higher.
- MARKET TIME: With demand falling faster than supply, the Expected Market Time, the number of days to sell all Orange County listings at the current buying pace, increased from 91 to 94 days in the past couple of weeks, its highest end-of-August level since 2018. Last year, it was 73 days, substantially faster than today. The 3-year average before COVID (2017-2019) was 82 days, which is also faster than today.
- LUXURY: In the past two weeks, the Expected Market Time for homes priced between $2.5 million and $4 million increased from 180 to 196 days. For homes priced between $4 million and $6 million, the Expected Market Time increased from 202 to 221 days. For homes priced above $6 million, the Expected Market Time increased from 321 to 540 days.
- DISTRESSED HOMES: Short sales and foreclosures combined, comprised only 0.1% of all listings and 0.3% of demand. Only four foreclosures and three short sales are available today in Orange County, with a total of seven distressed homes on the active market, unchanged from two weeks ago. Last year, nine distressed homes were on the market, similar to today.
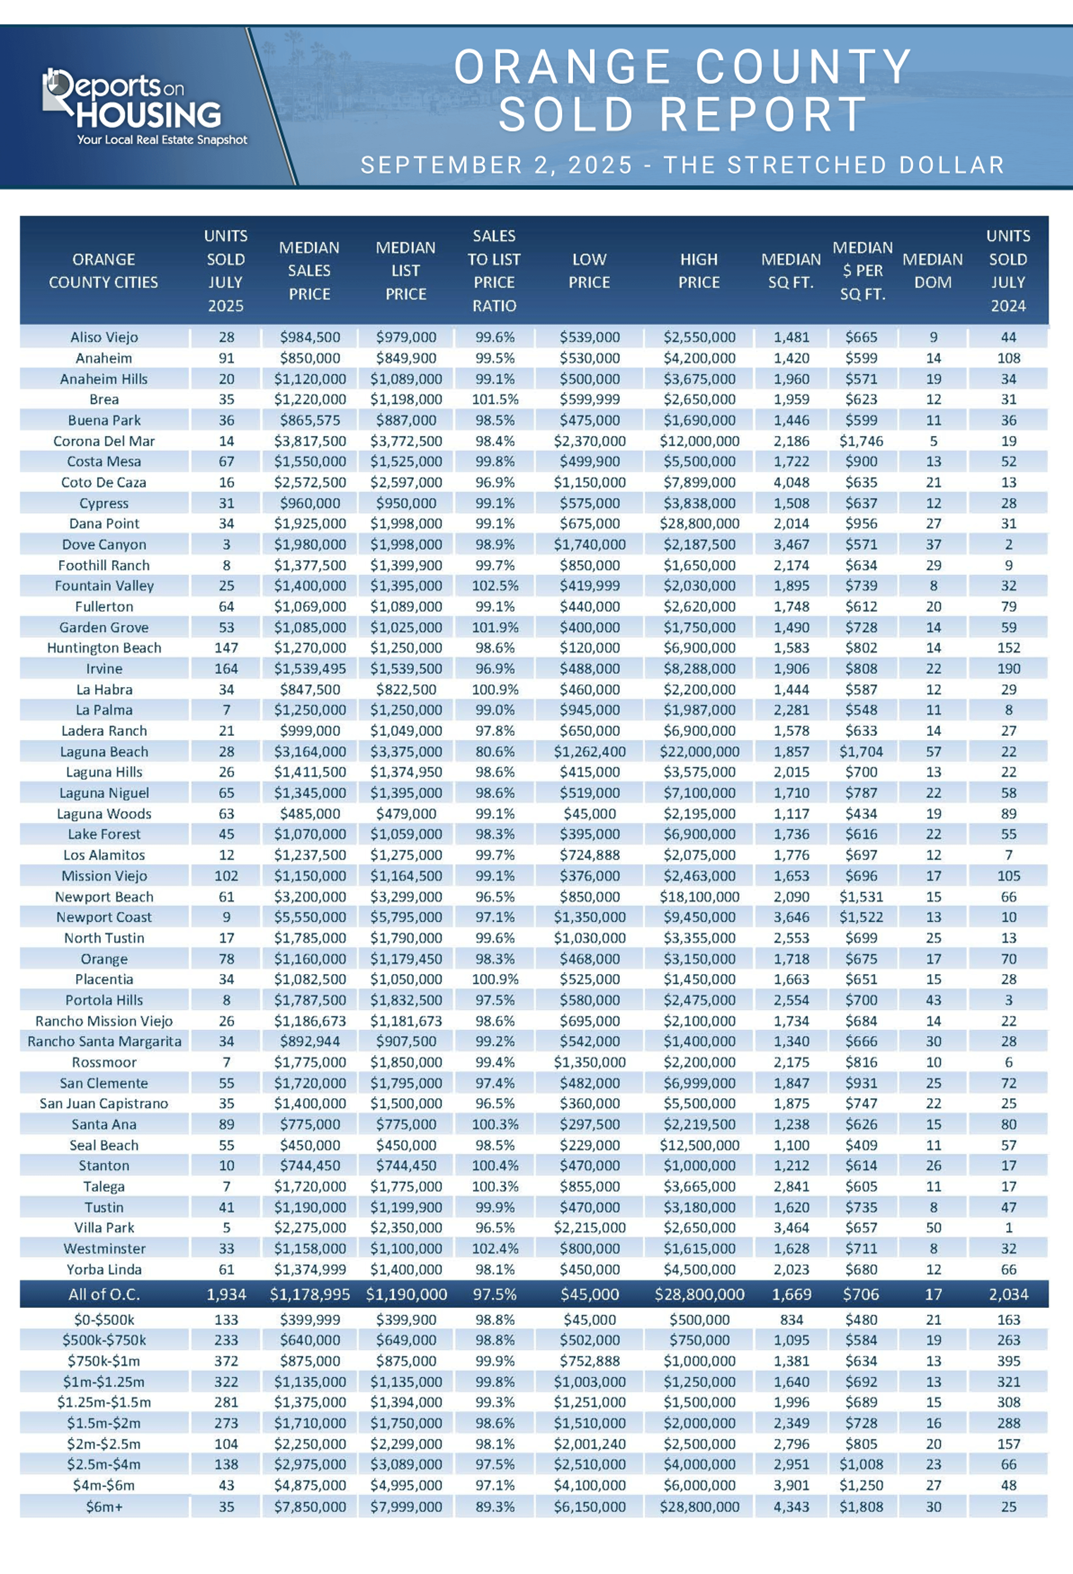
- CLOSED SALES: There were 1,934 closed residential resales in July, down 5% compared to July 2024’s 2,034 and up 5% from June 2025. The sales-to-list price ratio was 97.5% for Orange County. Foreclosures accounted for 0.05% of all closed sales, and short sales accounted for 0.05%. That means that 99.9% of all sales were sellers with equity.
Have a great week.
Sincerely,
Steven Thomas
Quantitative Economics and Decision Sciences
Copyright 2025—Steven Thomas, Reports On Housing—All Rights Reserved. This report may not be reproduced in whole or in part without express written permission from the author.