August 4, 2025
There are three indicators to look for in determining when home prices will drop sharply, but only one of them is currently present.
Three Indicators
The supply of available homes, current buyer demand, and th enumber of distressed homes will collectively signal the next plunge in home values.
Many people argue that housing is due for a correction. Their rationale is that home prices surged at an unprecedented rate from 2020 through the first half of 2022. When mortgage rates jumped from 3.25% in January 2022 to 7.37% nine months later in October, home affordability plummeted to historically low levels. Affordability is based on household incomes, mortgage rates, and home values. Since household incomes have not skyrocketed, and mortgage rates have bounced around 7% for nearly three years, the natural conclusion is that prices must plunge to improve affordability. Many have exclaimed that they feel it in their “gut,” that it is not a matter of if prices correct, it is when.
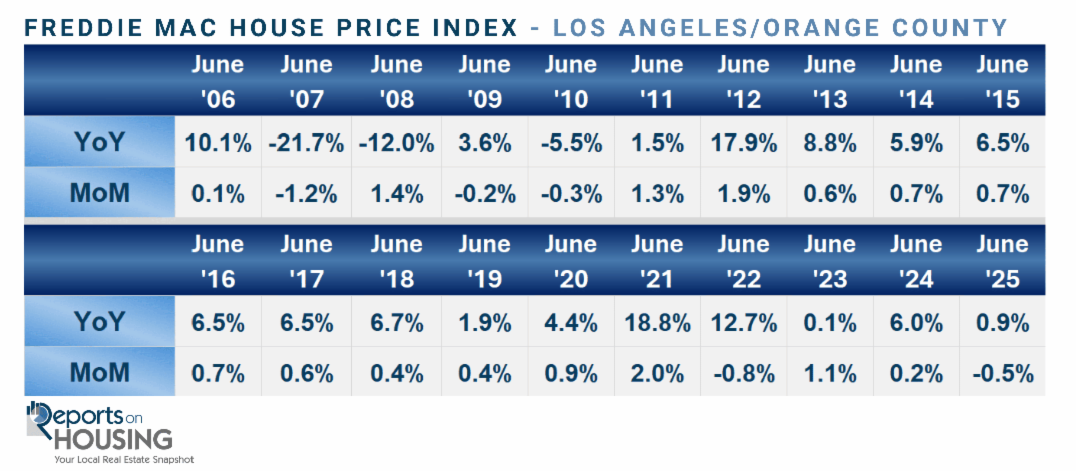
Yet, economics does not adhere to intuition or a “gut” reading. Instead, it is best to turn to the facts, data, and current trendlines. There are three key indicators to watch for to determine when home prices will plunge: a glut of homes available for purchase, an elevated number of distressed homes, including both foreclosures and short sales, and weak demand. All three need to be present to instigate a price correction. That is precisely what occurred leading up to and during the Great Recession. According to the Freddie Mac House Price Index, the Los Angeles/Orange County metro area experienced a substantial year-over-year drop in June 2007, 2008, and 2010.
Where is Orange County today in terms of the three factors: supply, demand, and distressed? Let the data reveal where the market is headed and allow it to set accurate market expectations.
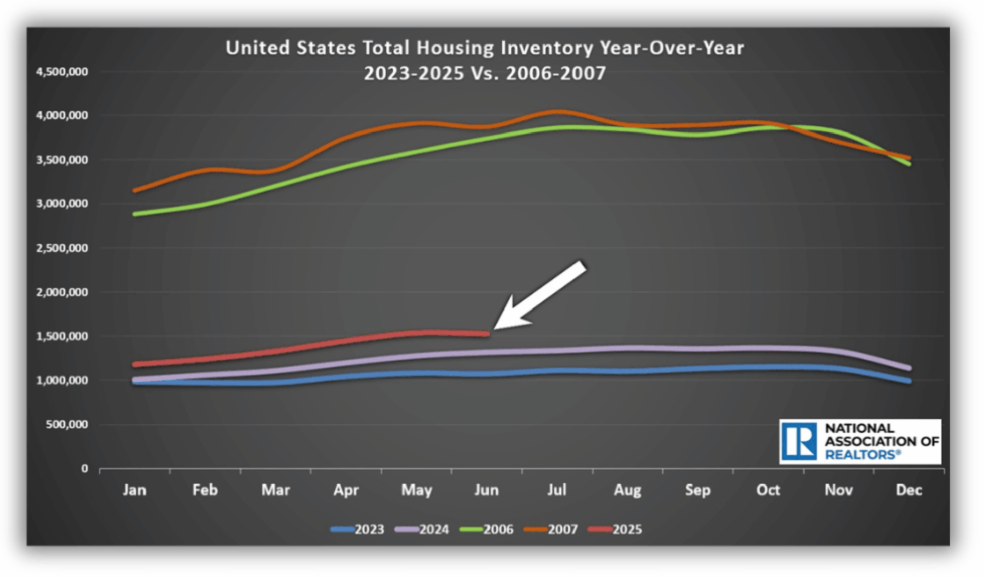
1. Supply of Available Homes: Despite many more sellers competing against each other, supply is still constrained compared to where it was leading up to and during the Great Recession. According to the National Association of REALTORS®, the national inventory today stands at 1,530,000 homes. In June 2006, there were 3,740,000, or 144% more, and in June 2007, there were 3,870,000, more than two and a half times today’s level. In July 2007, it eclipsed 4,000,000 homes. While the inventory may have grown over the past couple of years, it has remained at low levels compared to the glut of homes available leading up to and during the Great Recession.
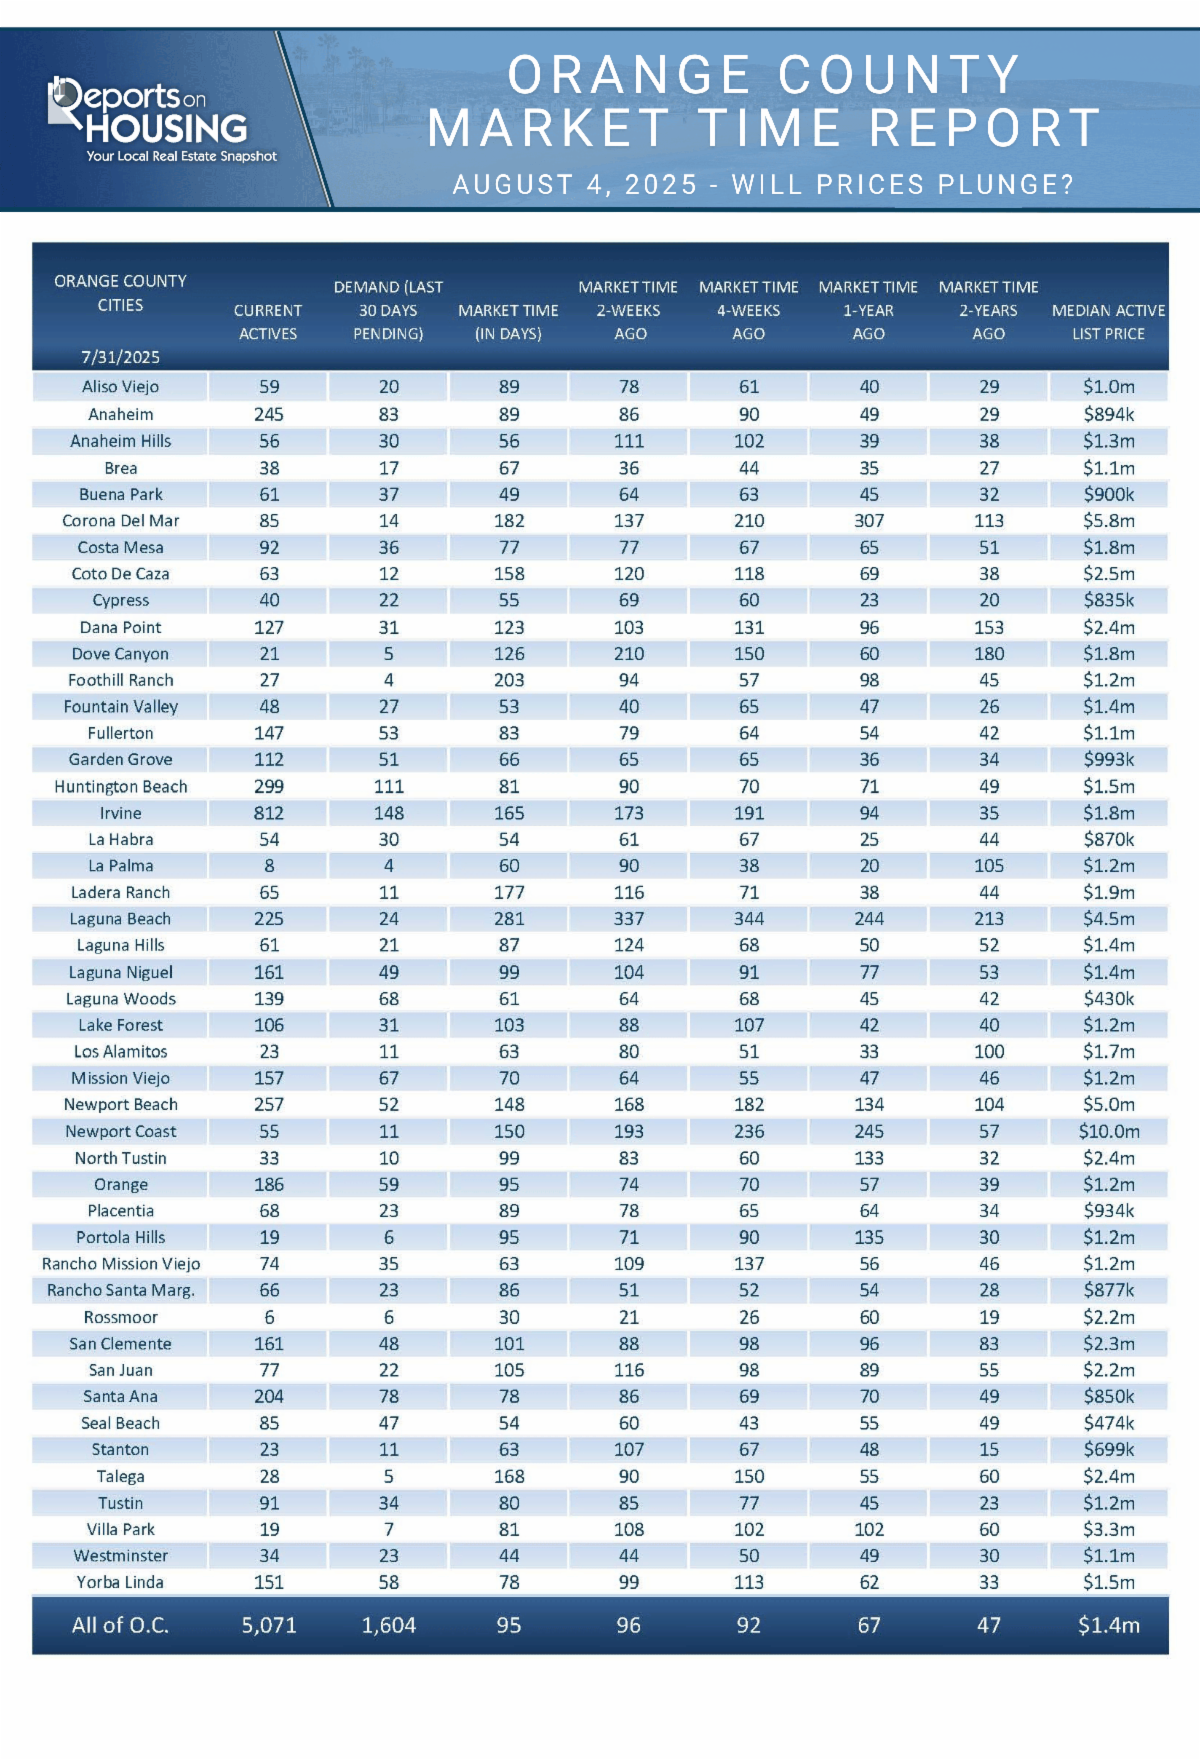
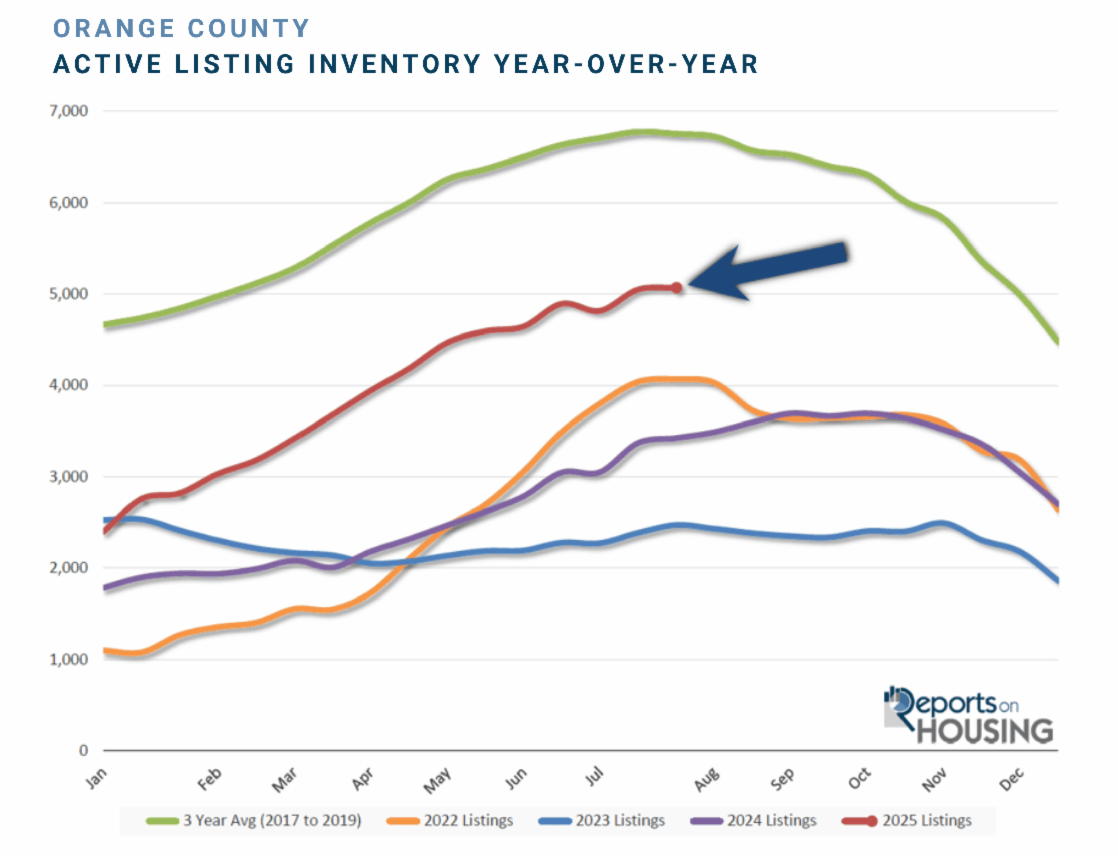
In Orange County, there are currently 5,071 homes available for sale. Yet, at the end of July 2006, it reached 15,735, or 210% higher. In 2007, it climbed to 17,596, or 247% higher, more than triple. Today’s inventory is 48% higher than last year’s 3,426, and 105% higher than 2023’s 2,475 homes.
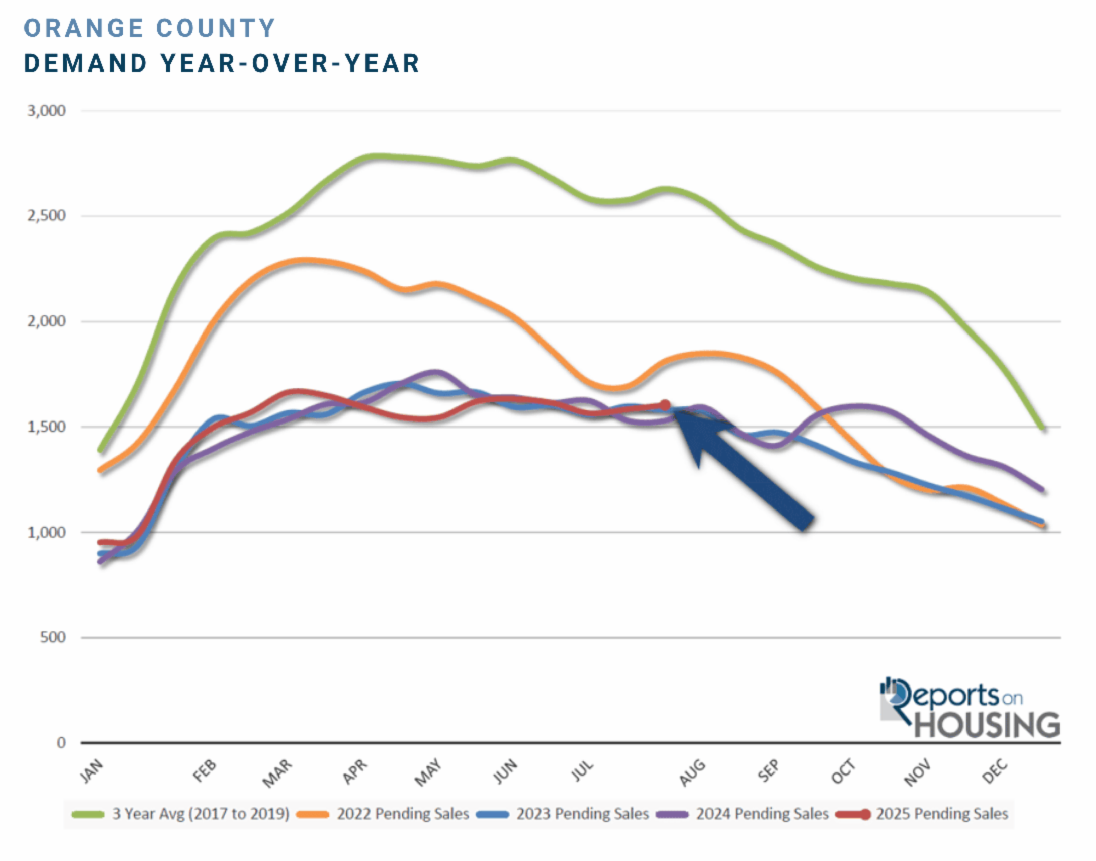
2. Buyer Demand: Mortgage rates have been stuck above 6% for three years, and buyer demand has been muted ever since. Demand had remained high from the second half of 2020, during the pandemic, through May 2022. The favorable mortgage rate environment fueled remarkable demand. That came to an abrupt end in 2022 when the Federal Reserve embarked on an unprecedented rate-hiking cycle. As mortgage rates soared, demand and closed sales activity plummeted. Demand will remain subdued as long as rates remain elevated, hovering around 7%.
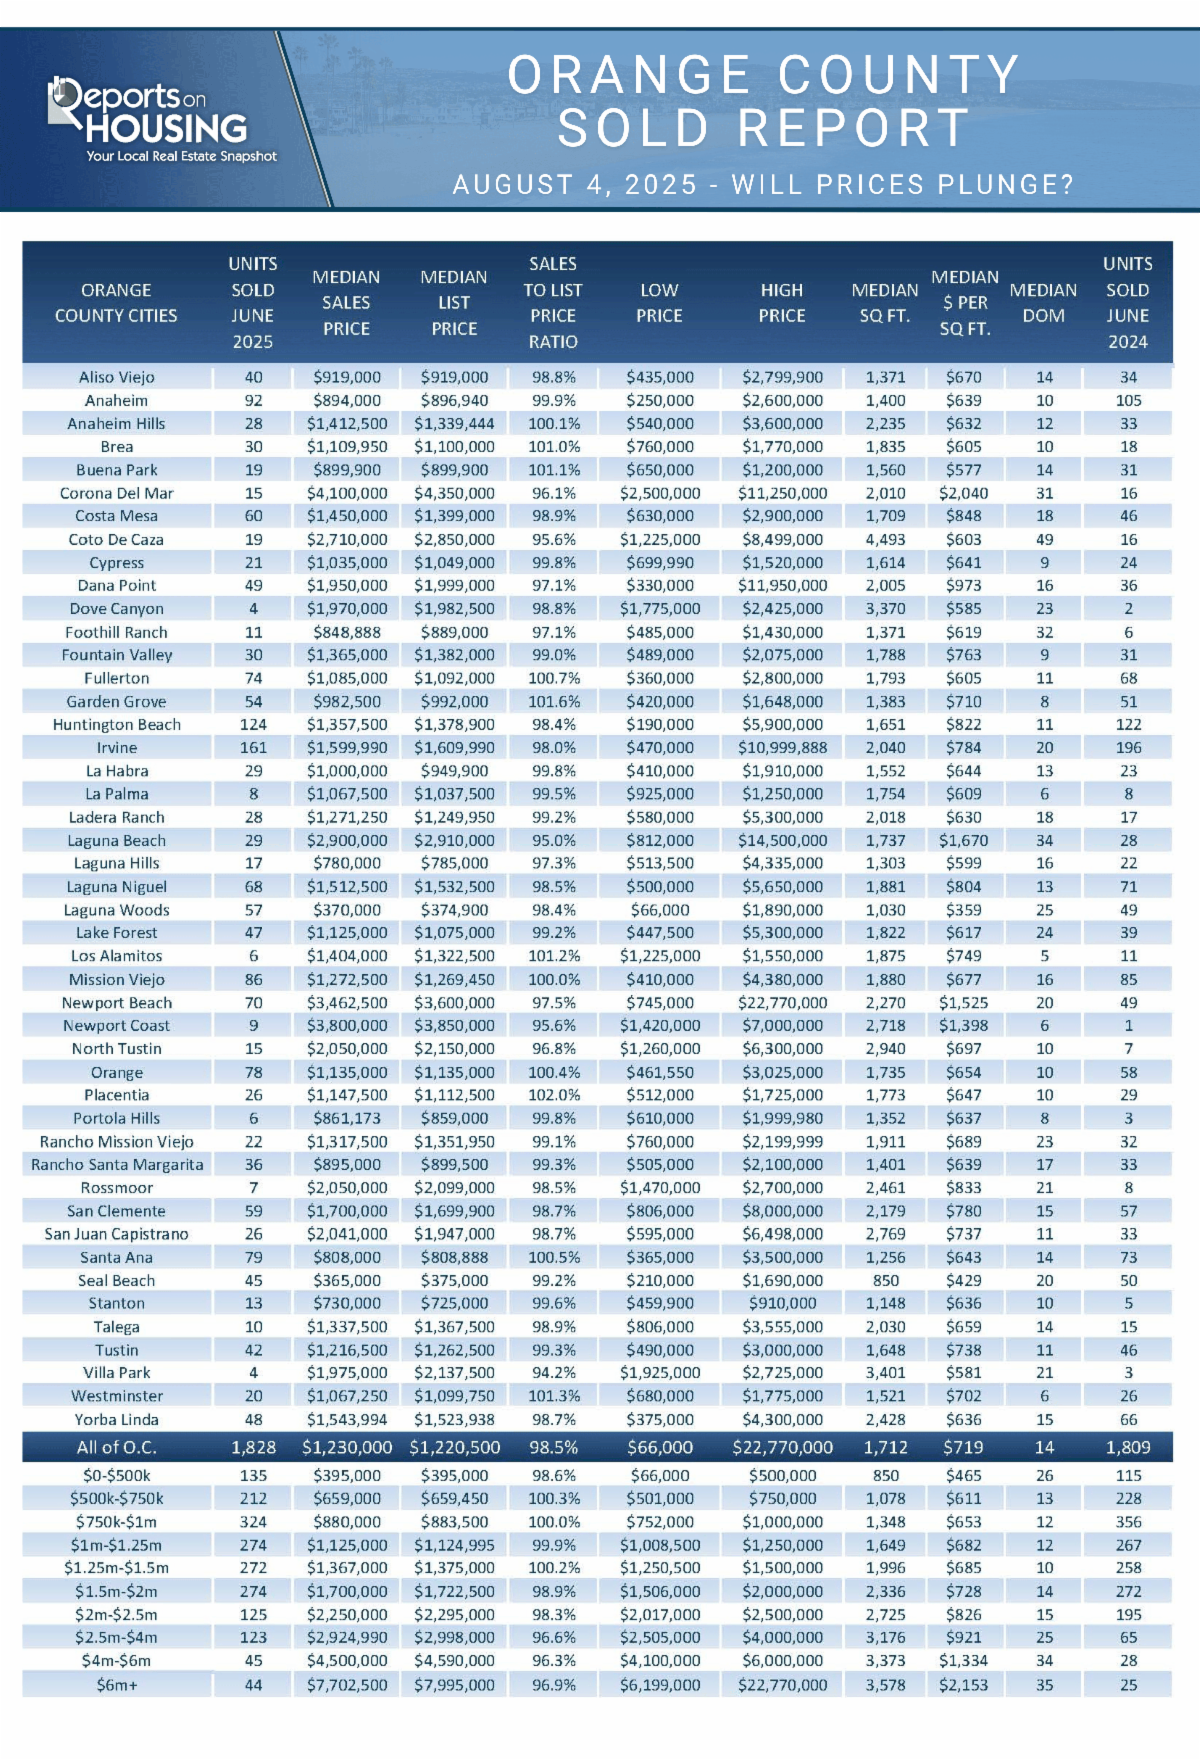
Current demand (a snapshot of the number of new pending sales over the prior month) is at 1,604 pending sales, 5% higher than last year’s 1,530, and 2% higher than 2023’s 1,580. The 3-year average before the pandemic (2017–2019) was 2,630 pending sales, a mind-boggling 64% higher than today. Through June, there were 10,048 closed sales in 2025, representing a 31% decrease from the 3-year pre-COVID average of 14,627 sales. Yes, Orange County is currently experiencing extremely weak demand.
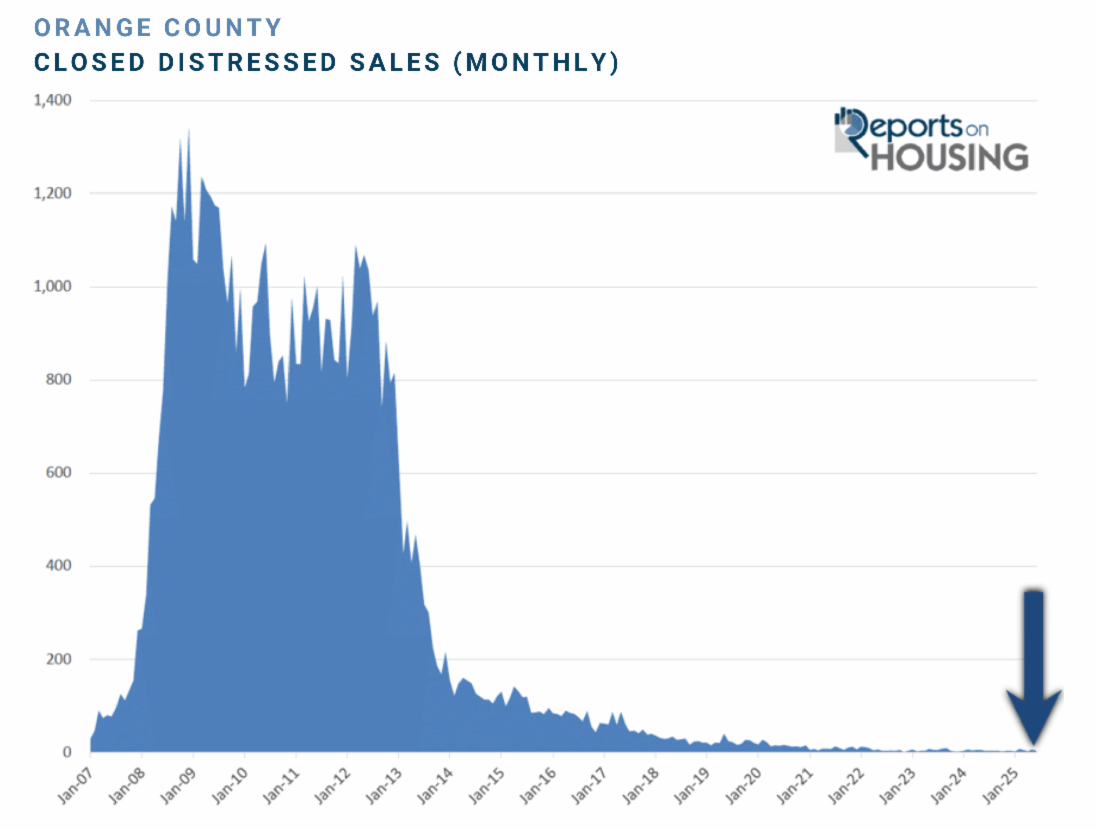
3. Distressed Homes: There have been very few distressed home sales for years now, and it is not going to change anytime soon. In June, there was only one foreclosure sale and one short sale out of the 1,828 total closed sales. That is 0.11% of all closed sales. Compare that to 4% in June 2007, 33% in 2008, 43% in 2009, and 38% in 2010.
Distressed properties are still below pre-pandemic levels. According to the ICE McDash loan-level database, the national delinquency rate for first-lien mortgages is currently at 3.2%, below the pre-pandemic average of 3.5% (2018–2019) and far below the 4.13% average from 2000 to 2005. The housing stock is the healthiest in U.S. history, thanks to tight lending standards that date back to 2010, when borrowers qualified with strong credit, great jobs, large down payments, and low mortgage rates. Homeowners are sitting on tremendous, record-high equity, and 40% own their homes free and clear.
When distressed homes are present, banks need to unload these nonperforming assets so that they can utilize the capital once again. They lack emotion when it comes to selling these assets. They “have to sell,” meaning they will do whatever it takes to secure a sale. That is vastly different than today. There are very few sellers who truly “have to sell.” Instead, the inventory is built on a collection of homeowners who are “willing to sell.” This is where their kids learn to ride a bike. They are not just selling a house; they are selling their “home.” This creates a real stickiness to pricing.
The Bottom Line: Only one of the three indicators for prices to plunge is present in today’s housing market, muted demand. There must be considerable additional pressure for prices to fall substantially, not just low demand. A glut of available homes, along with unemotional distressed sellers who “have to sell,” and weak demand are the necessary ingredients for housing to experience a correction. Prices will not plunge solely due to weak demand.
ACTIVE LISTINGS
THE INVENTORY REMAINED NEARLY UNCHANGED IN THE PAST COUPLE OF WEEKS.
The active listing inventory increased by only 21 homes over the past two weeks, almost unchanged, and now stands at 5,071, still its highest level since November 2019. It will be interesting to see if the Orange County housing market reaches its typical peak between July and August. It appears that it may be reaching a peak right now. Only time will tell. Prices have started to fall slightly from month to month in Orange County. It is simply a matter of supply and demand. While demand has remained relatively unchanged over the past couple of years, at similar muted levels, there are more competing listings this year than in recent years. Examining the supply and demand scale, the additional supply has tilted the scale marginally in favor of buyers.
Last year, the inventory was at 3,416 homes, 32% lower, or 1,645 fewer. The 3-year average before COVID (2017–2019) was 6,753, an additional 1,682 homes, or 33% more.
Homeowners continue to “hunker down” in their homes, unwilling to move due to their current underlying, locked-in, low fixed-rate mortgage. This trend has been easing from the lows established in 2023. Through July, 19,477 homes were placed on the market in Orange County, 6,370 fewer than the 3-year average before COVID (2017-2019), 25% less. In 2024, only 17,052 homes entered the market, and in 2023, it was only 14,616. More sellers are opting to sell in 2025.
DEMAND
DEMAND INCREASED BY 20 PENDING SALES IN THE PAST COUPLE OF WEEKS.
Demand, a snapshot of the number of new pending sales over the prior month, increased from 1,584 to 1,604 in the past couple of weeks, representing a 20-pending-sale rise, or 1%. Last Friday, August 1st, was Jobs Friday, one of the most important economic reports each month. The report was extremely weak, prompting investors to pivot from stocks to longer-duration investments. As a result, mortgage rates dropped considerably. According to Mortgage News Daily, 30-year mortgage rates declined from 6.75% on July 31st to 6.57% today, the lowest rate since October 4th. If the economy continues to show evidence of an economic slowdown, rates will fall further. If rates drop below 6.5% with duration, expect demand to improve noticeably. As mortgage rates fall, demand will improve. Examining the supply and demand scale, the increased demand will offset the additional seller competition and could shift pricing back in favor of sellers. It will be imperative to continue closely monitoring all economic data releases moving forward to determine the market’s direction.
Last year, demand was 1,530, with 74 fewer pending sales, or 5% less. The 3-year average before COVID (2017–2019) was 2,630 pending sales, 64% higher than today, representing an additional 1,026 pending sales.
As the Federal Reserve has indicated, watching all economic releases for signs of slowing is essential. That is the only path to lower mortgage rates at this time. These releases can cause mortgage rates to move higher or lower, depending on how they compare to market expectations. Next week, the Producer Price Index (PPI) and the Consumer Price Index (CPI) will be released, two key indicators of inflation. Finally, next Thursday, Retail Sales will be released. It will be a pivotal week for mortgage rates.
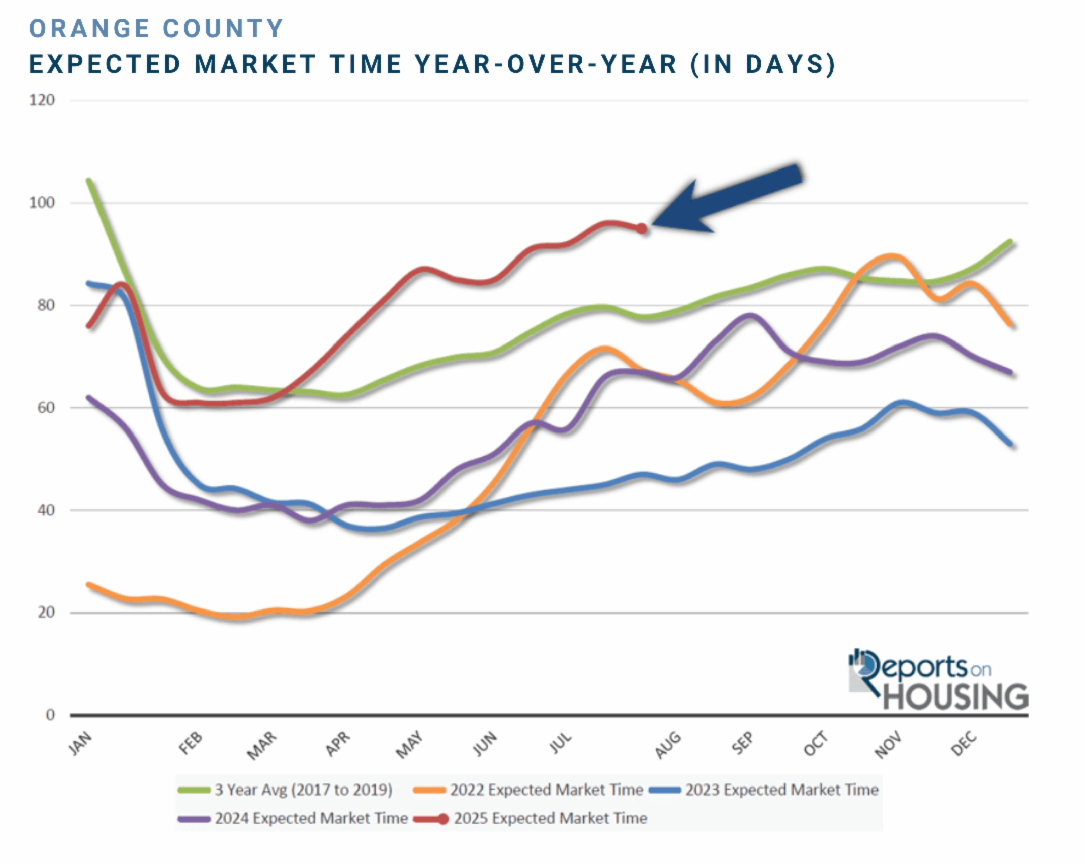
EXPECTED MARKET TIME
THE EXPECTED MARKET TIME IMPROVED BY ONE DAY OVER THE PAST COUPLE OF WEEKS.
With the supply of available homes rising by only 21 homes, nearly unchanged, and demand rising by only 20 pending sales, up 1%, the Expected Market Time (the number of days it takes to sell all Orange County listings at the current buying pace) decreased from 96 to 95 days in the past couple of weeks, still a very high July level.
Last year, it was 67 days, substantially faster than today. The 3-year average before COVID was 78 days, which is also much quicker than today.
The Expected Market Time for condominiums and townhomes decreased from 94 to 90 days in the past two weeks. It was at 56 days last year. For detached homes, the Expected Market Time increased from 97 to 98 days. It was 75 days a year ago.
LUXURY END
THE LUXURY MARKET IMPROVED OVER THE PAST COUPLE OF WEEKS.
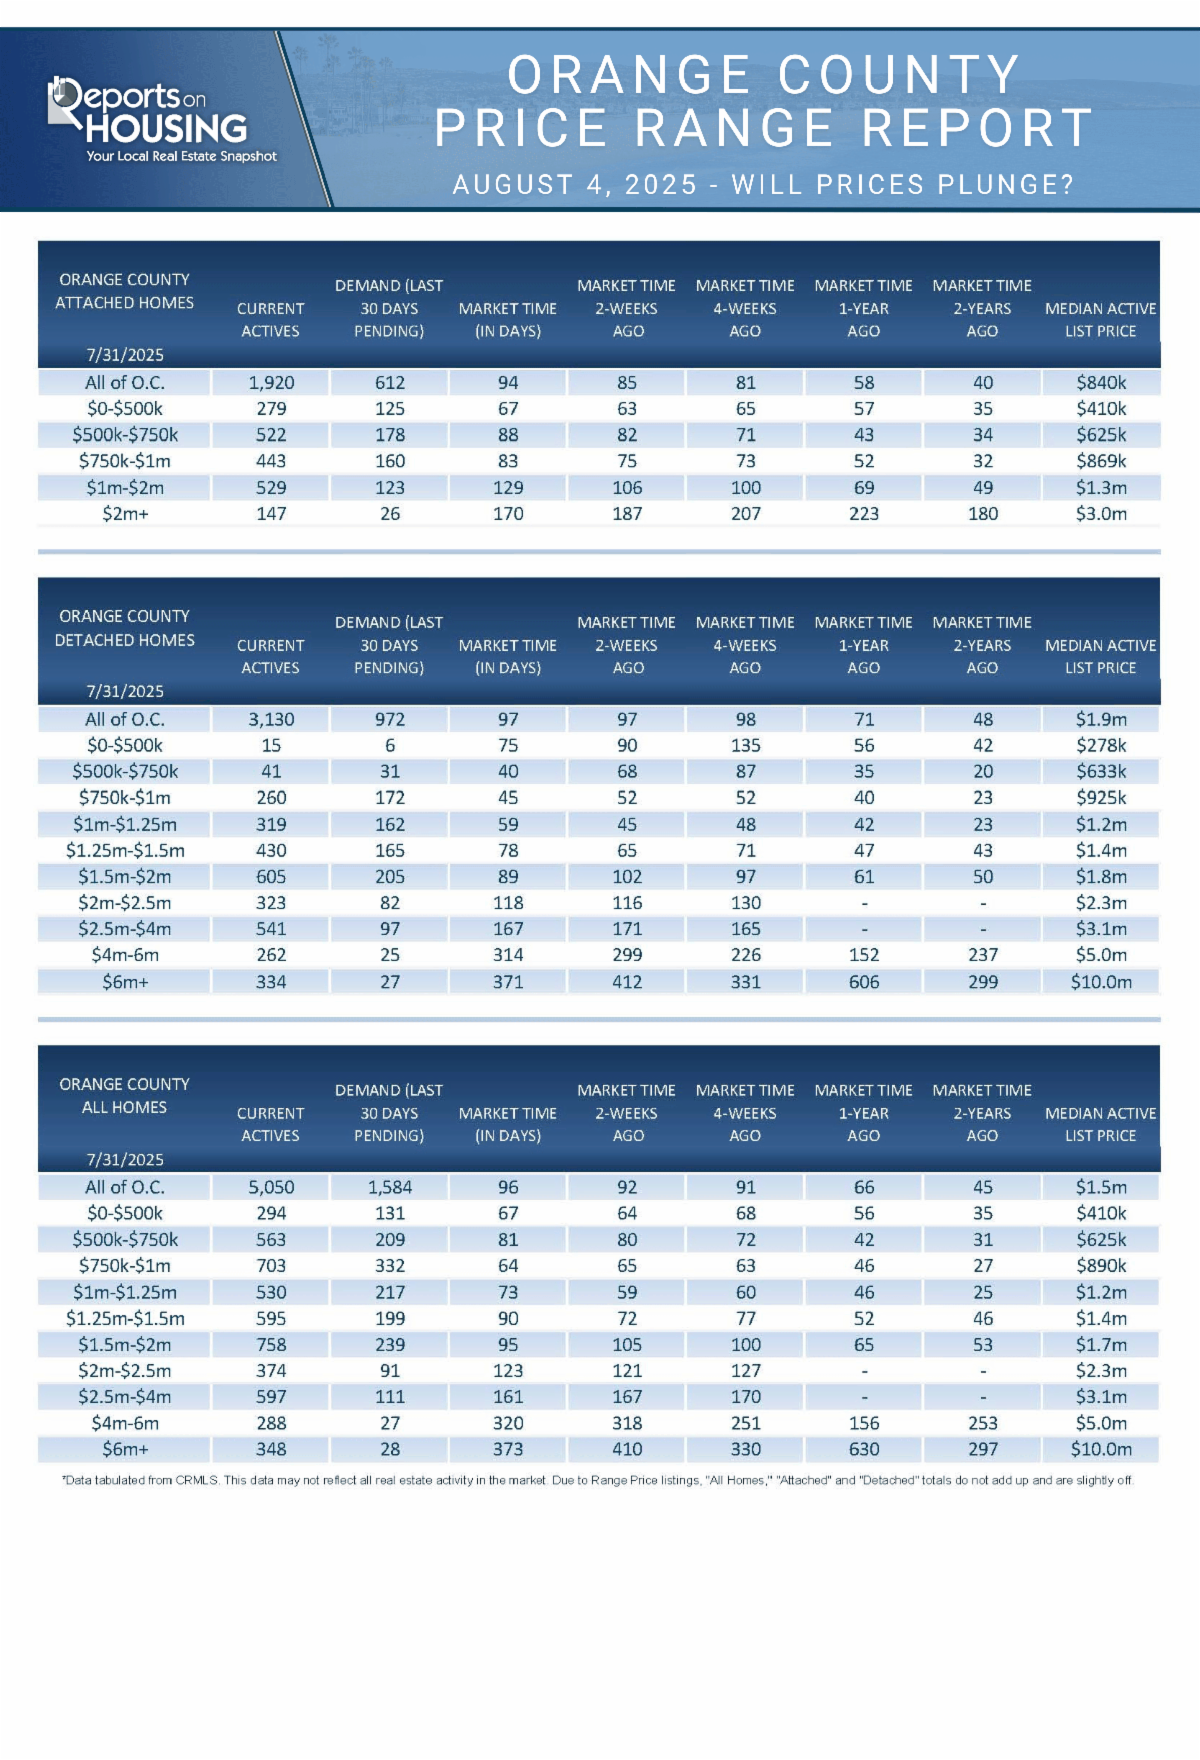
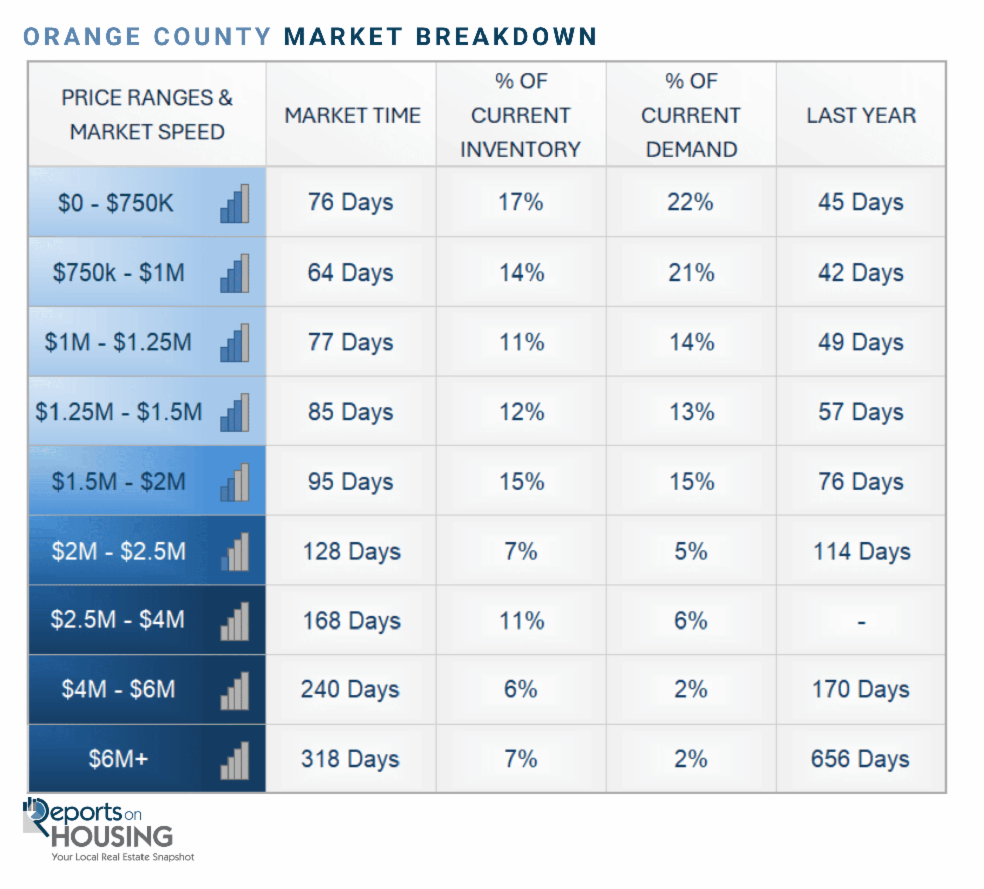
The luxury inventory of homes priced above $2.5 million (the top 10% of the Orange County housing market) decreased from 1,233 to 1,201 homes, a drop of 32 homes, or down 3%. Luxury demand increased by five pending sales, up 3%, and now sits at 171. The Expected Market Time for luxury homes priced above $2.5 million decreased from 223 to 211 days, its strongest level since the start of June. With Wall Street continuing to outperform expectations, the luxury market continues to improve.
In the past two weeks, the Expected Market Time for homes priced between $2.5 million and $4 million increased from 161 to 168 days. For homes priced between $4 million and $6 million, the Expected Market Time decreased from 320 to 240 days. For homes priced above $6 million, the Expected Market Time decreased from 373 to 318 days. Luxury is at 211 days overall. At this pace, a seller would be looking at becoming a pending sale around March 2026.
- INVENTORY: The active listing inventory in the past couple of weeks increased by 21 homes, nearly unchanged, and now sits at 5,071, still its highest level since November 2019. Last year, there were 3,426 homes on the market, 1,645 fewer homes, or 32% less. The 3-year average before COVID (2017–2019) was 6,753, which is 33% higher. From January through July, 25% fewer homes came on the market compared to the 3-year average before COVID (2017–2019), 6,370 less. Yet, 2,425 more sellers came on the market this year than last, and 4,861 more compared to 2023.
- DEMAND: Buyer demand, the number of pending sales over the prior month, increased from 1,584 to 1,604. Last year, there were 1,530 pending sales, 5% lower than today. The 3-year average before COVID (2017–2019) was 2,630, which is 64% higher.
- MARKET TIME: With supply rising slower than demand, the Expected Market Time, the number of days to sell all Orange County listings at the current buying pace, decreased slightly from 96 to 95 days in the past couple of weeks, still a high level for July. Last year, it was 67 days, substantially faster than today. The 3-year average before COVID (2017–2019) was 78 days, which is also significantly faster than today.
- LUXURY: In the past two weeks, the Expected Market Time for homes priced between $2.5 million and $4 million increased from 161 to 168 days. For homes priced between $4 million and $6 million, the Expected Market Time decreased from 320 to 240 days. For homes priced above $6 million, the Expected Market Time decreased from 373 to 318 days.
- DISTRESSED HOMES: Short sales and foreclosures combined, comprised only 0.2% of all listings and 0.2% of demand. Only six foreclosures and five short sales are available today in Orange County, with a total of 11 distressed homes on the active market, up five from two weeks ago. Last year, nine distressed homes were on the market, similar to today.
- CLOSED SALES: There were 1,828 closed residential resales in June, up 1% compared to June 2024’s 1,809 and nearly unchanged from May 2025. The sales-to-list price ratio was 98.5% for Orange County. Foreclosures accounted for 0.05% of all closed sales, and short sales accounted for 0.05%. That means that 99.9% of all sales were sellers with equity.