July 21, 2025
It is the slowest Orange County housing market in years, and more and more sellers are sitting for a very long time without success.
A Sluggish Market
With an Expected Market Time of 96 days for all of Orange County, sellers need to pack their patience.
Anyone who has fished for years can attest that there are seasons when the fishing is great and the bucket is filled with fish. Yet, there are also seasons when nothing is biting, and very few fish, if any, are reeled in and thrown in the bucket. Second-guessing the strategy is a big part of fishing. Is there a better bait? Maybe a different spot would be more advantageous? Perhaps it is the wrong time of the season to have a pole in the water. In fishing, success boils down to the right bait, the right spot, the right timing, and plenty of patience.
Today’s sellers are finding out the hard way that the “fishing is not great.” They are quickly realizing that selling a home in today’s market is not a quick and instantaneous process. Instead, it requires plenty of patience and persistence. There is a limited number of buyers in the marketplace due to affordability constraints. Yet, seller competition is at its highest level in years: there are plenty of other poles in the water.
With the increased competition, sellers have had to exercise considerable patience. Sellers who overprice their homes sit on the market without success. It is not a market to pad the asking price to leave room for negotiations. Price, condition, location, upgrades, and amenities all factor into the difference between success and languishing on the market.
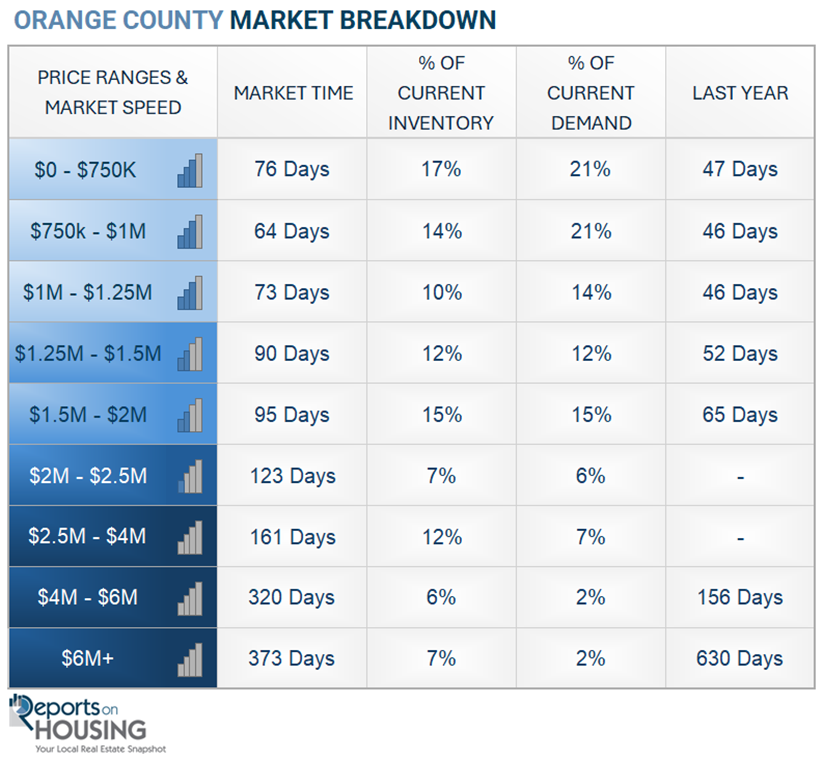
An unbelievable 35% of all homes on the active listing inventory have been exposed to the market for more than 60 days. That is high considering 35% of the active listing market has come on within the last 30 days. Unsurprisingly, the luxury
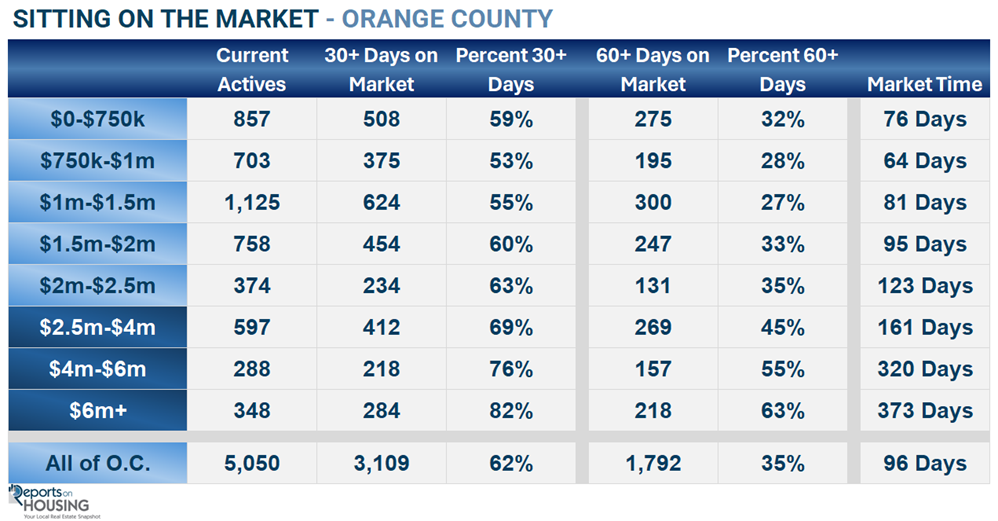
ranges take the longest to sell and have been waiting the longest to find success. Yet, many sellers in the most affordable ranges are sitting on the market waiting for a buyer to bring in an offer. Below $750,000, 32% of the market has had to wait 60 days or more without success. Between $750,000 and $1.5 million, the hottest price ranges, 27% to 28% have been waiting at least two months. It is a third of all sellers between $1.5 million and $2 million. From there, the share of sellers who have been waiting to secure an agreed-upon offer grows between 35% to 63%, nearly two-thirds.
The storyline for 2025 is that there are far more sellers this year compared to the last several years, yet year-over-year demand has been almost unchanged. Currently, the supply of available homes has climbed to 5,050, up 50% compared to last year and 111% higher than in 2023. Demand, on the other hand, is 3% higher than last year and 1% lower than in 2023. As a result of increased supply and nearly unchanged demand, the Expected Market Time (the number of days it takes to sell all Orange County listings at the current buying pace) is at 96 days, its highest level for mid-July since 2011. It was at 66 days last year and 45 days two years ago.
Affordability has remained relatively unchanged, and so have demand levels. With so many sellers competing against each other, homes have been sitting on the market for much longer this year. The Spring Market and half of the Summer Market are in the rearview mirror. As the upcoming school year draws closer, the window of opportunity to take advantage of the summer season is closing. As a result, an increased number of sellers are throwing in the proverbial towel, pulling their homes off the market, and changing their real estate plans. Some may come on the market later this year. Others will wait until the spring. Many will ultimately wait until housing shifts back in favor of sellers down the road.
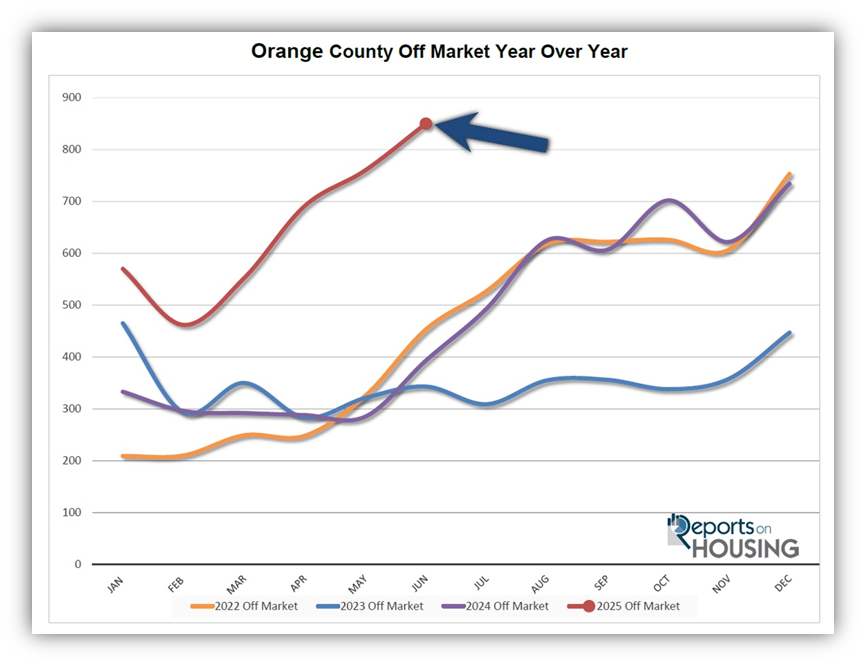
In June, 850 sellers threw in the towel, the most since December 2019. That is 17% of the total active inventory. From January through June, 3,885 sellers have pulled their homes off the market, which is up 106% compared to last year, over double. Cyclically, the number of homes that come off the market rises from month to month through the end of the year. Expect many more homes to be pulled from the active inventory going forward as housing transitions to its slower seasons.
As the best time of the year to sell, the Spring and Summer Markets, come to a close, careful, deliberate pricing is absolutely essential in securing success. There will be many more sellers this year who will be unable to isolate a buyer willing to bring in an offer to purchase. Contracts will expire. Thus, the number of homes pulled off the market will spike as the year progresses.
ATTENTION SELLERS: It is time to choose between pricing a home according to its Fair Market Value or throwing in the towel and pulling it off the market altogether. It may sound simple, but far too many sellers do not spend enough time arriving at an accurate asking price, carefully considering all recent comparable closed and pending sales. Sellers cannot get out of their own way, unwilling to listen to real estate experts and take the necessary steps to achieve their goals in selling.
ATTENTION BUYERS: Looking for a “deal” in today’s market is a waste of time. Very few sellers really have to sell and are willing to sacrifice substantially in price for a swift sale. There is a real stickiness to pricing. Today’s market is leaning in the buyer’s favor in terms of negotiations, yet prices are not plunging. Sellers are not desperate. Instead, similar to sellers, buyers will be able to successfully isolate and purchase a home by carefully arriving at a home’s Fair Market Value.
Active Listings
The inventory jumped by 5% over the past couple of weeks.
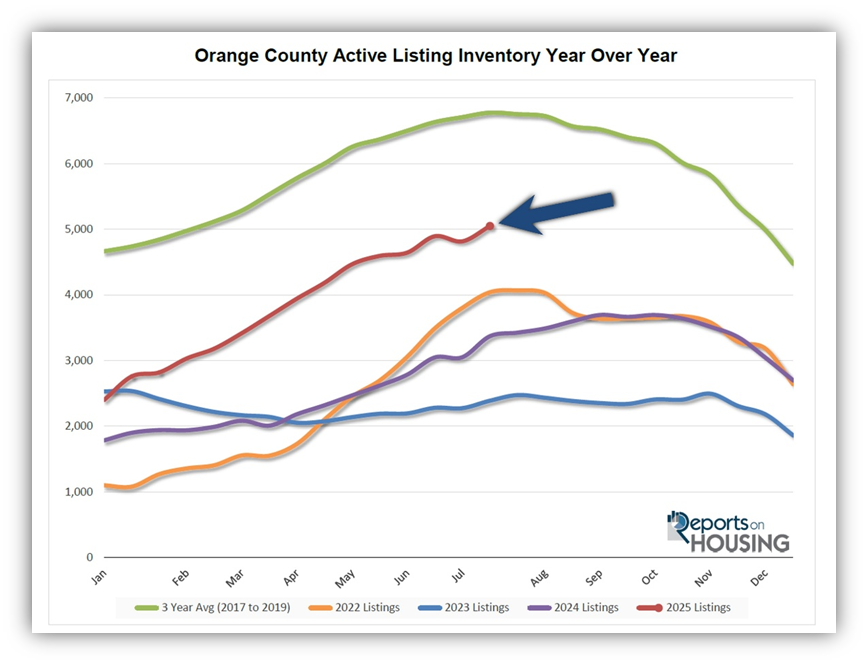
The active listing inventory increased by 233 homes over the past two weeks, representing a 5% rise, and now stands at 5,050, its highest level since November 2019. Orange County housing peaks typically occur between July and August. Then the inventory slowly falls and picks up steam, falling at a much faster pace starting in October and continuing through the year’s end. Yet, over the past several years, the peaks have been coming later in the year and then slowly falling, not dropping rapidly until the Holiday Market, from mid-November through year’s end. With mortgage rates not changing much and more sellers throwing in the towel and pulling their homes off the market this year, it will be interesting to see if an earlier peak is achieved and inventory levels drop more significantly than in recent years.
Last year, the inventory was at 3,371 homes, 33% lower, or 1,679 fewer. The 3-year average before COVID (2017-2019) was 6,776, an additional 1,726 homes, or 34% more.
Homeowners continue to “hunker down” in their homes, unwilling to move due to their current underlying, locked-in, low fixed-rate mortgage. This trend has been easing from the lows established in 2023. Through June, 16,578 homes were placed on the market in Orange County, 5,562 fewer than the 3-year average before COVID (2017-2019), 25% less. In 2024, only 14,386 homes entered the market, and in 2023, it was only 12,346. More sellers are opting to sell in 2025.
Demand
Demand increased by 19 pending sales in the past couple of weeks.
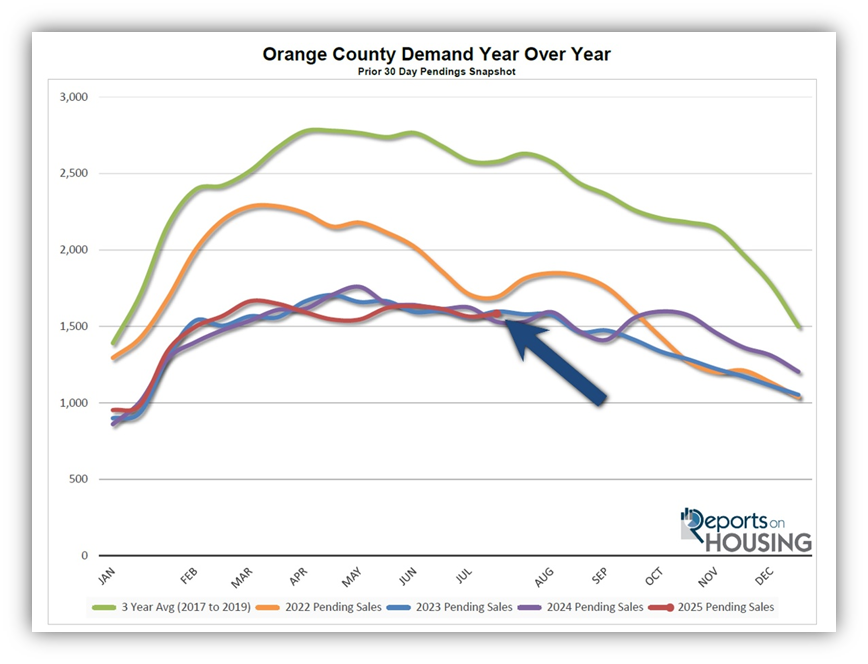
Demand, a snapshot of the number of new pending sales over the prior month, increased from 1,565 to 1,584 in the past couple of weeks, representing a 19-pending-sale rise, or 1%. As the Summer Market winds down, expect demand to continue to fall slowly through August. From there, it depends on what happens to mortgage rates. If rates continue to bounce between 6.75% to 7%, then demand will continue to fall through the Autumn Market slowly, and then drop at a faster pace during the holidays, from mid-November through New Year’s Eve. If rates drop below 6.5% and remain there for an extended period, demand levels will rise and could even surpass their March peak.
Last year, demand was 1,531, with 53 fewer pending sales, or 3% less. The 3-year average before COVID (2017-2019) was 2,578 pending sales, 63% higher than today, representing an additional 994 sales.
As the Federal Reserve has indicated, watching all economic releases for signs of slowing is essential. That is the only path to lower mortgage rates at this time. These releases can cause mortgage rates to move higher or lower, depending on how they compare to market expectations. This week marks the release of the S&P Global Manufacturing and Services Purchasing Managers Index (PMI), which tracks the strength of the U.S. manufacturing and services sectors. Next week, the Personal Consumption Expenditures – Price Index (PCE), the Fed’s preferred inflation gauge, will be released on Thursday. Next week is also jobs week, which includes the number of job openings, wages, and the number of jobs created or lost, one of the month’s most important economic data points.
Expected Market Time
The Expected Market Time jumped by four days over the past couple of weeks.
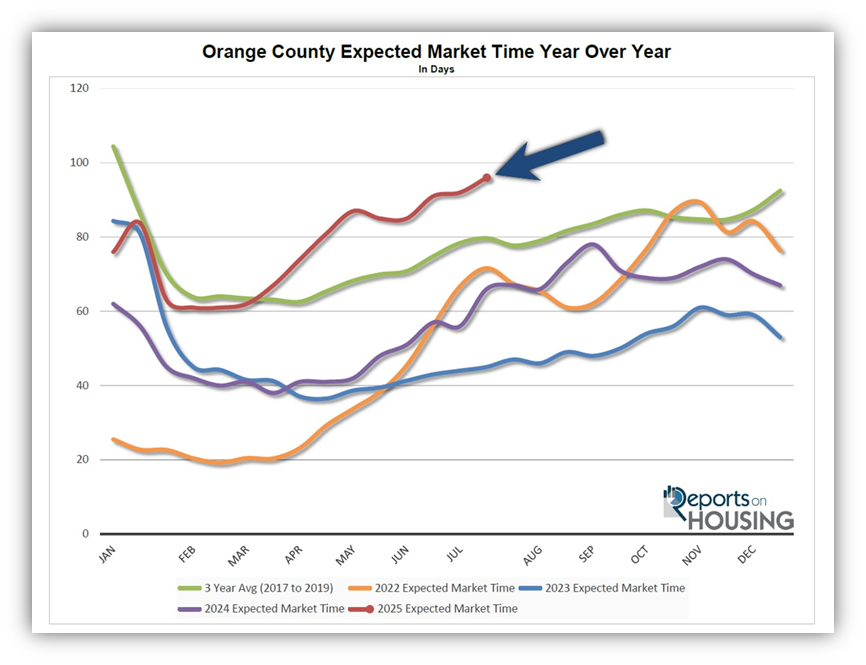
With the supply of available homes rising by 233 homes, up 5%, and demand rising by only 19 pending sales, up 1%, the Expected Market Time (the number of days it takes to sell all Orange County listings at the current buying pace) increased from 92 to 96 days in the past couple of weeks, its highest July level since 2011.
Last year, it was 66 days, substantially faster than today. The 3-year average before COVID was 80 days, which is also much quicker than today.
The Expected Market Time for condominiums and townhomes increased from 85 to 94 days in the past two weeks. It was at 58 days last year. For detached homes, the Expected Market Time remained unchanged at 97 days. It was 71 days a year ago.
Luxury End
The luxury market has remained relatively unchanged over the past couple of weeks.
The luxury inventory of homes priced above $2.5 million (the top 10% of the Orange County housing market) decreased from 1,235 to 1,233 homes, a drop of two homes, or nearly unchanged. Luxury demand increased by six pending sales, up 4%, and now sits at 166. The Expected Market Time for luxury homes priced above $2.5 million decreased from 232 to 223 days. Expect the luxury market to moderate and cool somewhat during the Summer Market.
In the past two weeks, the Expected Market Time for homes priced between $2.5 million and $4 million decreased from 167 to 161 days. For homes priced between $4 million and $6 million, the Expected Market Time increased from 318 to 320 days. For homes priced above $6 million, the Expected Market Time decreased from 410 to 373 days. Luxury is at 223 days overall. At this pace, a seller would be looking at becoming a pending sale around March 2026.
Orange County Housing Summary
- INVENTORY: The active listing inventory in the past couple of weeks increased by 233 homes, up 5%, and now sits at 5,050, its highest level since November 2019. Last year, there were 3,371 homes on the market, 1,679 fewer homes, or 33% less. The 3-year average before COVID (2017-2019) was 6,776, which is 34% higher. From January through June, 25% fewer homes came on the market compared to the 3-year average before COVID (2017-2019), 5,562 less. Yet, 2,192 more sellers came on the market this year than last, and 4,232 more compared to 2023.
- DEMAND: Buyer demand, the number of pending sales over the prior month, increased from 1,565 to 1,584. Last year, there were 1,531 pending sales, 3% lower than today. The 3-year average before COVID (2017-2019) was 2,578, which is 63% higher.
- MARKET TIME: With supply rising much faster than demand, the Expected Market Time, the number of days to sell all Orange County listings at the current buying pace, increased slightly from 92 to 96 days in the past couple of weeks, its highest July level since 2011. Last year, it was 66 days, substantially faster than today. The 3-year average before COVID (2017-2019) was 80 days, which is also significantly faster than today.
- LUXURY: In the past two weeks, the Expected Market Time for homes priced between $2.5 million and $4 million decreased from 167 to 161 days. For homes priced between $4 million and $6 million, the Expected Market Time increased from 318 to 320 days. For homes priced above $6 million, the Expected Market Time decreased from 410 to 373 days.
- DISTRESSED HOMES: Short sales and foreclosures combined, comprised only 0.1% of all listings and 0.4% of demand. Only three foreclosures and three short sales are available today in Orange County, with a total of six distressed homes on the active market, down eight from two weeks ago. Last year, eight distressed homes were on the market, identical to today.
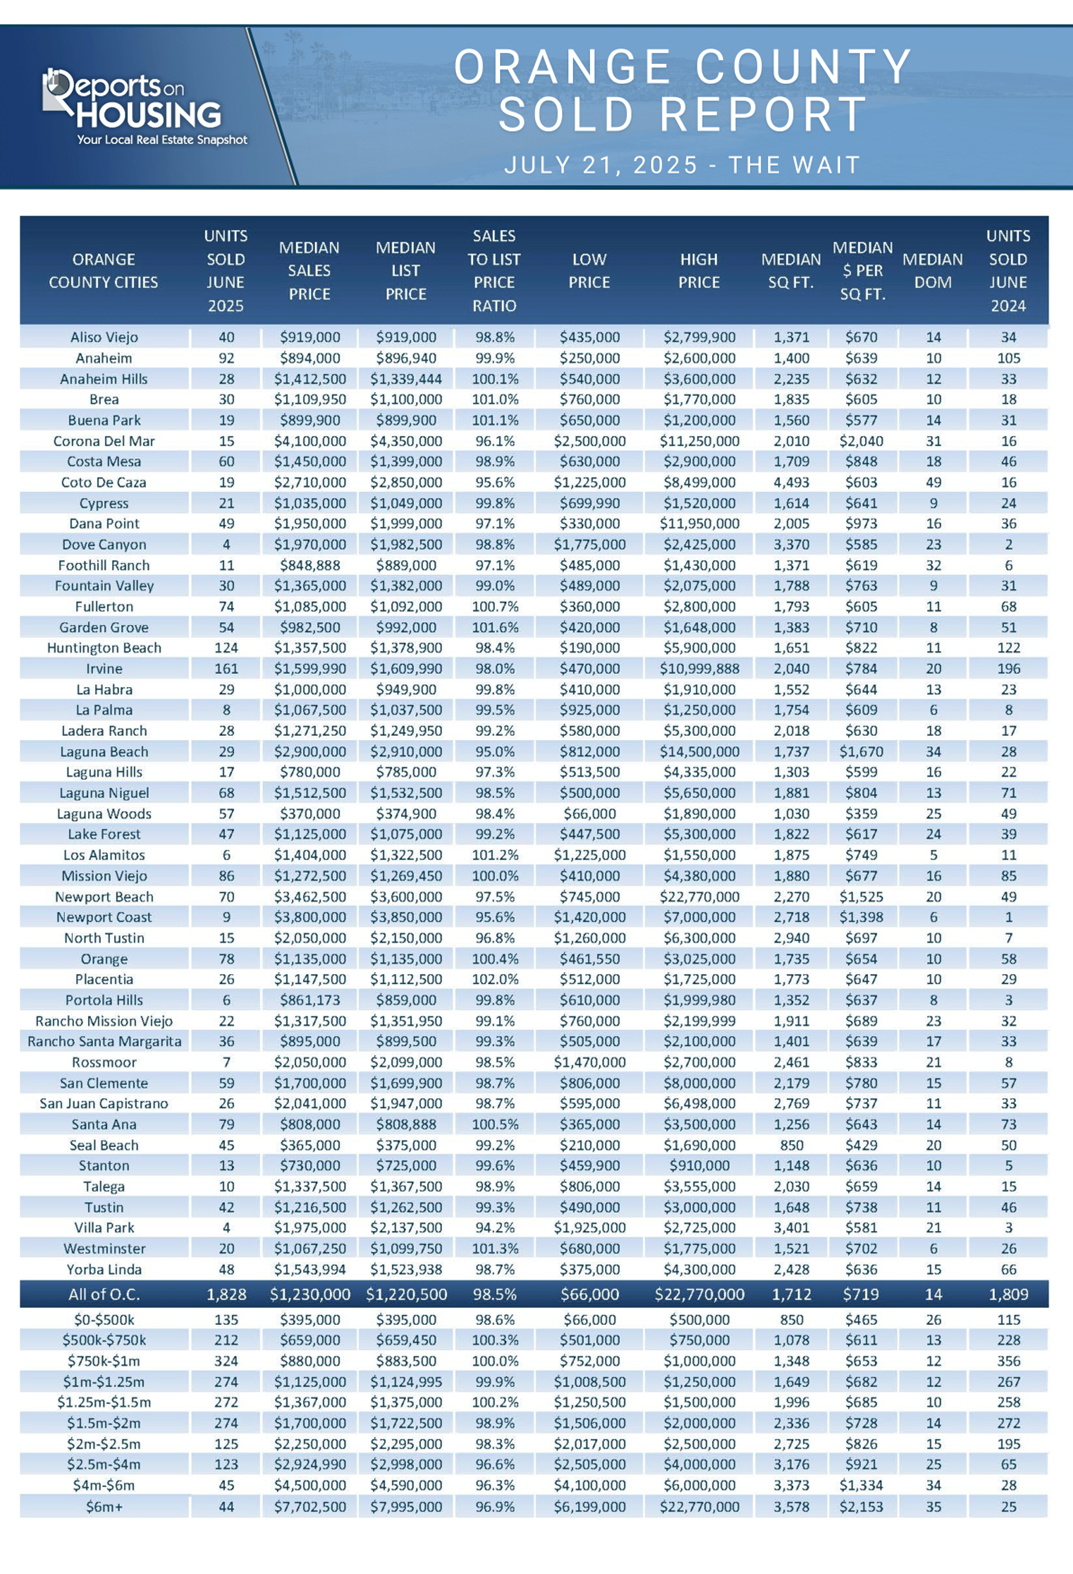
- CLOSED SALES: There were 1,828 closed residential resales in June, up 1% compared to June 2024’s 1,809 and nearly unchanged from May 2025. The sales-to-list price ratio was 98.5% for Orange County. Foreclosures accounted for 0.05% of all closed sales, and short sales accounted for 0.05%. That means that 99.9% of all sales were sellers with equity.
Have a great week.
Sincerely,
Steven Thomas
Quantitative Economics and Decision Sciences
Copyright 2025—Steven Thomas, Reports On Housing—All Rights Reserved. This report may not be reproduced in whole or in part without express written permission from the author.