June 9, 2025
The Orange County housing market varies significantly from one price range to another, as well as between detached homes and attached condominiums and townhomes.
Price Range Differences
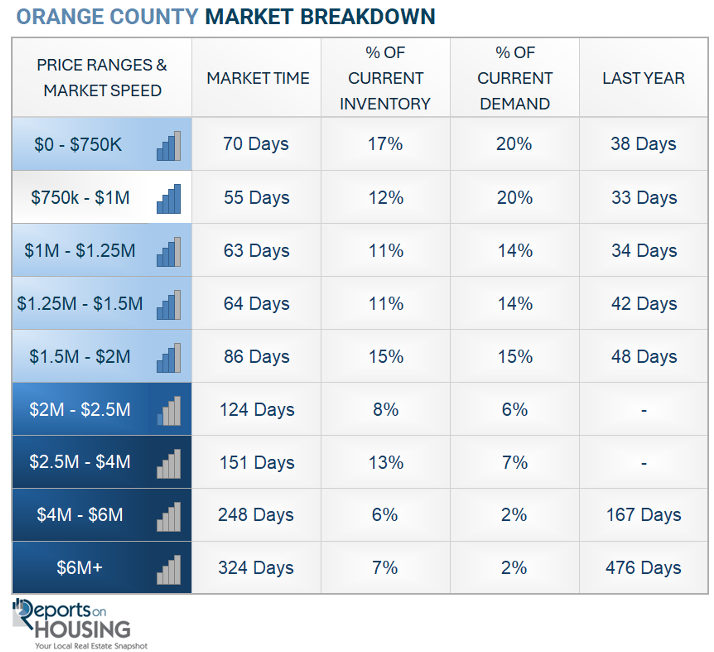
Market speeds vary by price and whether a home is detached or attached, but across the board, the market is significantly slower than it was in the last couple of years.
It is nearly time for the annual 4th of July 5K. For some, it’s a race, but for others, it’s a fun walk in the sunshine with friends by their side. The elite runners line up right in front of the starting line and run the course at an incomprehensible pace. Others jog pushing strollers or holding an American flag. Small kids speed past, weaving in and out of pedestrian traffic. Many briskly walk the entire route and enjoy a great conversation while exercising. There is a variety of running speeds in every 5K race.
Similarly, when the Orange County housing market is divided into various price ranges and separated between single-family detached homes and attached condominiums and townhomes, there is a variety of different speeds. Some ranges take weeks, while others take months or close to a year.
For years, one of the hottest price points has been detached homes priced between $750,000 and $1 million. While not as fast as last year’s 25-day Expected Market Time (the number of days it takes to sell all Orange County listings at the current buying pace) or 24 days two years ago, the current speed for these homes is 45 days. A turnkey home between $750,000 and $1 million, nicely appointed, in excellent condition, and priced appropriately, will attract considerable attention and sell quickly, often with multiple offers.
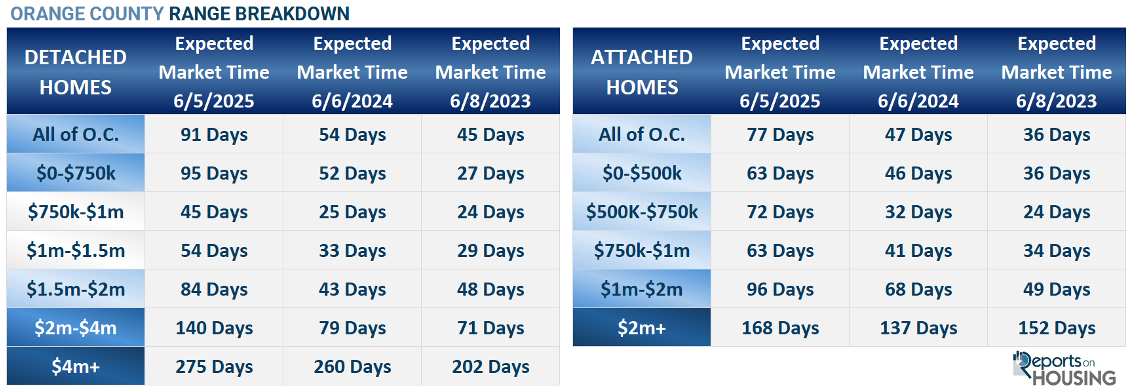
For detached homes priced between $1 million and $1.5 million, the Expected Market Time is relatively fast at 54 days, but it is not as instant as it has been the past couple of years. Detached homes slow from there, with nearly a 3-month Expected Market Time for homes priced between $1.5 million and $2 million. The higher the price, the longer it takes to sell. It takes 140 days to sell homes priced between $2 million and $4 million, and 275 days, or over nine months, to sell homes priced above $4 million.
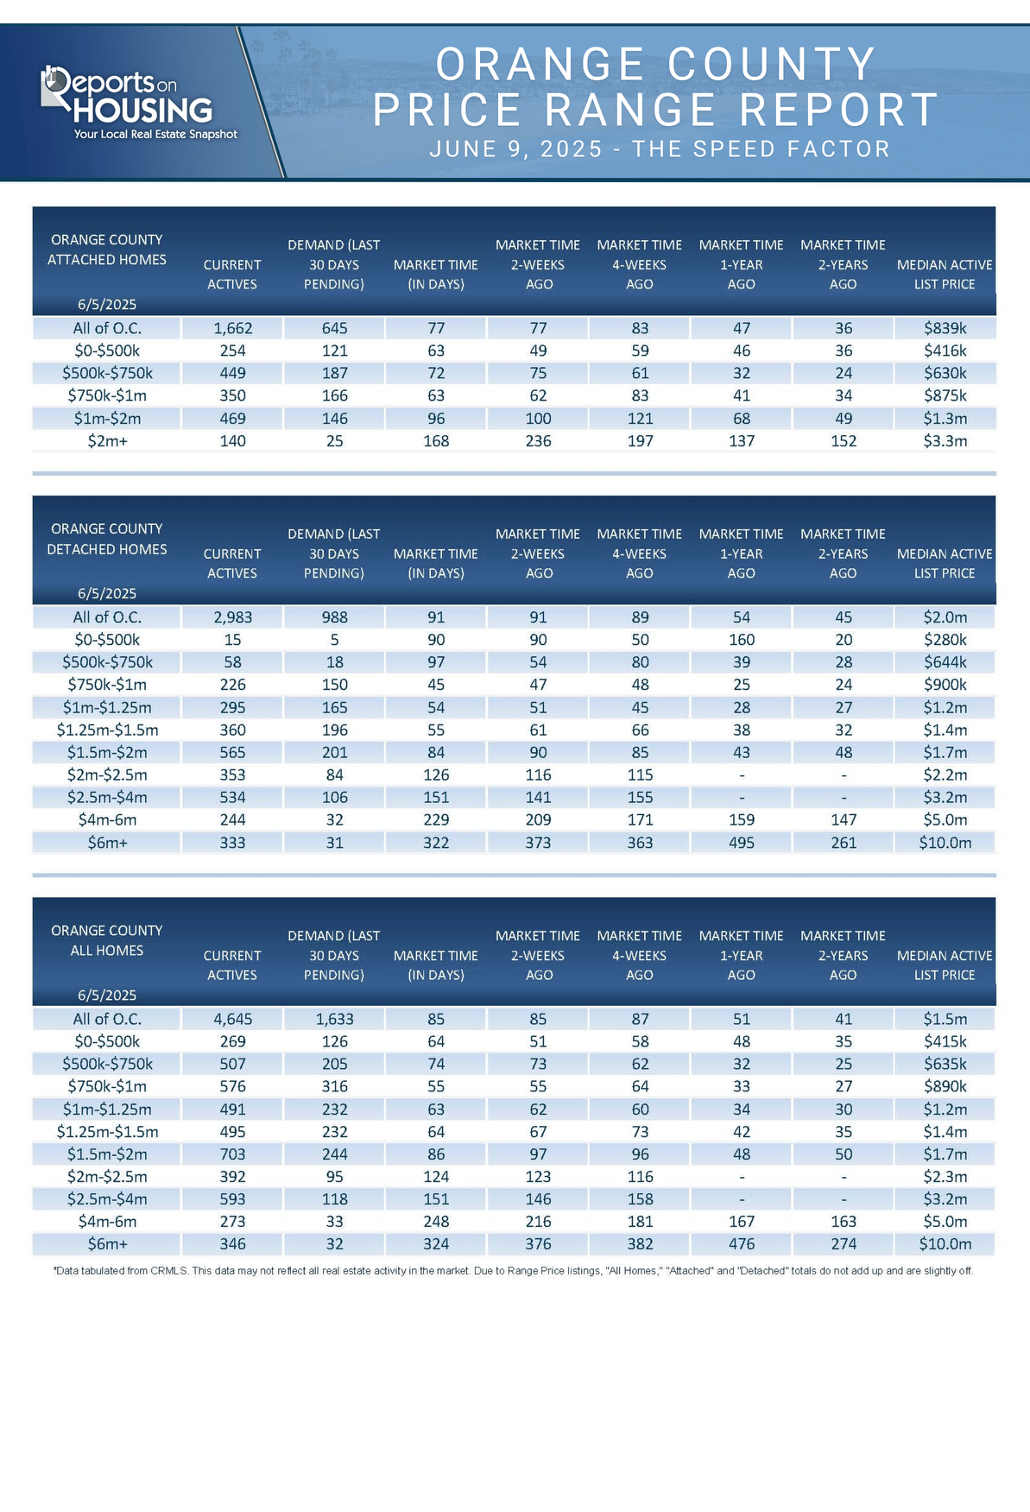
Overall, across all price ranges, detached homes take about three months from the time the FOR SALE sign is hammered in the yard to becoming a pending sale. It is taking a lot longer to sell due to the increased number of homeowners opting to sell this year compared to the last couple of years. The supply of detached homes has increased by 65% year-over-year, rising from 1,797 homes last year to 2,983 homes today. Yet, demand (a snapshot of the number of new pending sales over the prior month) has not changed much at all, falling slightly from 1,003 last year to 988 today, down 1.5% or 15 pending sales. The increased seller competition has resulted in the Expected Market Time rising from 54 days a year ago to 91 days today. It takes 37 days longer to sell this year. In comparison to two years ago, when the Expected Market Time was at an extremely fast 45 days, the supply was 1,428, which is 52% fewer available homes. Again, demand was not much different, with slightly fewer pending sales at 962.
There is also a big difference between attached condominiums and townhomes. Despite rapidly increasing monthly association fees due to rising insurance costs and required balcony inspections in the state of California, the attached homes market is faster than the detached homes market. Yet, detached homes priced between $750,000 and $1.5 million, which account for nearly 52% of detached buyer demand, are hotter than all attached price ranges. The fastest price ranges are condominiums and townhomes priced at $500,000 or less, and between $750,000 and $1 million. These ranges have an Expected Market Time of 63 days. It rises to 72 days for attached homes between $500,000 and $750,000. The Expected Market Time slows to 93 days for homes priced between $1 million and $2 million, and it jumps to 168 days for luxury attached properties priced over $2 million.
Like detached homes, the market speed was considerably faster for condominiums and townhomes last year, and nearly instant two years ago. The inventory is up 68% compared to last year, and up 116% compared to 2023. Demand is almost identical to last year, down seven pending sales, and up 2%, or 38 pending sales, compared to two years ago.
That is how the market has developed. Demand is not changing much from year to year, but more homeowners are participating and contributing to the build-up of today’s rising inventory. Rates exploded higher in 2022, rising from 3.25% in January to 7.37% in October 2022. At the start of 2022, 89% of Californians with a mortgage had a rate at or below 5%. 72% had a rate at or below 4%. As a result, in 2023, homeowners in Orange County “hunkered down” in their homes, unwilling to move due to their underlying, locked-in, low fixed-rate mortgage, and 41% fewer homeowners came on the market compared to the 3-year pre-pandemic average (2017-2019). In 2024, it dropped to 31% fewer. The additional sellers contributed to the supply of available homes, and inventory rose at a faster pace. This year, there are 25% fewer sellers. In matching more sellers with similar year-over-year demand, the active inventory has grown rapidly, and the market has downshifted considerably.
There are different speeds to the market, depending upon the price and whether a home is detached or attached. It is incumbent upon housing participants to consider the speed factor in approaching the market with the best strategy. A buyer looking to purchase a detached home at $850,000 will have a much different game plan than a buyer looking for a $1,600,000 home. Yet, it is also crucial for sellers to understand that as the supply of homes continues to grow and demand remains relatively the same, dropping slightly through the summer months, the Expected Market Time will also increase. The accumulation of extra homes means more seller competition.
To find success at ALL price points, it is vital that sellers carefully price their homes according to their Fair Market Values by meticulously scrutinizing recent comparable pending and closed sales. Overpriced homes result in wasted market time and prolonged periods on the market with little to no success, even in the hottest price ranges. Many sellers will fall victim to overpricing and will not achieve their objective until they correct their asking price with a reduction more aligned with their true Fair Market Value.
Active Listings
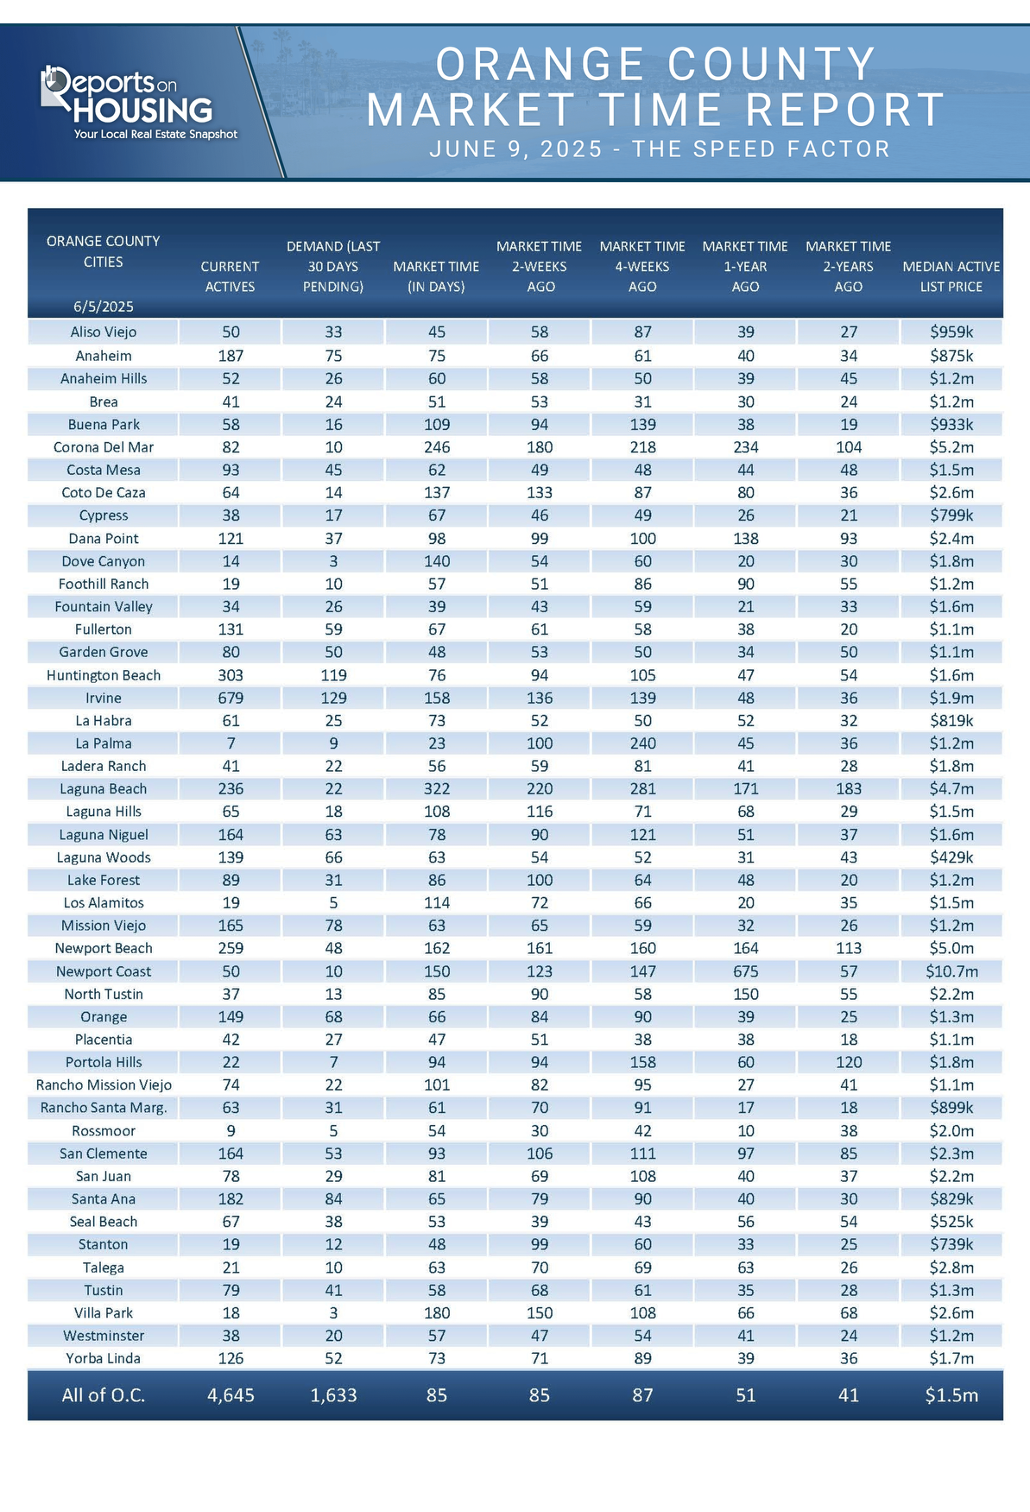
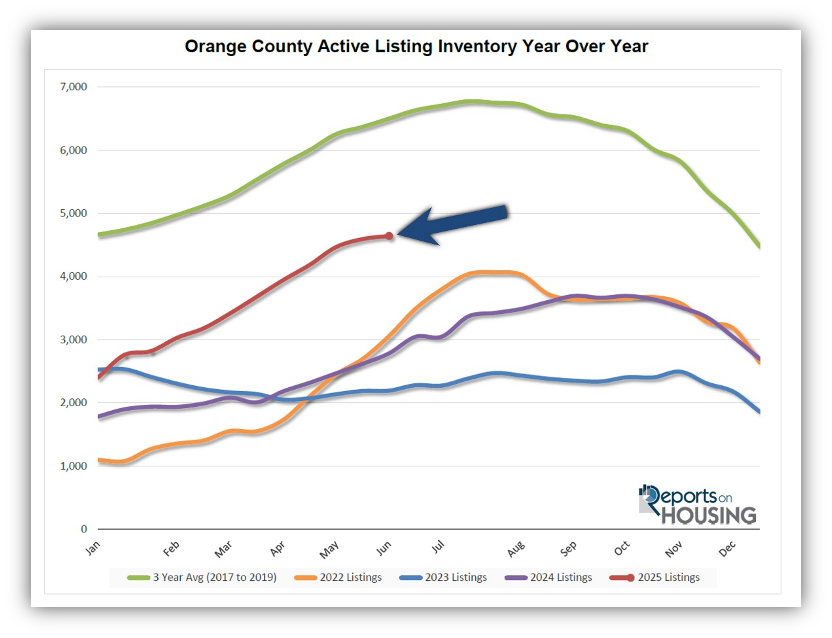
The inventory has grown by only 50 homes over the past couple of weeks.
The active listing inventory increased by 50 homes over the past two weeks, up 1%, and now stands at 4,645, marking its smallest rise of the year. Nonetheless, it is still the highest inventory level since July 2020. Summer has arrived, along with longer days and hotter temperatures. This is the season with a lot of distractions, from traveling to cooling off at the pool. Spring is the peak season for housing, characterized by the strongest demand. In summer, demand slowly drops due to all the distractions. Yet, many homeowners mistakenly believe that summer is the best time of the year to sell. As a result, the inventory continues to grow until it finds its peak between July and August. The peaks have occurred in the fall over the past couple of years due to high rates. This year will be no different. If rates climb above 7% during the second half of the year, the peak will come later. Yet, if rates drop, demand will rise and Orange County will reach its normal summer peak.
Last year, the inventory was at 2,786 homes, 40% lower, or 1,859 fewer. The 3-year average before COVID (2017-2019) was 6,501, an additional 1,856 homes, or 40% more.
Homeowners continue to “hunker down” in their homes, unwilling to move due to their current underlying, locked-in, low fixed-rate mortgage. This trend has been easing from the lows established in 2023. Through May, 13,694 homes were placed on the market in Orange County, 4,585 fewer than the 3-year average before COVID (2017-2019), 25% less. In 2024, only 11,786 homes entered the market, and in 2023, it was only 10,062. More sellers are opting to sell in 2025.
Demand
Demand increased by 12 pending sales.
Demand, a snapshot of the number of new pending sales over the prior month, increased from 1,621 to 1,633 in the past couple of weeks, up 12 pending sales, or 1%. Since establishing what appeared to be a peak in mid-March at 1,665 pending sales, demand has decreased by only 32 pending sales, or 2%. The Mortgage Bankers Association of America (MBA) has a purchase application index that has been higher than last year for 18 straight weeks. It has not yet translated into extra demand due to negative sentiment across the U.S. stemming from the tariff announcement a couple of months ago. While there may have been a “tariff effect” on buyer demand, it has waned, and buyers are now turning their attention back to housing. It will be essential to watch the direction of rates from here. Any dramatic improvement in mortgage rates will immediately impact buyer demand. Similarly, a jump in rates could squash potential demand.
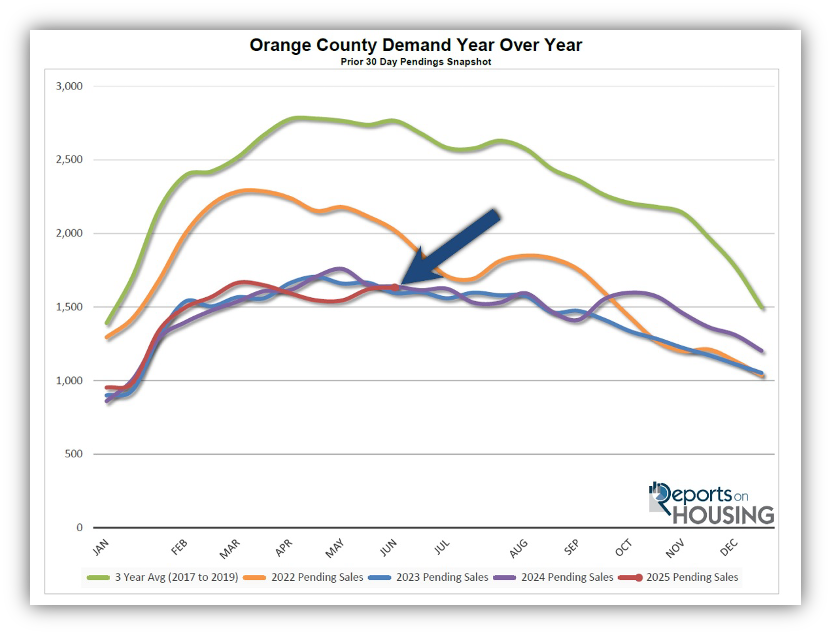
Last year, demand was 1,640, with seven additional pending sales, or nearly unchanged. The 3-year average before COVID (2017-2019) was 2,766 pending sales, 69% higher than today, representing an additional 1,933 sales.
As the Federal Reserve has indicated, watching all economic releases for signs of slowing is essential. That is the only path to lower mortgage rates at this time. These releases can cause mortgage rates to move higher or lower, depending on how they compare to market expectations. This week, the Producer Price Index (PPI) and the Consumer Price Index (CPI) will be released, two key indicators of inflation. Next week, the Federal Reserve will meet and conduct a press conference to announce its decision on the Federal Funds rate, ultimately revealing its appetite to cut rates in the near future and into 2025.
Expected Market Time
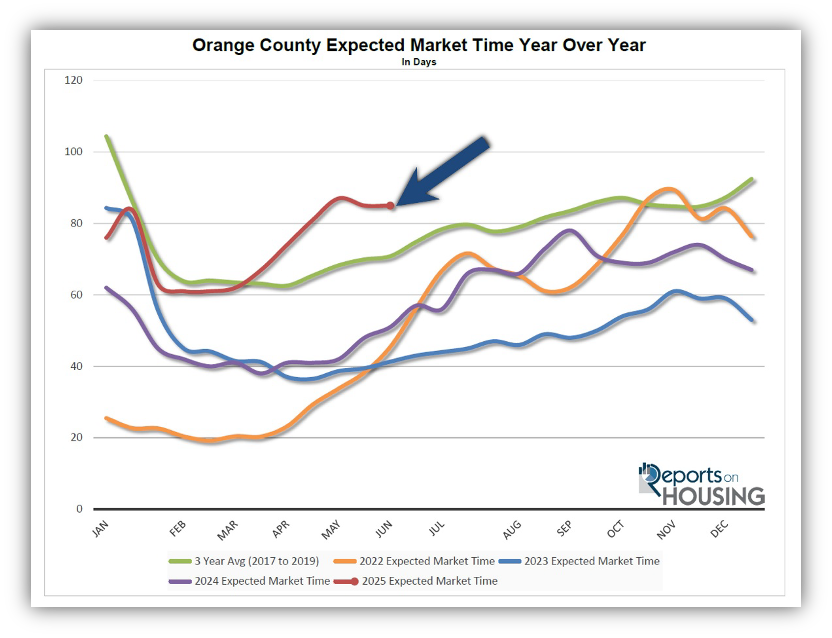
The Expected Market Time remained unchanged in the past couple of weeks.
With the supply of available homes rising by 50 homes, up 1%, and demand increasing by 12 pending sales, also up 1%, the Expected Market Time (the number of days it takes to sell all Orange County listings at the current buying pace) remained unchanged at 85 days in the past couple of weeks.
Last year, it was 51 days, substantially faster than today. The 3-year average before COVID was 71 days, which is also much quicker than today.
The Expected Market Time for condominiums and townhomes remained unchanged at 77 days in the past two weeks. It was at 47 days last year. For detached homes, the Expected Market Time remained unchanged at 91 days. It was 54 days a year ago.
Luxury End
The luxury market slowed slightly in the past couple of weeks.
The luxury inventory of homes priced above $2.5 million (the top 10% of the Orange County housing market) decreased from 1,218 to 1,212 homes, a decrease of six, or nearly unchanged. Luxury demand decreased by five pending sales, down 3%, and now sits at 183. The Expected Market Time for luxury homes priced above $2.5 million increased slightly from 194 to 199 days. The luxury market typically downshifts and cools a bit during the Summer Market.
In the past two weeks, the Expected Market Time for homes priced between $2.5 million and $4 million increased from 146 to 151 days. For homes priced between $4 million and $6 million, the Expected Market Time increased from 216 to 248 days. For homes priced above $6 million, the Expected Market Time decreased from 376 to 324 days. At 324 days, a seller would be looking at placing their home into escrow around April 2026.
Orange County Housing Summary
- INVENTORY: The active listing inventory in the past couple of weeks increased by 50 homes, up 1%, and now sits at 4,645, its highest level since July 2020. Last year, there were 2,786 homes on the market, 1,859 fewer homes, or 40% less. The 3-year average before COVID (2017-2019) was 6,501, which is 40% higher. From January through May, 25% fewer homes came on the market compared to the 3-year average before COVID (2017-2019), 4,585 less. Yet, 1,908 more sellers came on the market this year than last, and 3,632 more compared to 2023.
- DEMAND: Buyer demand, the number of pending sales over the prior month, increased from 1,621 to 1,633. Last year, there were 1,640 pending sales, nearly the same as today. The 3-year average before COVID (2017-2019) was 2,766, which is 69% higher.
- MARKET TIME: With supply and demand rising at a similar pace, the Expected Market Time, the number of days to sell all Orange County listings at the current buying pace, remained unchanged at 85 days in the past couple of weeks. Last year, it was 51 days, substantially faster than today. The 3-year average before COVID (2017-2019) was 71 days, which is also significantly faster than today.
- LUXURY: In the past two weeks, the Expected Market Time for homes priced between $2.5 million and $4 million increased from 146 to 151 days. For homes priced between $4 million and $6 million, the Expected Market Time increased from 216 to 248 days. For homes priced above $6 million, the Expected Market Time decreased from 376 to 324 days.
- DISTRESSED HOMES: Short sales and foreclosures combined, comprised only 0.2% of all listings and 0.2% of demand. Only four foreclosures and four short sales are available today in Orange County, with a total of eight distressed homes on the active market, up four from two weeks ago. Last year, seven distressed homes were on the market, similar to today.
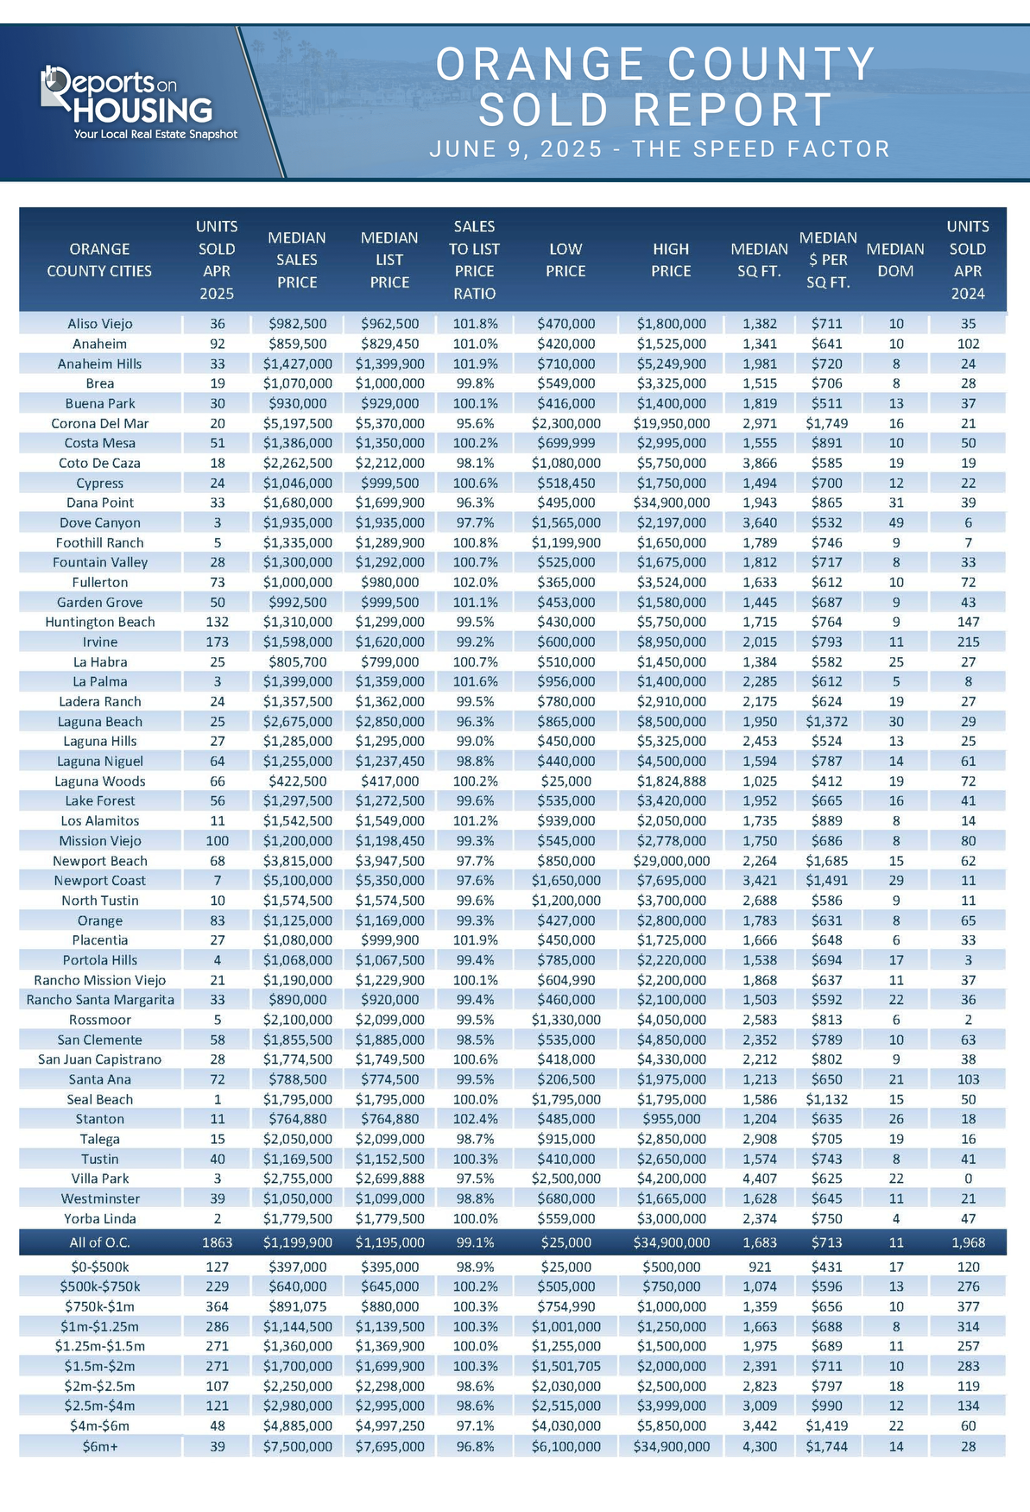
- CLOSED SALES: There were 1,863 closed residential resales in April, down 5% compared to April 2024’s 1,968 and up 3% from March 2025. The sales-to-list price ratio was 99.1% for Orange County. Foreclosures accounted for 0.1% of all closed sales, and there were no short sales. That means that 99.9% of all sales were sellers with equity.
Have a great week.
Sincerely,
Steven Thomas
Quantitative Economics and Decision Sciences
Copyright 2025—Steven Thomas, Reports On Housing—All Rights Reserved. This report may not be reproduced in whole or in part without express written permission from the author.