May 12, 2025
Since the Great Recession, significantly fewer homeowners have been selling their homes, and the higher mortgage rate environment has further slowed the number of sales.
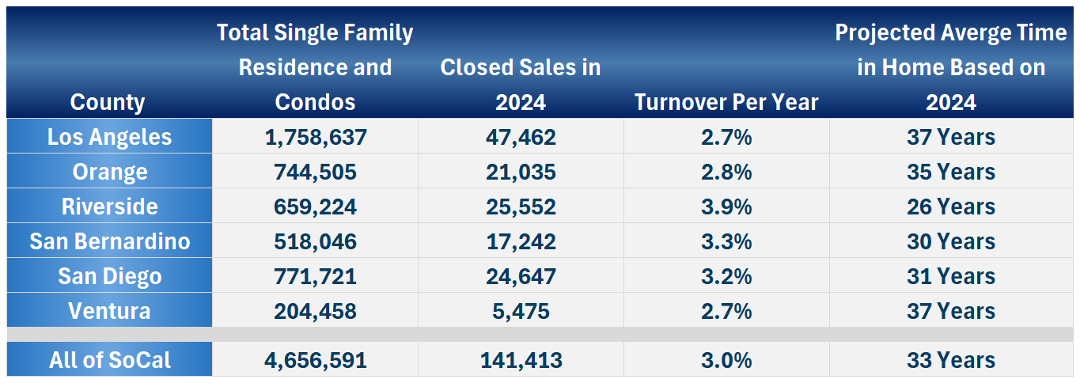
A Low Turnover
The slow pace of home sales has contributed to more homeowners remaining in their homes long-term.
The days are getting longer. The temperatures are rising. Memorial Day, the unofficial start to Summer, is only two weeks away. Soon, everyone will be flocking to the water to cool off. From the community pool to the crashing waves at the beach, crowds will escape the heat and enjoy splashing around. Yet, many will forget to reapply sunscreen. It is not until arriving home and gazing in the mirror that most people realize they have a lobster red sunburn from head to toe. For weeks and even years, that sunburn becomes a compelling reminder to reapply sunscreen.
Similarly, homeowners nationwide watched the housing market take a severe pounding during the Great Recession as home values plunged and everyone’s equity vanished in the blink of an eye. So many lost their homes to foreclosures or short sales. Nearly everyone was either personally stung by the correction or knew of somebody who was. As a direct result, fewer homeowners sell their homes each year, and the high mortgage rate environment has exacerbated the issue further.
From 2003 to 2006, before the Great Recession, there was an average of 6.63 million residential resales. From 2012 through 2019, resales dropped to an average of 5.20 million during the recovery and expansion period, or 22% lower. That has been the story ever since the pain of the Great Recession, fewer homeowners have participated in the housing market. Homeowners remain in their homes for a lot longer. They are sitting tight. In 2023 and 2024, due to much higher mortgage rates, even fewer homeowners placed their homes on the market, and buyer demand weakened seemingly overnight. Average residential resales dropped to 4.08 million, a substantial 38% lower than before the Great Financial Crisis, and 22% below the recovery and expansion of the last decade.
There are simply far fewer homes being exchanged across the country and locally. This more than a decade-long trend is now the norm and has deepened with higher rates. Based on 2024 closed sales, the turnover rate for Orange County’s housing stock is once every 35 years. Astonishingly, only 2.8% of all homeowners sold their homes last year. The turnover rate is once every 33 years for all of Southern California.
There are many reasons why homeowners in Orange County and across the nation are opting to sit tight. It was a much more speculative environment before the Great Recession. Far too many treated their home as an investment, utilizing their equity cushion as an ATM, and they jumped from house to house, expecting instant returns. They took advantage of loose lending standards and ultimately settled for loans that did not make financial sense long-term.
After feeling the burn from the Great Recession, most buyers looked for a “home,” a long-term commitment they would keep for years. They are looking at the roof over their head as their “forever home,” a place to put down enduring roots, stability, neighborhood connections, and establish a sense of community.
Most homeowners have refinanced to historically low interest rates, some as low as the mid-twos, making moving much more challenging in today’s higher mortgage rate environment. In addition, the baby boomers are “aging in place,” staying put instead of downsizing after retirement. An entire industry was developed to service and permit seniors to live out their lives in the comfort of their homes. This may be due to a longer life expectancy and a healthier lifestyle. Many had expected a “silver tsunami” of seniors suddenly selling their homes in significant numbers. Yet, they have been selling at a much slower pace than prior generations. These factors combined have contributed to the low turnover rate in the housing stock.
This lower turnover rate in the housing stock is here to stay and has resulted in lower inventory levels since the Great Recession, from 2012 through 2019. The pandemic made the issue far worse as rates dropped to record lows, and the supply of available homes fell to unimaginable levels. As the inventory levels rise to pre-COVID levels due to higher rates and lower demand, many will claim a substantial imbalance in the market with far too much supply. Yet, the proper perspective illustrates that housing is returning to a better balance between supply and demand.
When rates finally fall towards 6% or lower, demand will rise substantially, and the inventory will drop once again. The number of closed sales will increase and the turnover rate will improve, but it will only make its way towards 2012 through 2019 averages, meaning many homeowners will continue to sit tight.
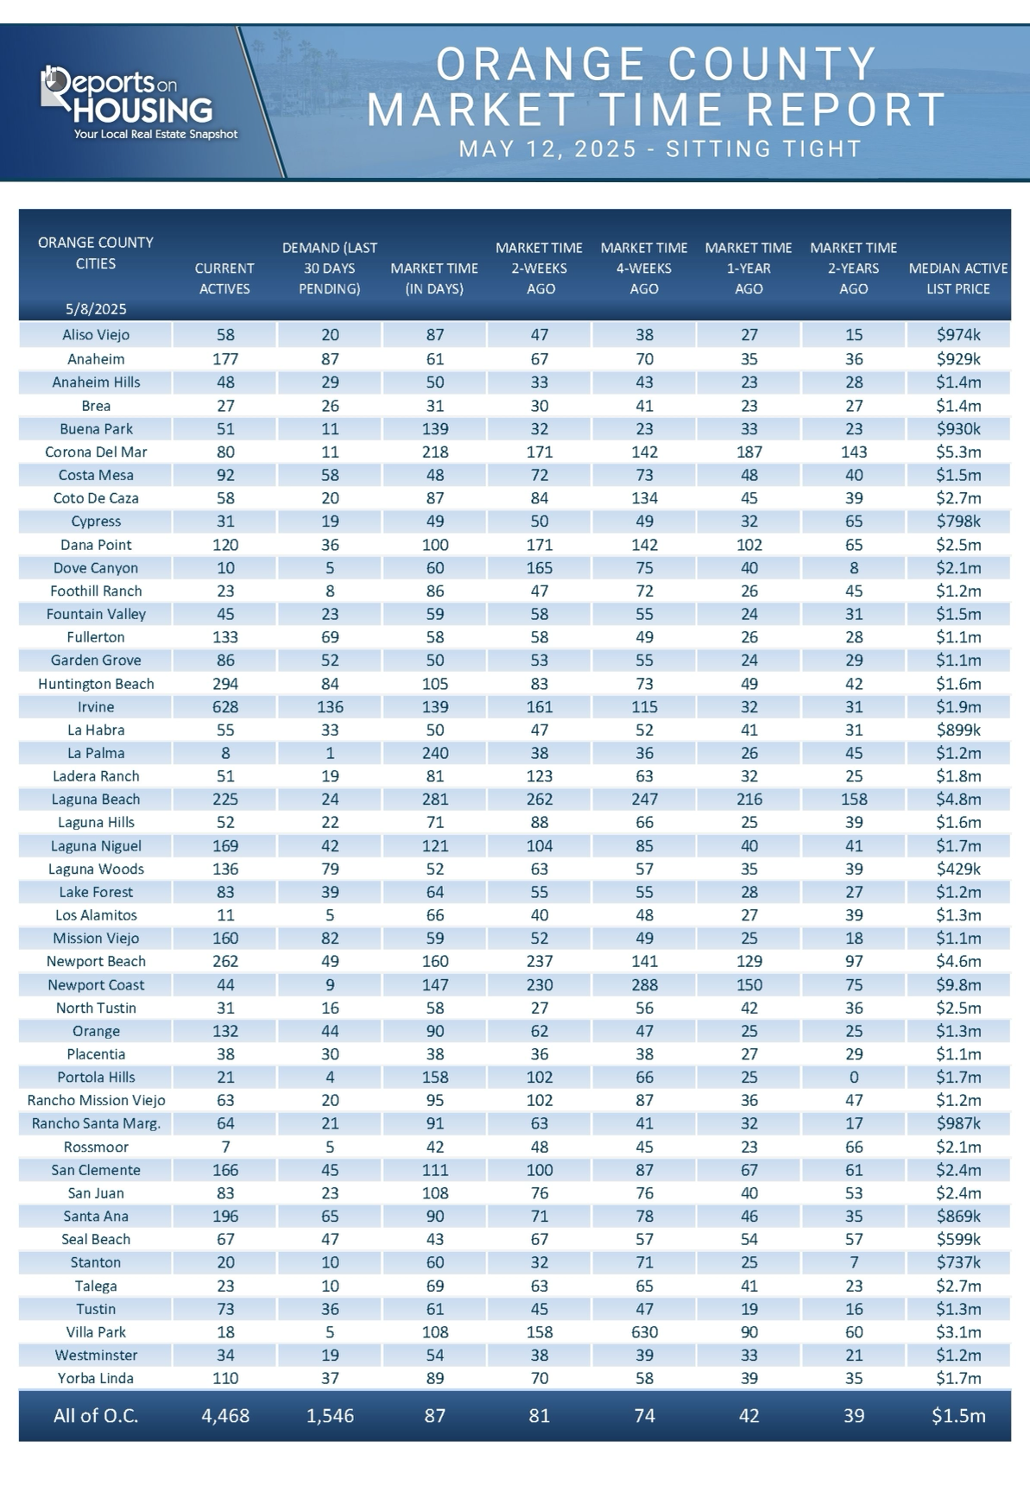
Active Listings
The inventory grew by 7% in the past couple of weeks.
The active listing inventory increased by 282 homes in the past two weeks, up 7%, and now sits at 4,468, its highest level since July 2020, and its most significant rise since mid-January. The storyline for this year is that the inventory is climbing at an unprecedented rate. In fact, the 2,067 home rise from the start of the year to the beginning of May is the largest since 2010, when it climbed by 2,263 homes. During the Spring and Summer Markets, the inventory rises unabated. The difference this year is that more homeowners are opting to sell after an extensive drought of participants ever since rates climbed above 7% in 2022. The fewest number of homeowners participated in 2023. There were more sellers in 2024, but it was still far below pre-pandemic averages. In 2025, there were 19% more new sellers than last year, 1,706 additional FOR SALE signs, and 39% more than in 2023, an additional 3,056 signs. The issue is that stubbornly high rates have translated to buyer demand remaining low at similar year-over-year levels. The extra signs are accumulating at a breakneck pace.
Last year, the inventory was at 2,470 homes, 45% lower, or 1,998 fewer. The 3-year average before COVID (2017 through 2019) was 6,255, an additional 1,787 homes, or 40% more.
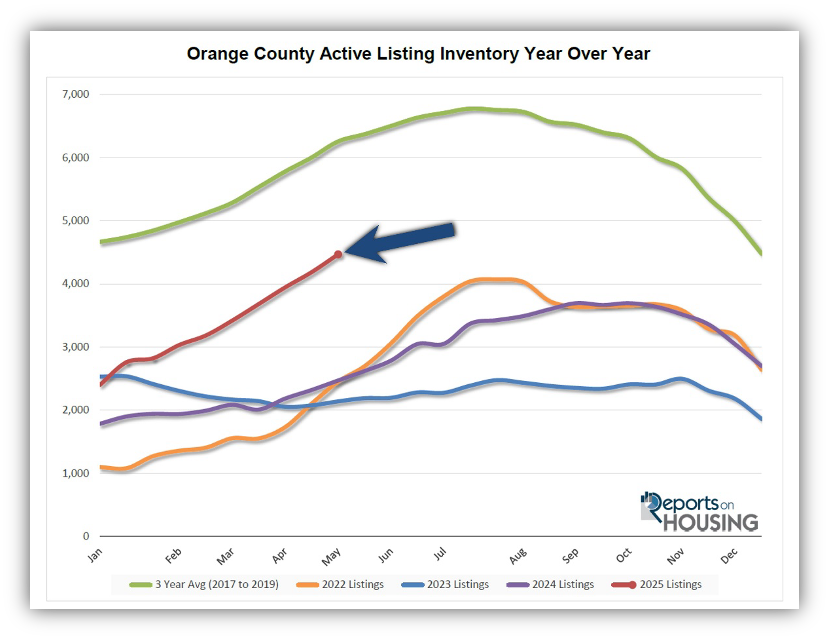
Homeowners continue to “hunker down” in their homes, unwilling to move due to their current underlying, locked-in, low fixed-rate mortgage. This trend has been easing from the lows established in 2023. Through April, 10,808 homes were placed on the market in Orange County, 3,306 fewer than the 3-year average before COVID (2017 to 2019), 23% less. In 2024, only 9,102 homes entered the market, and in 2023, it was only 7,752. More sellers are opting to sell in 2025.
Demand
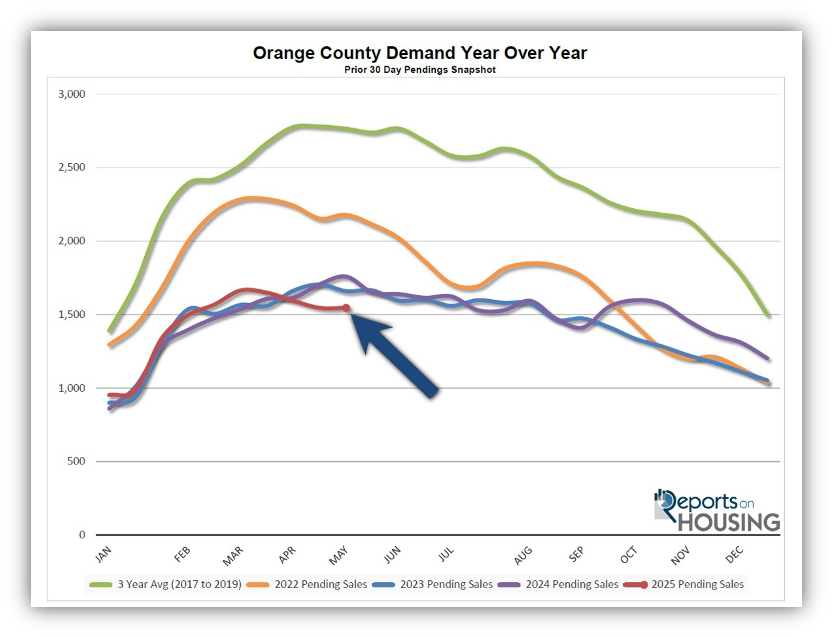
Demand remained unchanged in the past couple of weeks.
Demand, a snapshot of the number of new pending sales over the prior month, remained unchanged at 1,546 in the past couple of weeks. It was the lowest May reading since tracking began in 2004. Mortgage rates are slightly lower than last year, 6.92% today compared to 7.12% last year, yet the somewhat lower rate environment has not translated to additional home sales. This phenomenon is most likely due to a collapse in consumer sentiment since the announcement of deep tariffs on April 2nd. Plunging sentiment has led some potential buyers to place their home search efforts on hold despite improving rates. Financial market volatility has further eroded consumer confidence. It will be interesting to see if the recent positive developments in the trade war with China will impact sentiment and ultimately weave its way into housing demand.
Last year, demand was 1,759, with 213 additional pending sales or 14% more. The 3-year average before COVID (2017 to 2019) was 2,765 pending sales, 79% more than today, or an additional 1,219.
As the Federal Reserve has indicated, watching all economic releases for signs of slowing is essential. That is the only path to lower mortgage rates right now. These releases can move mortgage rates higher or lower, depending on how they compare to market expectations. This week is the release of the Consumer Price Index (CPI) and Producer Price Index (PPI), two crucial inflation indicators. Next week, the S&P Global Manufacturing and Services Purchasing Manager’s Index (PMI) will be released on Wednesday. Future tariff announcements could impact rates as well.
Expected Market Time
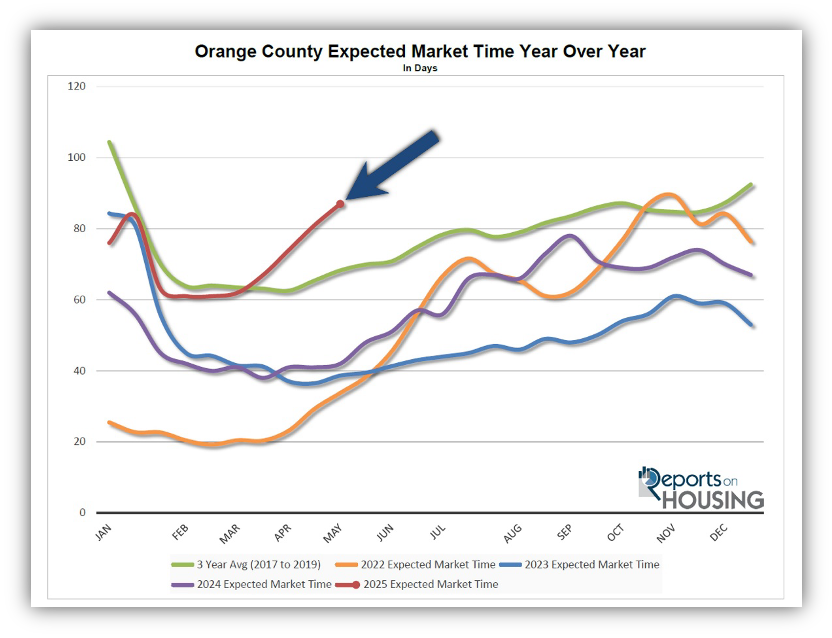
The Expected Market Time increased by six days.
With the supply of available homes rising by 282 homes, up 7%, and demand unchanged, the Expected Market Time (the number of days it takes to sell all Orange County listings at the current buying pace) jumped from 81 to 87 days in the past couple of weeks, its slowest pace since November 2022. In the past six weeks, it has risen by 20 days.
Last year, it was 42 days, more than twice as fast as today. The 3-year average before COVID was 68 days, which is also much quicker than today. The last time the Expected Market Time exceeded 87 days at the start of May was during the COVID lockdowns in 2020, when it reached 90 days, but was rapidly falling.
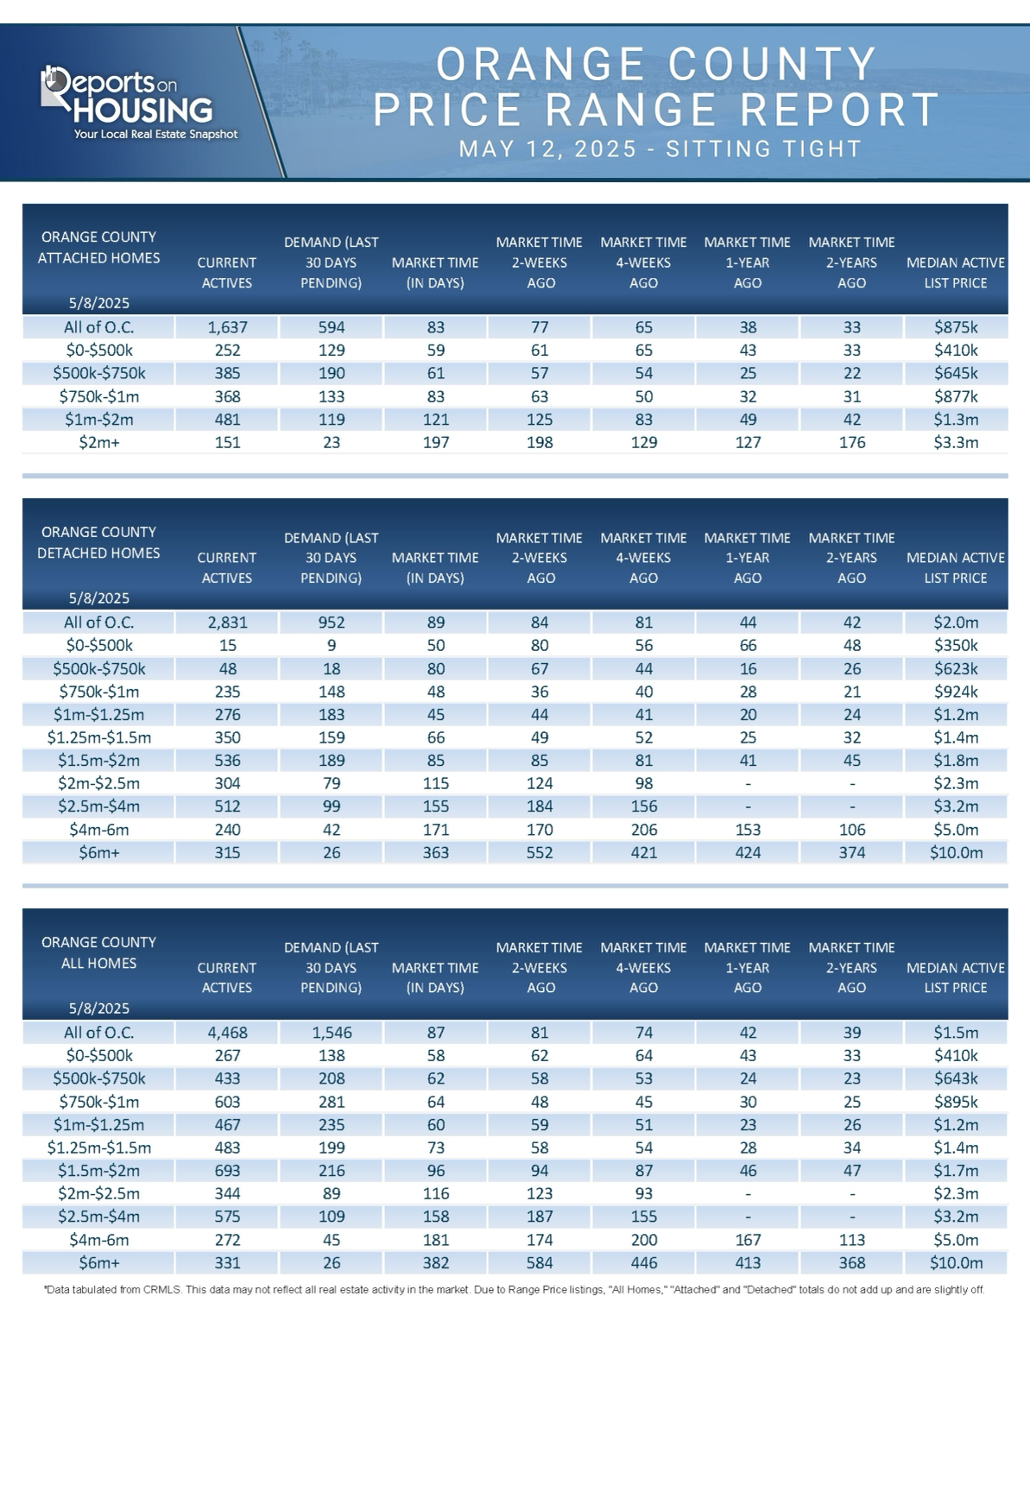
Luxury End
The luxury market improved in the past couple of weeks.
The luxury inventory of homes priced above $2.5 million (the top 10% of the Orange County housing market) increased from 1,142 to 1,178 homes, up 36 or 3%. Luxury demand increased by 30 pending sales, up 20%, and now sits at 150, its first rise since the end of February when it grew by 30 as well. The Expected Market Time for luxury homes priced above $2.5 million dropped from 228 to 196 days, its best reading since the end of March. The luxury market in Orange County continues to be impacted by the volatility in the financial markets and plunging consumer sentiment. The recent improvements on the trade front are working their way into luxury.
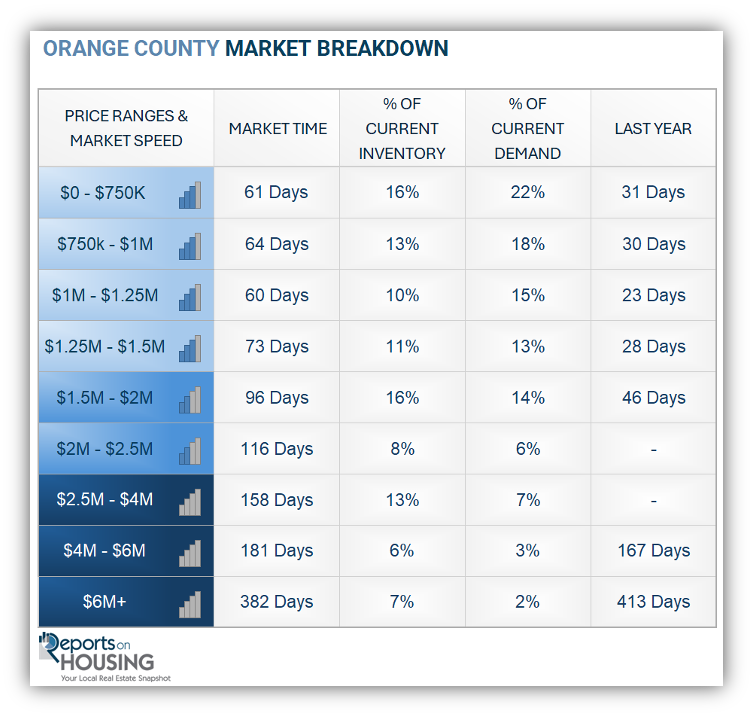
In the past two weeks, the Expected Market Time for homes priced between $2.5 million and $4 million decreased from 187 to 158 days. For homes priced between $4 million and $6 million, the Expected Market Time increased from 174 to 181 days. For homes priced above $6 million, the Expected Market Time decreased from 584 to 382 days. At 382 days, a seller would be looking at placing their home into escrow around May 2026.
Orange County Housing Summary
- INVENTORY: The active listing inventory in the past couple of weeks increased by 282 homes, up 7%, and now sits at 4,468, its highest level since July 2020. Last year, there were 2,470 homes on the market, 1,998 fewer homes, or 45% less. The 3-year average before COVID (2017 to 2019) was 6,255, or 40% extra. From January through April, 23% fewer homes came on the market compared to the 3-year average before COVID (2017 to 2019), 3,306 less. Yet, 1,706 more sellers came on the market than last year, and 3,056 more compared to 2023.
- DEMAND: Buyer demand, the number of pending sales over the prior month, remained unchanged at 1,546, its lowest May reading since tracking began in 2004. Last year, there were 1,759 pending sales, 14% more. The 3-year average before COVID (2017 to 2019) was 2,765, or 79% more.
- MARKET TIME: With supply surging higher and demand unchanged, the Expected Market Time, the number of days to sell all Orange County listings at the current buying pace, climbed from 81 to 87 days in the past couple of weeks, its slowest pace since November 2022. Last year, it was 42 days, more than twice as fast as today. The 3-year average before COVID (2017 to 2019) was 68 days, which is also much faster than today.
- LUXURY: In the past two weeks, the Expected Market Time for homes priced between $2.5 million and $4 million decreased from 187 to 158 days. For homes priced between $4 million and $6 million, the Expected Market Time increased from 174 to 181 days. For homes priced above $6 million, the Expected Market Time decreased from 584 to 382 days.
- DISTRESSED HOMES: Short sales and foreclosures combined, comprised only 0.1% of all listings and 0.4% of demand. Only two foreclosures and four short sales are available today in Orange County, with six total distressed homes on the active market, down three from two weeks ago. Last year, five distressed homes were on the market, similar to today.
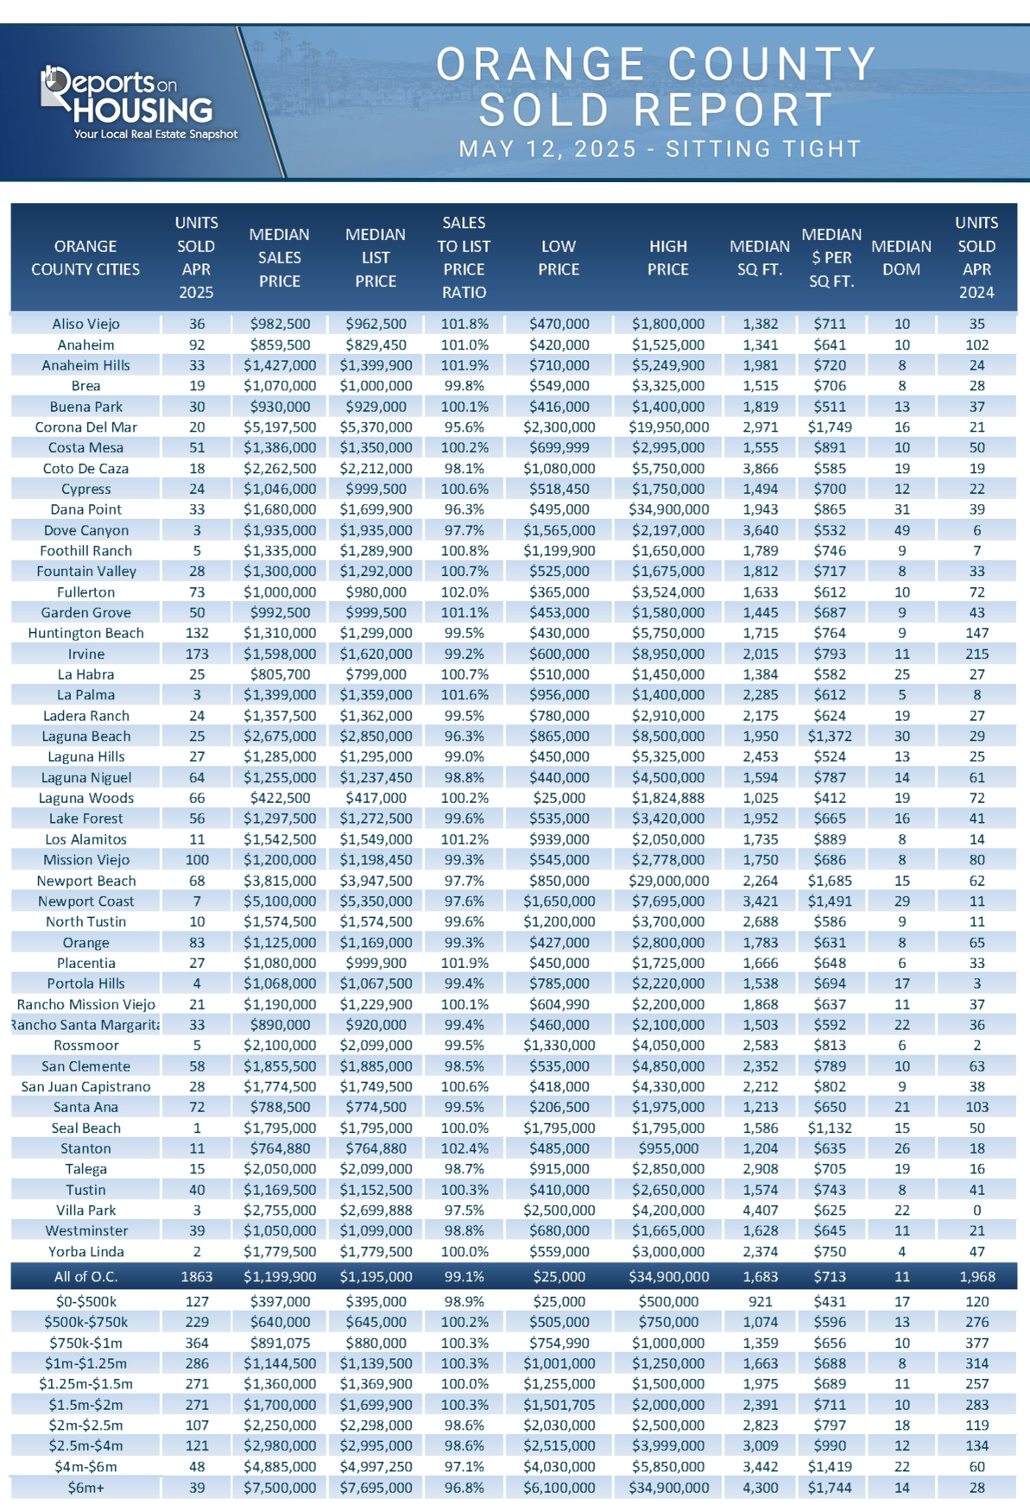
- CLOSED SALES: There were 1,863 closed residential resales in April, down 5% compared to April 2024’s 1,968 and up 3% from March 2025. The sales-to-list price ratio was 99.1% for Orange County. Foreclosures accounted for 0.1% of all closed sales, and there were no short sales. That means that 99.9% of all sales were sellers with equity.
Have a great week.
Sincerely,
Steven Thomas
Quantitative Economics and Decision Sciences
Copyright 2025—Steven Thomas, Reports On Housing—All Rights Reserved. This report may not be reproduced in whole or in part without express written permission from the author.