February 18, 2025
More homes are on the market, more homeowners are deciding to sell than in the last couple of years, and more are coming as housing makes its way to spring.
A Climbing Supply of Homes
The active inventory is 56% higher than last year and is at its highest mid-February level since 2020.
The cookies have arrived! It is Girl Scout season once again. There are times when there is an overabundance of young Girl Scouts attempting to sell as many boxes as humanly possible. Some go door to door, others pivot to the local grocery store, while many turn to their parents’ workplaces to increase their sales count. When too many hit the same neighborhood, the competition amplifies; for some, it is very hard to sell their cookies.
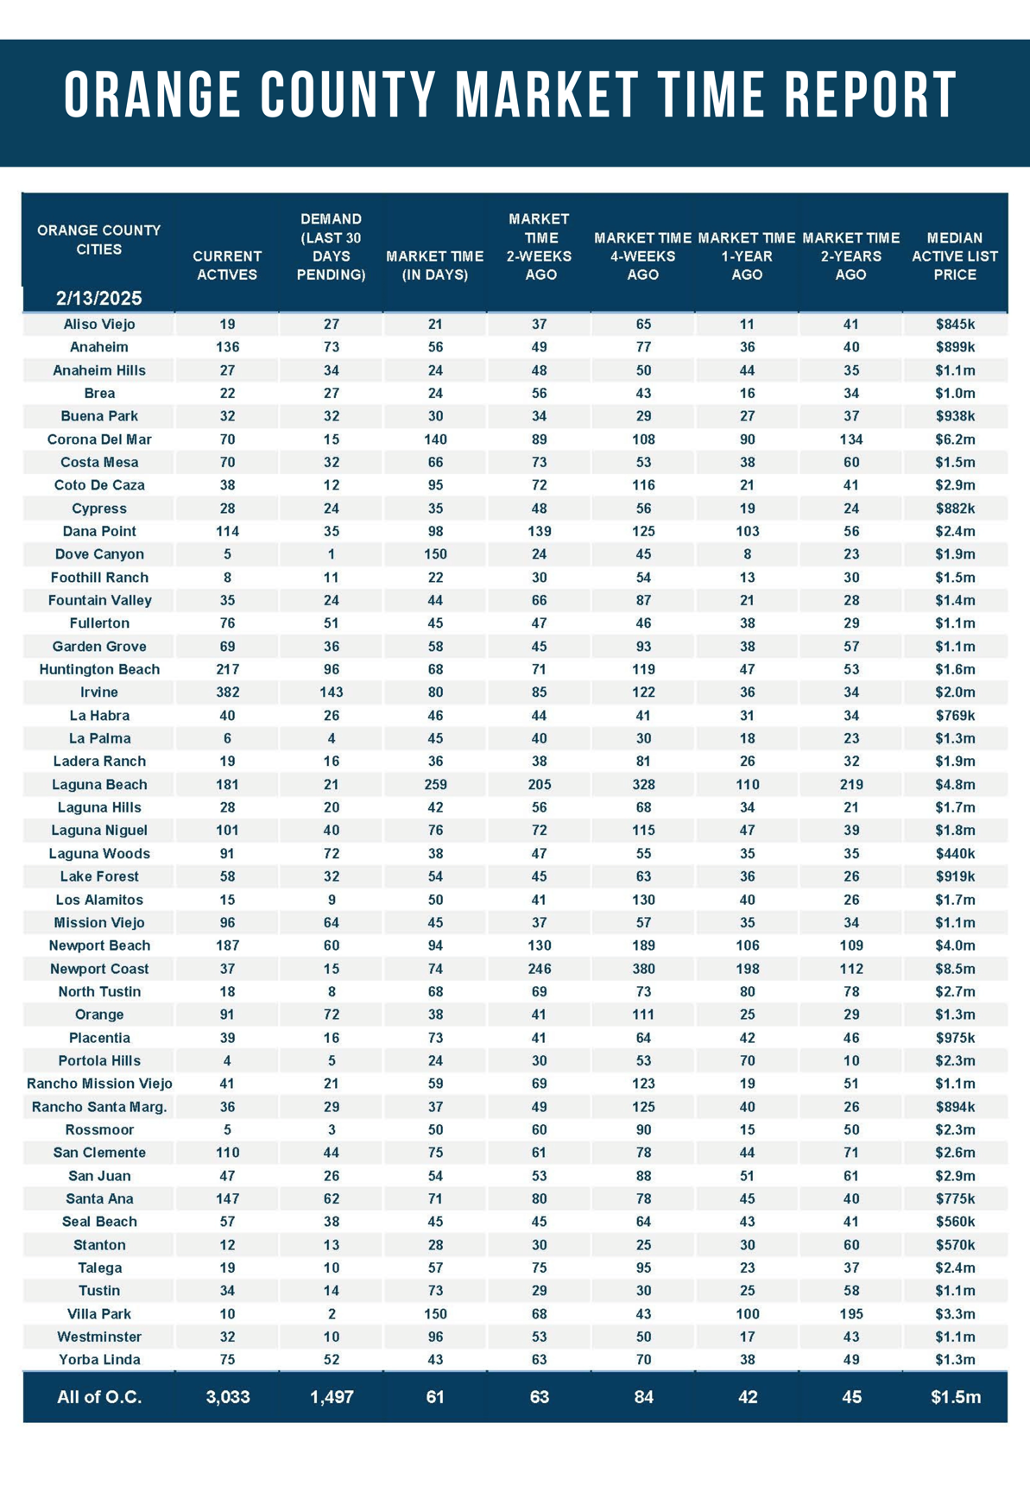
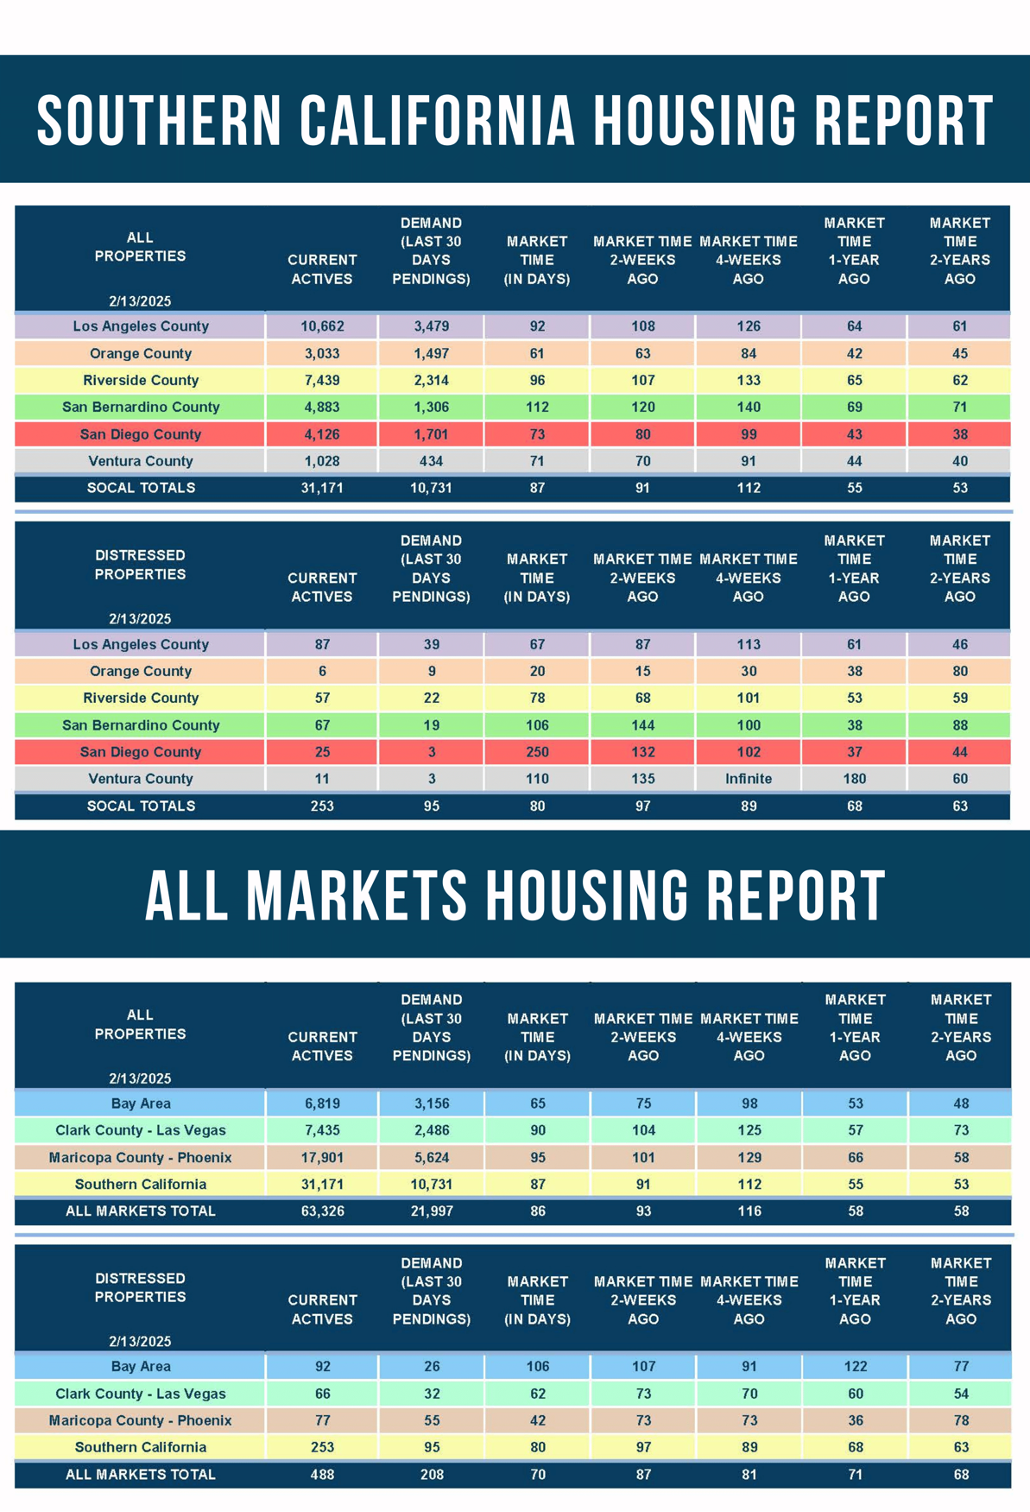
That is precisely what is happening in the Orange County real estate market. Many more sellers are hitting the market, the competition is amplifying, and it is very hard for some to sell their homes. There are currently 3,033 homes on the market, 56% more than last year’s 1,939 at this time. That is 1,094 additional homes year-over-year. It is the most homes for mid-February since 2020 when there were 4,030.
The inventory has been rising due to the higher mortgage rate environment. The Federal Reserve raised the short-term Federal funds rate 11 times from March 2022 through July 2023, and long-term mortgage rates exploded higher from 3.25% in January 2022 to over 7% eight months later in September. They have remained above 6% ever since and have been stuck, for the most part, above 7% since July 2023. Higher mortgage rates have precluded many homeowners from placing their homes on the market and selling. They “hunkered down” in their homes and opted not to sell.
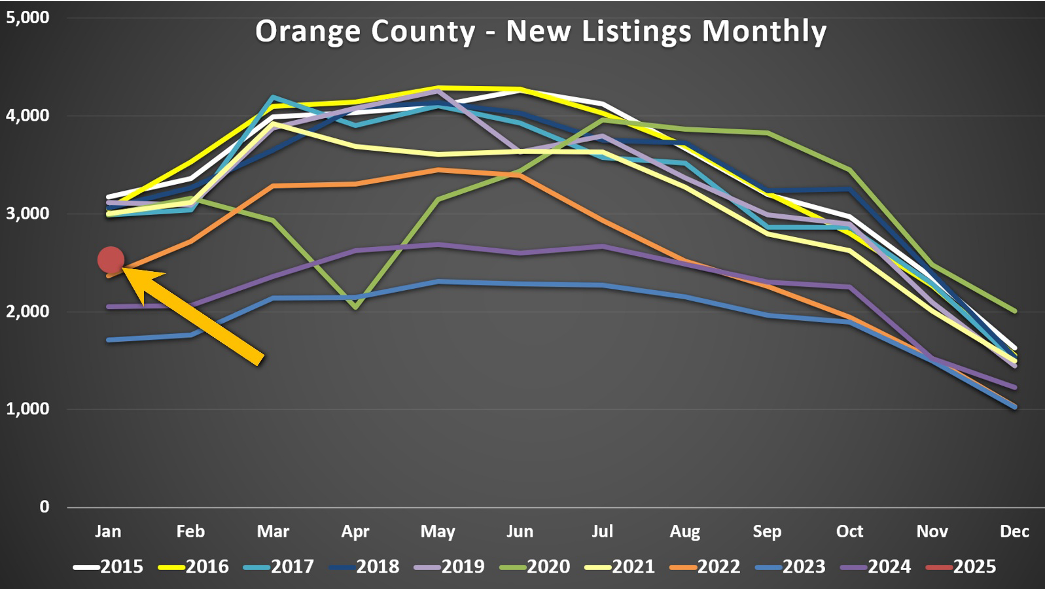
The hunkering-down trend occurred because homeowners were unwilling to move due to their low-fixed rate monthly payments. According to the Federal Housing Finance Agency’s National Mortgage Database, 82% of all Californians with a mortgage have a mortgage rate at or below 5% (2024 Q-3), 65% have a rate at or below 4%, and 29% have a rate at or below 3%. Many homeowners have been reluctant to sell their homes and exchange their low rates for today’s substantially higher mortgage rates. In 2023, there were 41% fewer FOR-SALE signs compared to the 3-year average before COVID (2017 to 2019), or over 16,000 missing signs. In 2024, there were 31% fewer sellers, 12,326 less. Yet, that was 3,697 extra signs compared to 2023. In January 2025, there were 2,527 new sellers, only 17% fewer than the 3-year average before COVID, 528 less. It was a 473 home improvement over January 2024, and 817 additional signs compared
to 2023.
More and more homeowners who have placed their desire to sell on hold as they wait for mortgage rates to ease have grown tired of waiting. It has been 30 months since mortgage rates were last under 6%. Everyone is realizing that the higher mortgage rate environment will not go anywhere anytime soon. This has resulted in more homeowners coming on the market compared to the last couple of years. As time progresses, even if rates remain elevated, the number of sellers coming on the market will normalize and return to prepandemic levels.
These extra sellers coming on the market have been matched with similar, low-demand levels that have not changed much in the last couple of years. When there are more sellers yet similar demand, the extra sellers accumulate, and the active inventory rises. Competition among sellers increases. That is precisely what occurred in 2024. The inventory peaked in September at 3,695 homes, 48% higher than the 2023 peak of 2,496. And, with more sellers coming on this year, the inventory will continue to increase rapidly as long as rates remain around 7% or higher.
The market time rises when a growing inventory is paired with low demand. That is precisely why the Orange County housing market is at its slowest mid-February level since 2019. The Expected Market Time (the number of days it takes to sell all Orange County listings at the current buying pace) is 61 days. It was at 42 days last year and 45 two years ago. The 3-year prepandemic average was 64 days, very similar to today. After reaching its lowest level within the next month, the Expected Market Time will rise weekly for the remainder of the year.
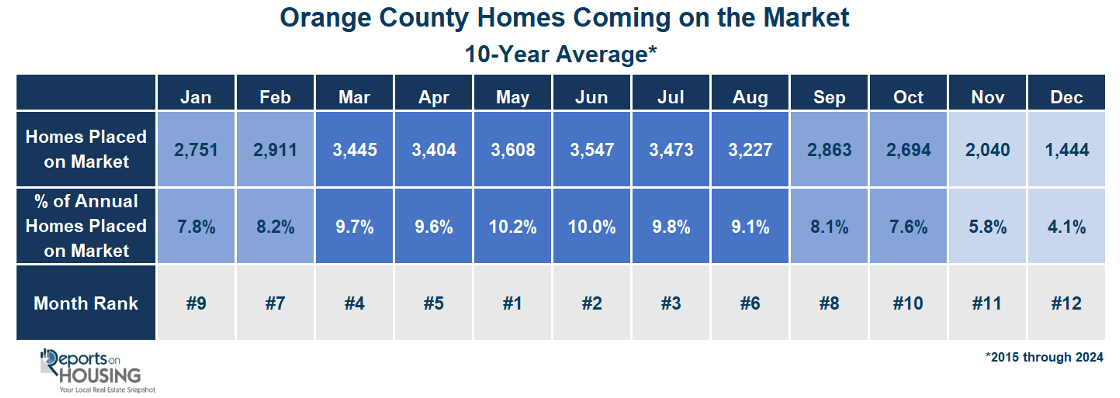
The housing market is about to enter the season when homes come on the market at a higher rate, from March through August, peaking in May. By mid-March, housing transitions to the Spring Market, the busiest time of the year for demand and the number of new sellers. The number of new sellers outpaces demand, so the inventory rises at a faster pace than in January and February. This is why the inventory builds throughout the Spring and Summer Markets and peaks between July and August. However, the peaks have been coming later over the past couple of years because the number of homes coming on the market has outpaced demand readings into the Autumn Market, which is abnormal.
The Bottom Line: The inventory will continue to build as more sellers opt to sell than in the past couple of years, and housing transitions to the Spring and Summer Markets, ultimately increasing seller competition and resulting in longer market times. More seller competition means sellers better be priced appropriately to secure a successful outcome. Many sellers will languish on the market without success. This is not a year to “test” the market and stretch the asking price. The best approach is to spend as much time as possible to secure a home’s Fair Market Value, carefully dissecting all recent comparable pending and closed sales and considering the condition, location, upgrades, and appeal.
Active Listings
The inventory jumped by 8% in the past couple of weeks.
The active listing inventory increased by 212 homes in the past two weeks, up 8%, and now sits at 3,033, its largest mid-February rise since 2017. Over the past couple of years, the inventory dropped in mid-February. The sharp rise is again due to more homes coming on the market than in the past couple of years, matched up against similar year-over-year demand levels. If rates remain elevated around 7% or higher, expect this phenomenon to continue and the inventory to reach prepandemic levels. There are finally a lot more choices for buyers. The inventory is at its highest mid-February level since 2020, five years ago. Expect the inventory to rise at a similar pace and then pick up steam next month as an elevated number of homes come on the market and housing transition to the spring.
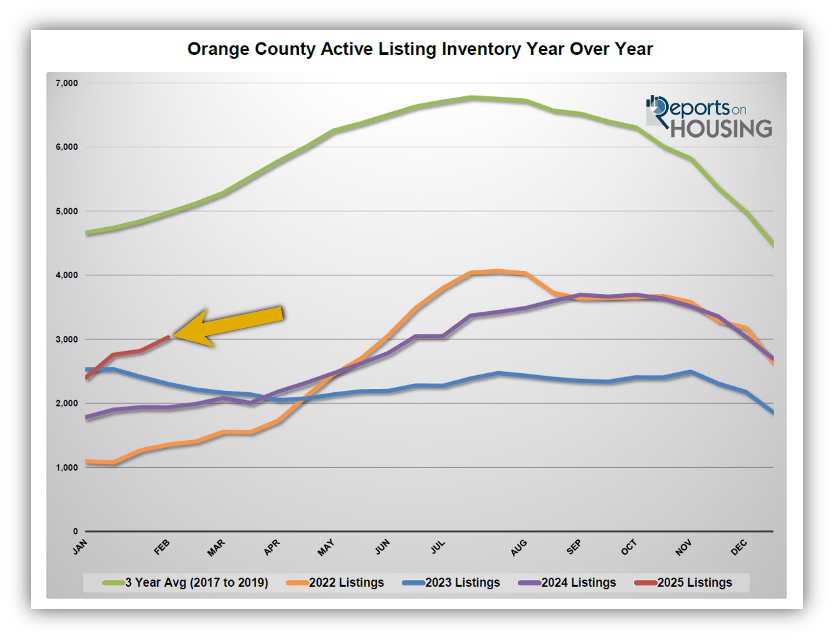
Last year, the inventory was at 1,939 homes, 36% lower, or 1,094 fewer. The 3-year average before COVID (2017 through 2019) was 4,977, an additional 1,944 homes, or 64% more.
Homeowners continue to “hunker down” in their homes, unwilling to move due to their current underlying, locked-in, low fixed-rate mortgage. It became a crisis once rates skyrocketed higher in 2022. For January, 2,527 new sellers entered the market in Orange County, 528 fewer than the 3-year average before COVID (2017 to 2019), 17% less. Last January, there were 2,054 new sellers, 19% fewer than this year. More sellers are opting to sell compared to the previous couple of years.
Demand
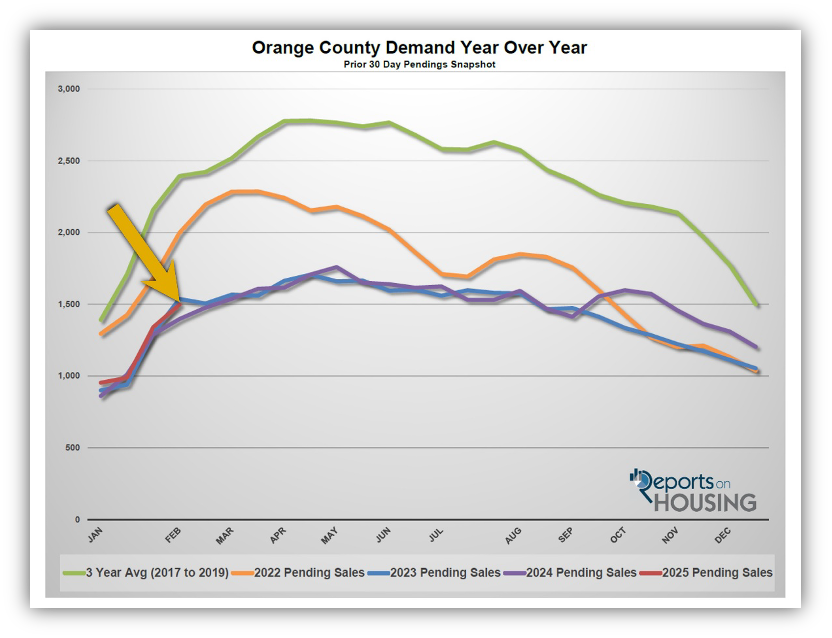
Demand surged higher by 12% in the past couple of weeks.
Demand, a snapshot of the number of new pending sales over the prior month, surged from 1,340 to 1,497 in the past couple of weeks, up 157 pending sales, or 12%, its highest level since October. As is typical for the Winter Market, demand explodes onto the scene starting in mid-January. It skyrockets higher through mid-February and then slowly grows until it peaks between April and May. Yet, demand is at its lowest level for this time of the year since tracking began in 2004, only behind last year’s 1,397 pending sales. It has remained subdued despite the much higher active inventory. With a higher supply and similar low demand, the overall market has felt much more sluggish than in the past couple of years. This is the slowest mid-February market since 2020. Demand will remain muted and stuck to these lower levels, similar to 2023 and 2024, as long as rates remain close to 7% or higher.
As the Federal Reserve has indicated, watching all economic releases for signs of slowing is essential. That is the only path to lower mortgage rates right now. These releases can move mortgage rates higher or lower, depending on how they compare to market expectations. This week, the Manufacturing Purchasing Managers’ Index (PMI) will be released on Friday, illustrating the strength of manufacturing goods. Next week, the Personal Consumption Expenditures – Price Index (PCE), the Fed’s preferred inflation gauge, will be released on Friday.
Last year, demand was 1,397, with 100 fewer pending sales or 7% less. The 3-year average before COVID (2017 to 2019) was 2,393 pending sales, 60% more than today, or an additional 896.
With demand rising faster than supply, the Expected Market Time (the number of days it takes to sell all Orange County listings at the current buying pace) decreased from 63 to 61 days in the past couple of weeks. Last year, it was 42 days, noticeably faster than today. The 3-year average before COVID was 64 days, similar to today.
Luxury End
The luxury market has improved substantially in the past couple of weeks.
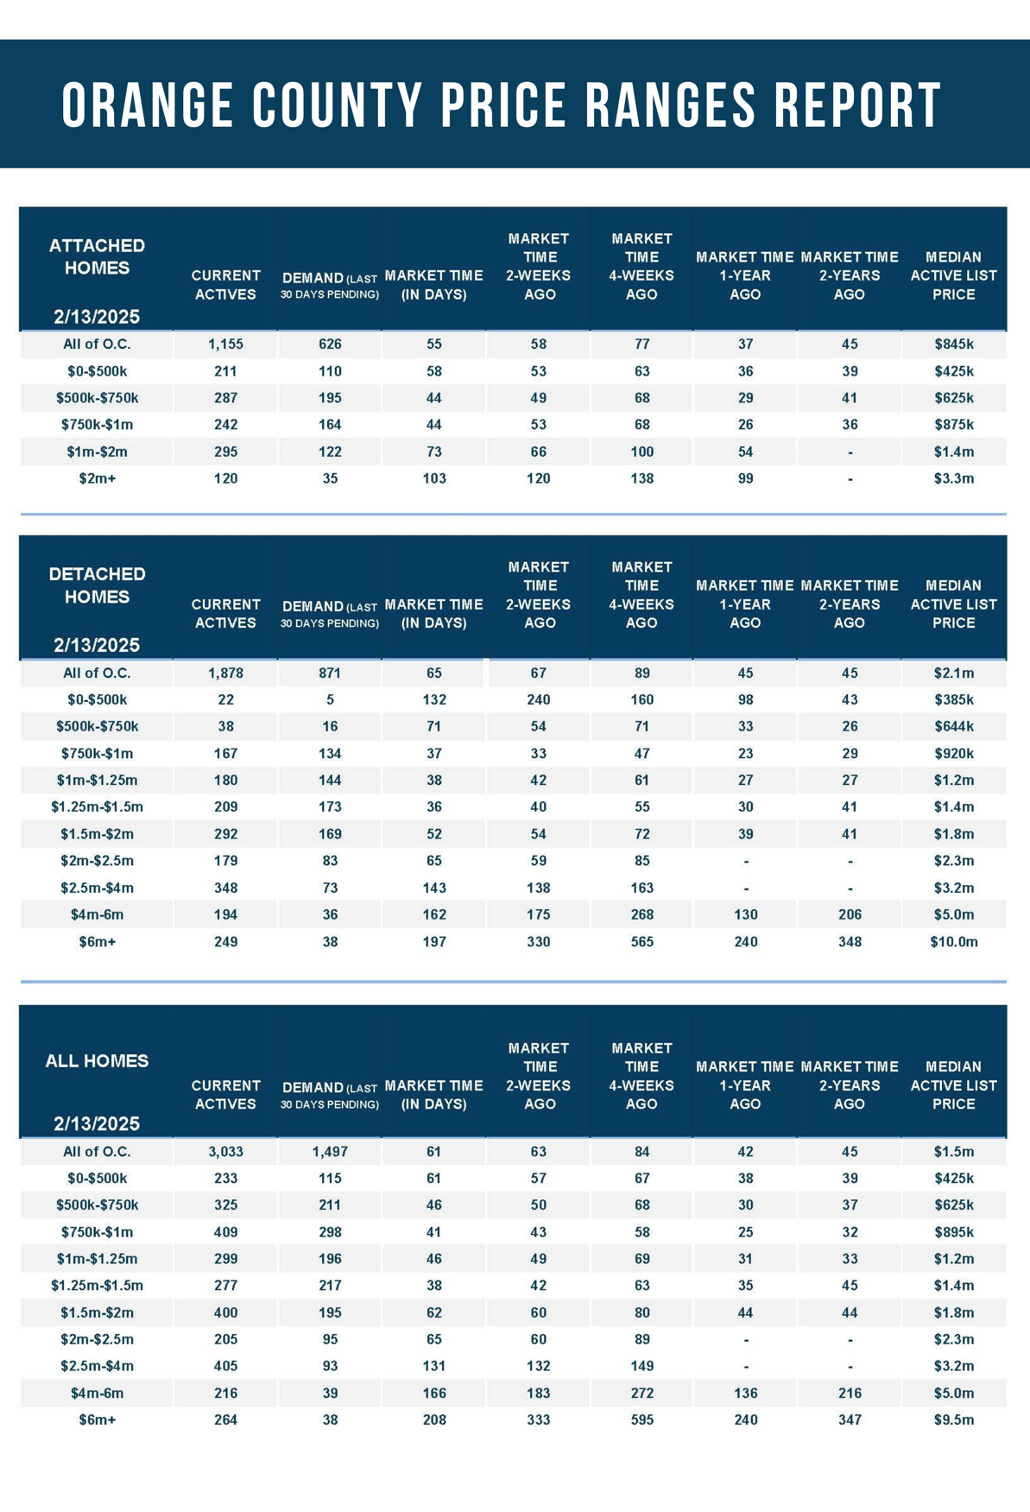
The luxury inventory of homes priced above $2.5 million (the top 10% of the Orange County housing market) increased from 829 to 856 homes, up 56 or 7%. Luxury demand increased by 30 pending sales, up 21%, and now sits at 170. The Expected Market Time for luxury homes priced above $2.5 million decreased from 178 to 156 days, shedding 22 days. Higher rates translate to choppier trading on Wall Street, which slows luxury. Expect luxury to hit its hottest level within the next four weeks and then slow from there. The year’s second half is notoriously slower than the first half for the luxury market. Last year, it was substantially slower during the second half.
In the past two weeks, the Expected Market Time for homes priced between $2.5 million and $4 million decreased from 132 to 112 days. For homes priced between $4 million and $6 million, the Expected Market Time decreased from 183 to 166 days. For homes priced above $6 million, the Expected Market Time decreased from 333 to 208 days. At 208 days, a seller would be looking at placing their home into escrow around September 2025.
Orange County Housing Summary
- The active listing inventory in the past couple of weeks increased by 212 homes, up 8%, and now sits at 3,033. In January, 17% fewer homes came on the market compared to the 3-year average before COVID (2017 to 2019), 528 less. Yet, 473 more sellers came on the market this January compared to January 2024. Last year, there were 1,939 homes on the market, 1,094 fewer homes, or 36% less. The 3-year average before COVID (2017 to 2019) was 4,977, or 64% extra.
- Demand, the number of pending sales over the prior month, surged by 157 pending sales in the past two weeks, up 12%, and now totals 1,497, its highest level since October. Last year, there were 1,397 pending sales, 7% less. The 3-year average before COVID (2017 to 2019) was 2,393, or 60% more.
- With demand rising faster than supply, the Expected Market Time, the number of days to sell all Orange County listings at the current buying pace, decreased from 63 to 61 days in the past couple of weeks. Last year, it was 42 days, noticeably faster than today. The 3-year average before COVID (2017 to 2019) was 64 days, similar to today.
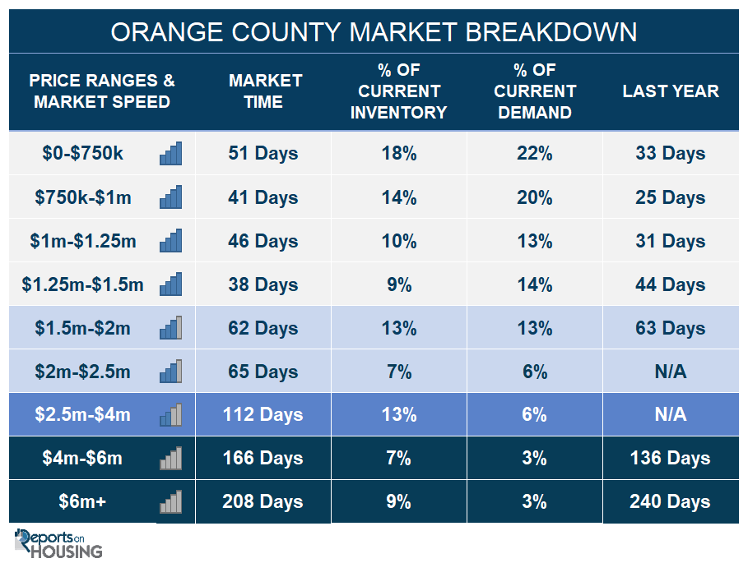
- In the past two weeks, the Expected Market Time for homes priced below $750,000 decreased from 52 to 51 days. This range represents 18% of the active inventory and 22% of demand.
- The Expected Market Time for homes priced between $750,000 and $1 million decreased from 43 to 41 days. This range represents 14% of the active inventory and 20% of demand.
- The Expected Market Time for homes priced between $1 million and $1.25 million decreased from 49 to 46 days. This range represents 10% of the active inventory and 13% of demand.
- The Expected Market Time for homes priced between $1.25 million and $1.5 million decreased from 42 to 38 days. This range represents 9% of the active inventory and 14% of demand.
- The Expected Market Time for homes priced between $1.5 million and $2 million increased from 60 to 62 days. This range represents 13% of the active inventory and 13% of demand.
- The Expected Market Time for homes priced between $2 million and $2.5 million increased from 60 to 65 days. This range represents 6% of the active inventory and 7% of demand.
- In the past two weeks, the Expected Market Time for homes priced between $2.5 million and $4 million decreased from 132 to 112 days. For homes priced between $4 million and $6 million, the Expected Market Time decreased from 183 to 166 days. For homes priced above $6 million, the Expected Market Time decreased from 333 to 208 days.
- The luxury end, all homes above $2 million, account for 29% of the inventory and 12% of demand.
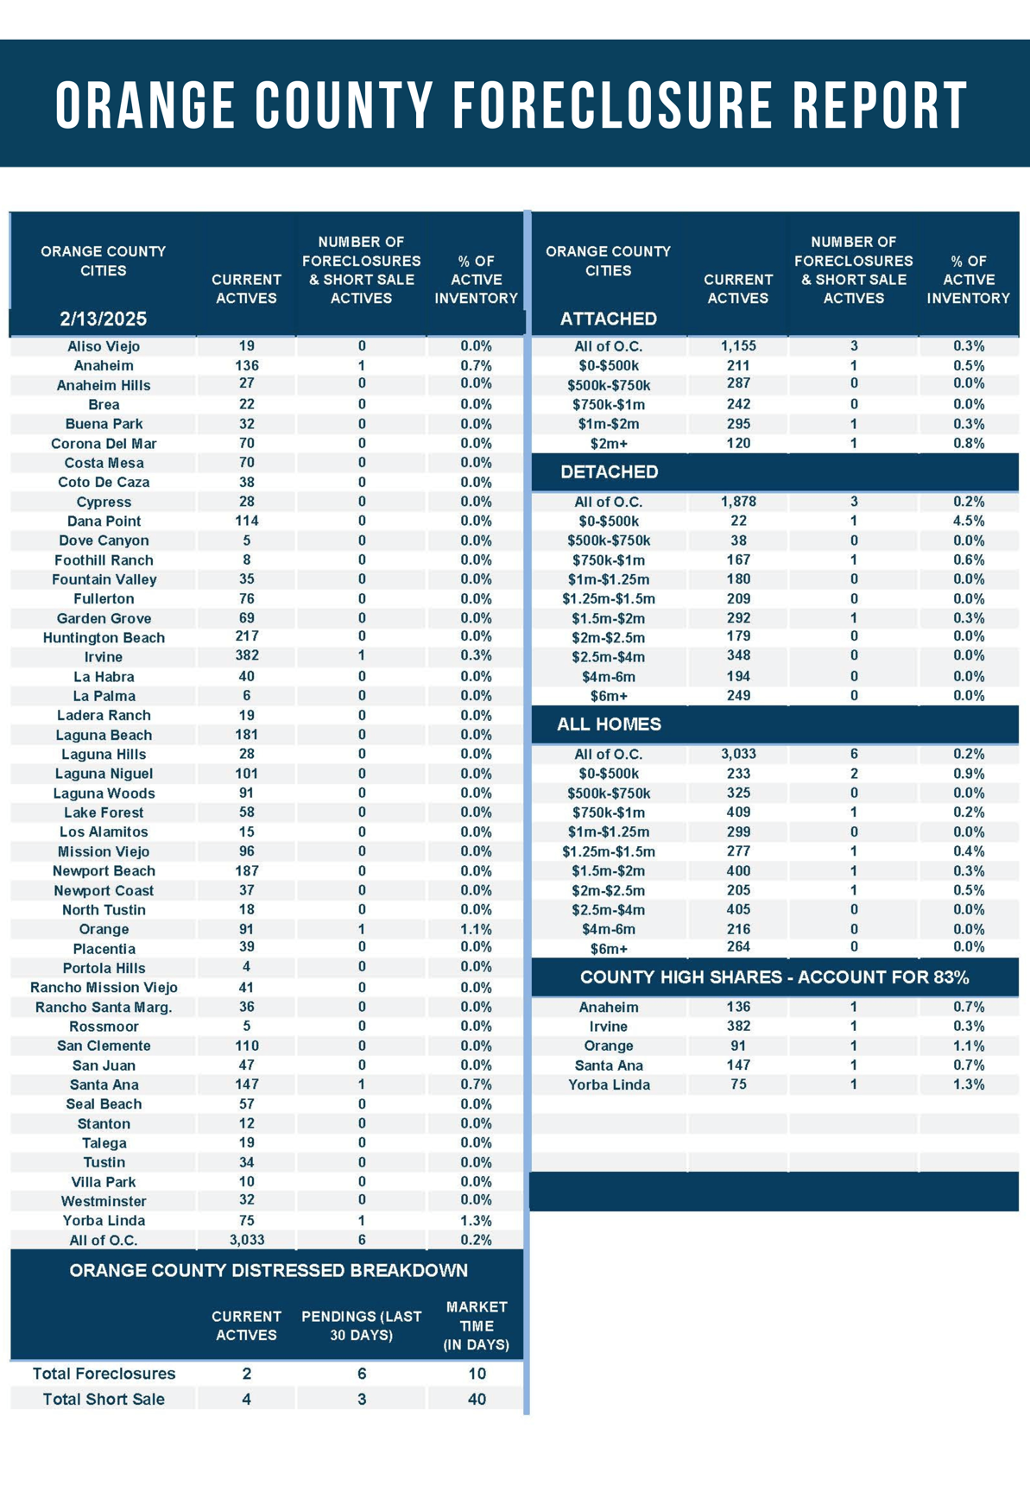
- Distressed homes, both short sales and foreclosures combined, comprised only 0.2% of all listings and 0.6% of demand. Only four foreclosures and two short sales are available today in Orange County, with six total distressed homes on the active market, up two from two weeks ago. Last year, nine distressed homes were on the market, similar to today.
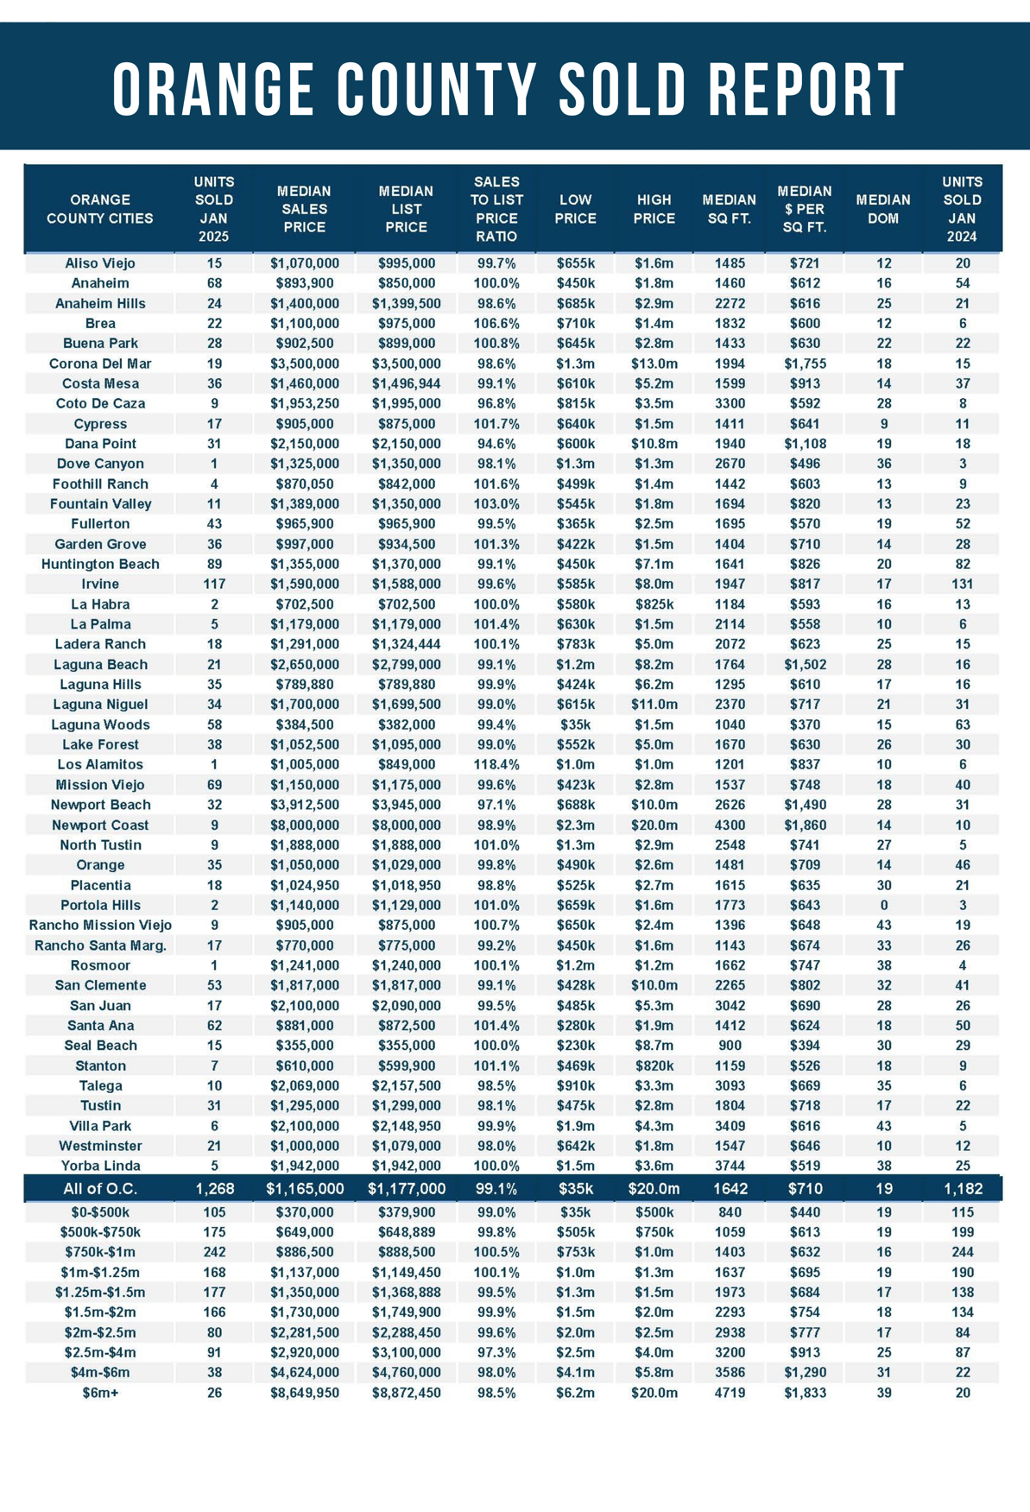
- There were 1,268 closed residential resales in January, up 7% compared to January 2024’s 1,182 and down 22% from December 2024. The sales-to-list price ratio was 99.14% for Orange County. Short sales accounted for 0.1% of all closed sales, and there were no foreclosures. That means that 99.9% of all sales were good ol’ fashioned sellers with equity.
Have a great week.
Sincerely,
Steven Thomas
Quantitative Economics and Decision Sciences
Copyright 2025—Steven Thomas, Reports On Housing—All Rights Reserved. This report may not be reproduced in whole or in part without express written permission from the author.