January 20, 2025
The Orange County housing market experienced a substantial slowdown that is unusual for this time of the year.
Unexpected Slowdown
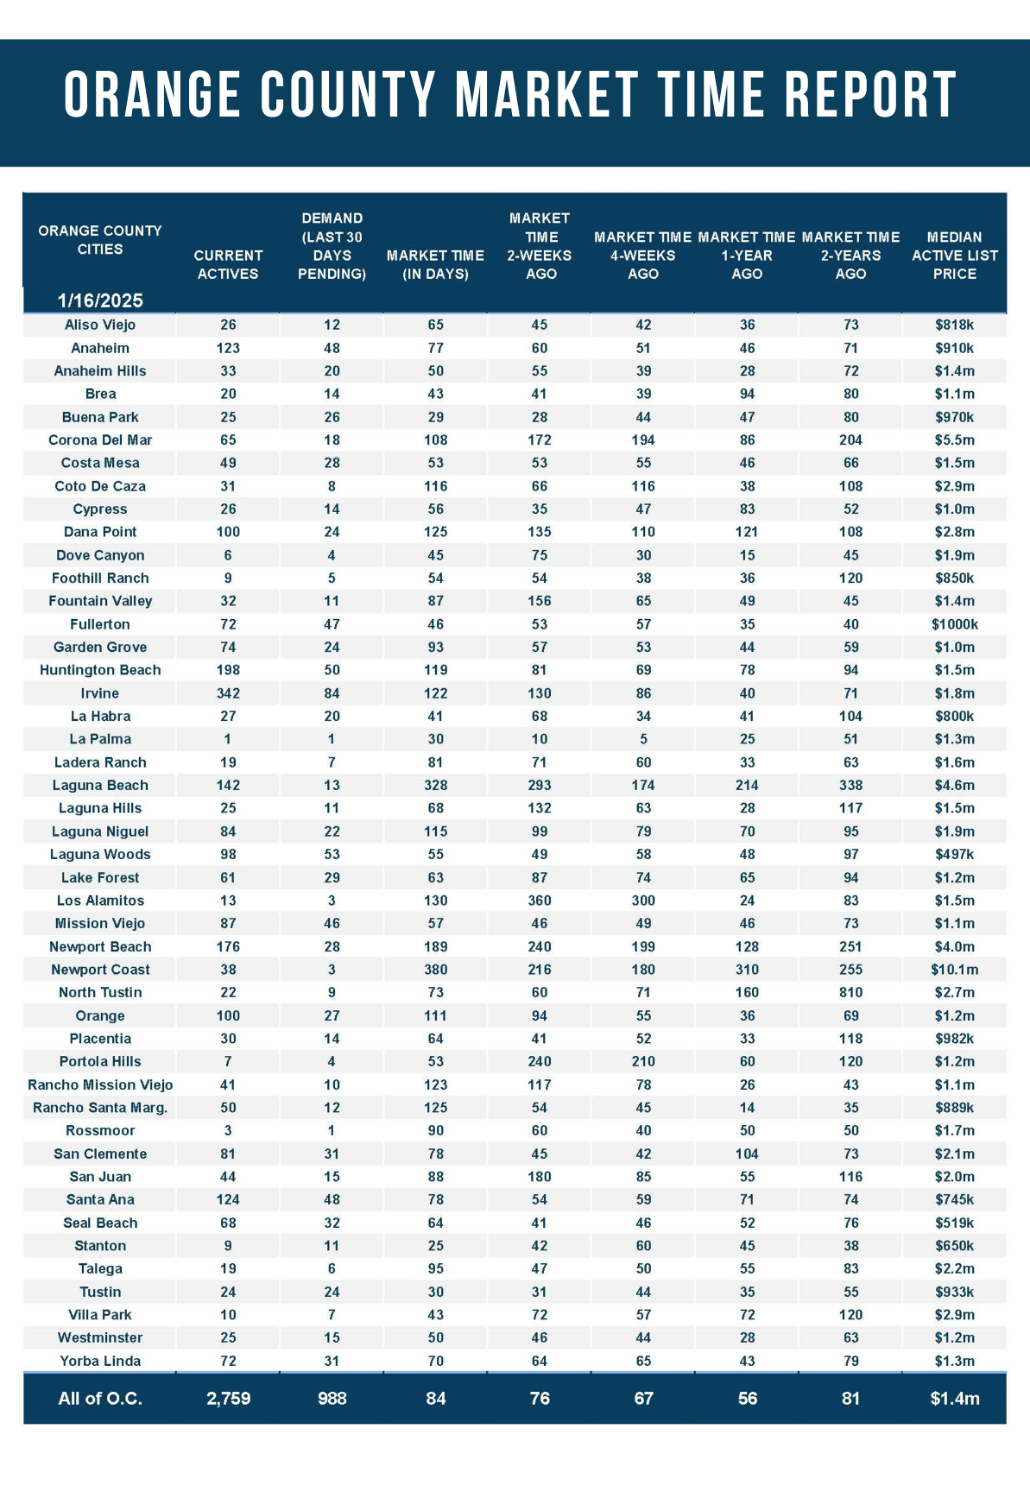
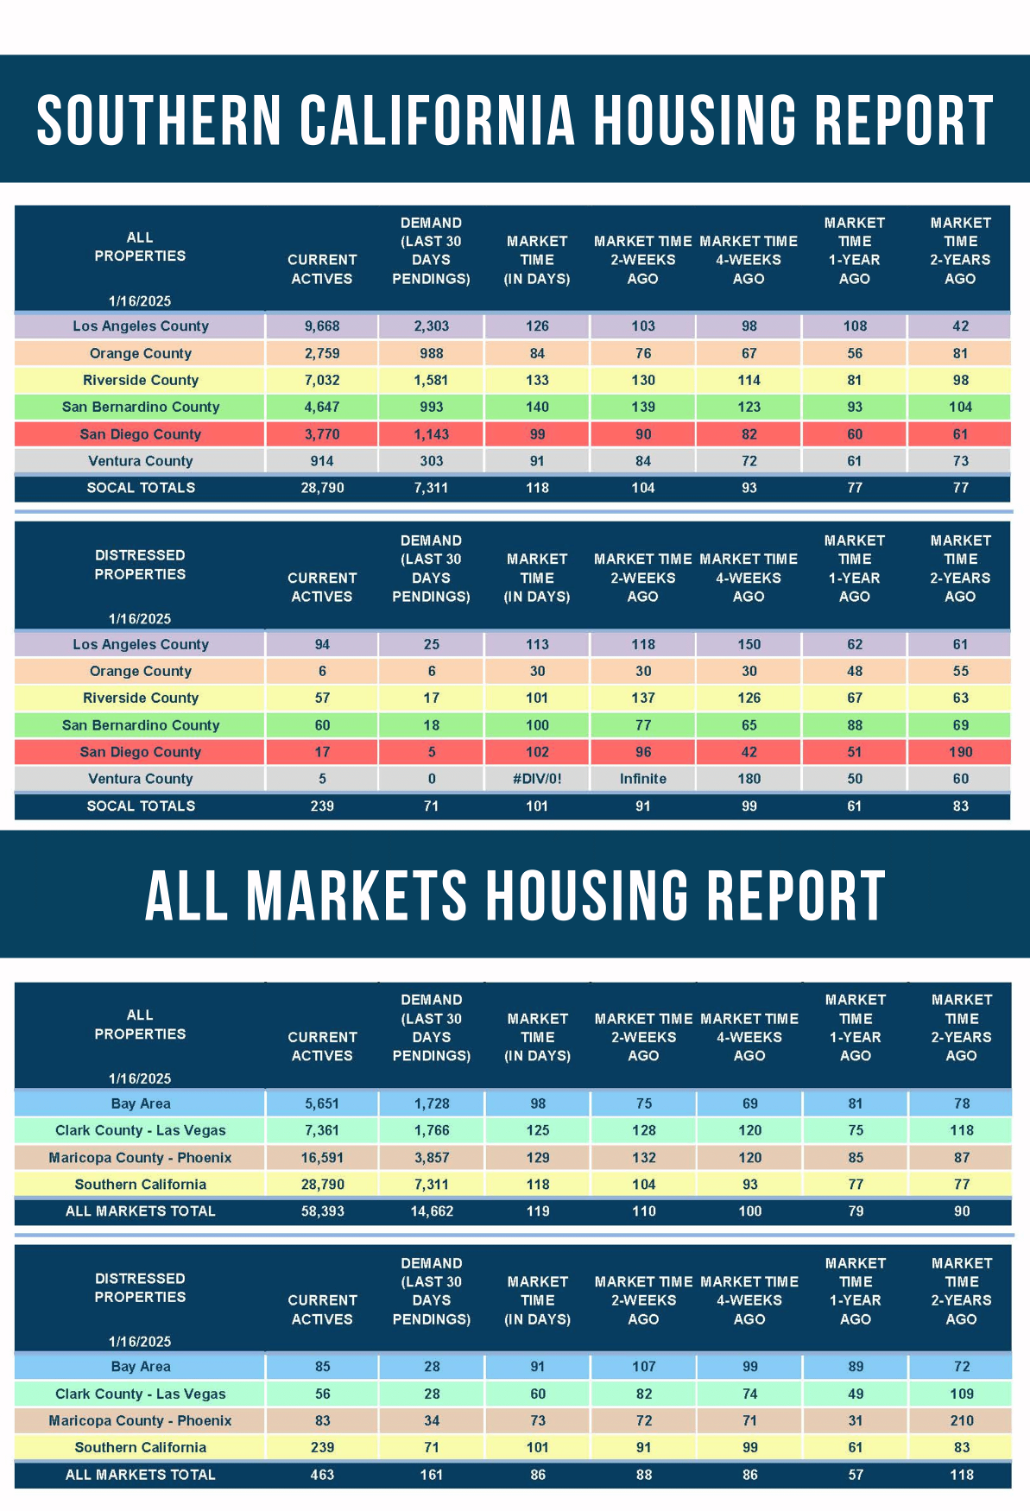
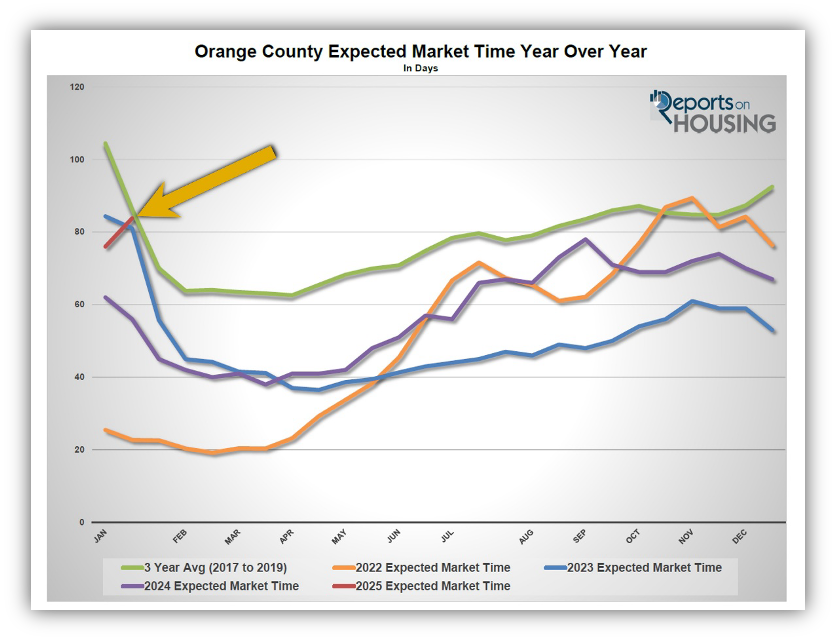
The Expected Market Time jumped from 76 to 84 days in the past couple of weeks.
It is a beautiful Saturday morning with the sun shining brightly, not a cloud in sight. The family heads out to seize the day and enjoy time together. After a few errands and a quick bite to eat, playing at the park seems like an excellent idea. The whole family is on board. While pushing the kids on the swings, thick dark clouds rapidly make their way across the sky, and it suddenly begins to rain. The rain turns into a downpour. Nobody had an umbrella or even thought for a moment to grab one; after all, it was the perfect sunny day.
That is precisely how the housing market developed in the past couple of weeks. Typically, from the start of the year to mid-January, housing heats up, and the Expected Market Time (the number of days it takes to sell all Orange County listings at the current buying pace) starts to drop. This is due to the inventory slowly rising and demand beginning to surge higher. Yet, within the past couple of weeks, the inventory jumped higher, demand rose slightly, and the Expected Market Time surged higher. It is an unexpected development and very unusual market movement.
In the past two weeks, the Expected Market Time grew from 76 to 84 days, adding 8 days, or more than a week, to the market time. Last year, it fell from 62 to 56 days. The 28-day year-over-year difference is very noticeable within the marketplace. Since 2004, the Expected Market Time has increased only one time before. In 2014, it rose from 95 to 98 days. From 2012 through 2020, the average drop was 10 days. The considerable rise within the last couple of weeks is unprecedented.
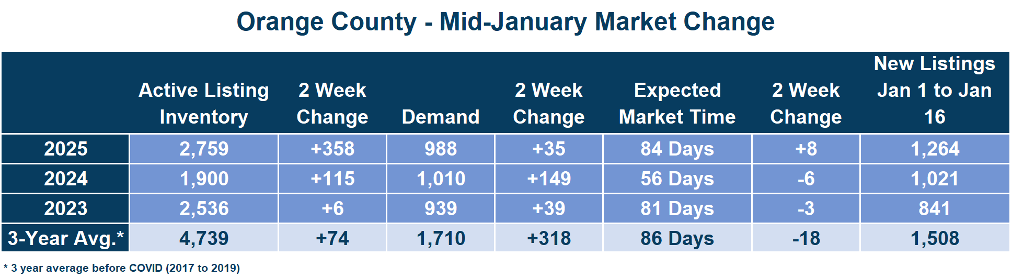
To better understand the bizarre market movement, it is best to break down the components that comprise the Expected Market Time, supply and demand. On the supply side of the equation, the number of available homes to purchase climbed from 2,401 to 2,759 homes in the past couple of weeks, an increase of 358, up 15%. That is the largest rise at this time of the year since 2010. Compare that to last year’s rise of 115 homes or 6% from 1,785 to 1,900, or 2023’s rise from 2,530 to 2,536, up six homes or nearly unchanged.
The best explanation for the significant rise in the inventory is that the “hunkering down” trend has been fading. Homeowners have been hunkering in their homes and are unwilling to move due to their current underlying, locked-in, low fixed-rate mortgage. It became a crisis once rates skyrocketed higher in 2022. The fewest number of homes came on the market in 2023. In January 2023, 44% fewer homes were placed on the market than the 3-year average before COVID (2017 to 2019). In 2024, there were 33% fewer new FOR SALE signs. In 2025, through today, there were 16% fewer signs. Homeowners are getting tired of waiting for rates to fall. It has been 29 months, since August 2022, when rates were last under 6%. An additional 243 homes were placed on the market this year compared to the first 16 days last year and an extra 423 compared to 2023. These extra homes on the market are matched against similar year over year demand. They are accumulating on the market and are the main reason for the unexpected climb in the inventory.
Even though 45% more homes are on the market this year compared to 2024, an extra 859, it is not translating to an increase in pending sales. The culprit: the higher mortgage rate environment. 30-year mortgage rates have been stuck above 7% since Jerome Powell and the Federal Reserve cut the short-term Federal Funds rate (an overnight banking rate) by a quarter percentage point on December 18th. According to Mortgage News Daily, as of January 16th, mortgage rates are 7.07%. They were at 6.89% last year and 6.15% in 2023. When rates surpass the psychological 7% barrier, the inventory grows. These higher rates prevent many buyers from pursuing a home.
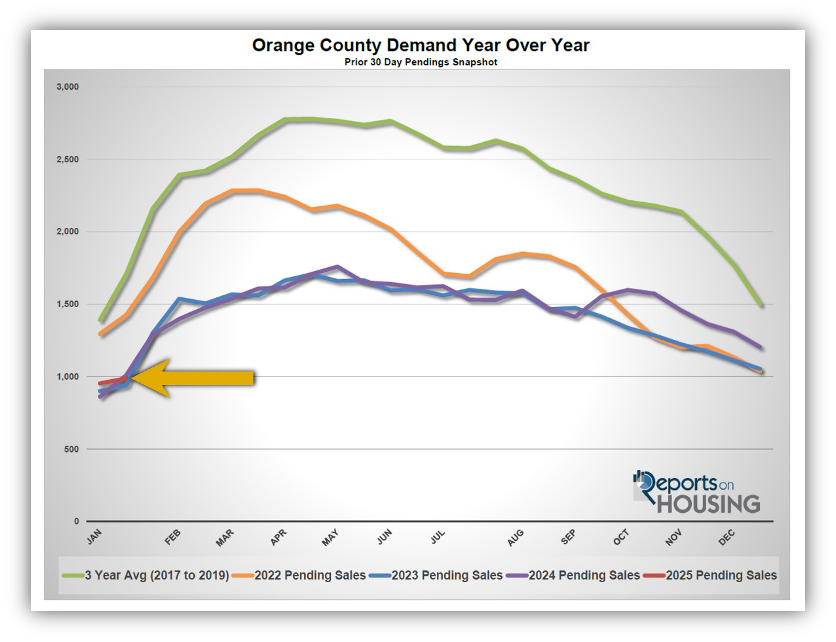
Demand (a snapshot of the number of new pending sales over the prior month) climbed from 953 to 988 pending sales in the past couple of weeks, up 35 or 4%. Last year, it rose from 861 to 1,010, up 149 or 17%. In 2023, it only increased by 39 pending sales, from 900 to 939, up 4%. The 3-year average before COVID was an increase of 318 or 23%. Today’s demand is not growing much, and it is all due to higher mortgage rates and higher prices. Affordability is a huge issue when rates remain high.
Over the next four weeks, demand is expected to climb rapidly as the market transitions to the Winter Market, now through mid-March. Yet, as the last two weeks’ trend has established, it is also imperative to expect more homes to come on the market and accumulate and the inventory to rise. The Expected Market Time should drop, but not as sharply as is customary due to the added inventory. Plan accordingly. There is bizarre market movement.
Active Listings
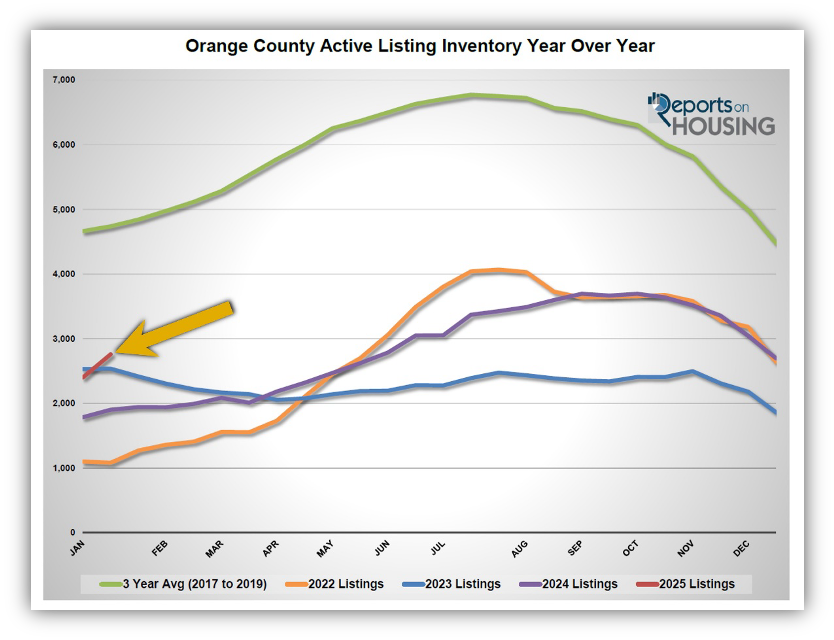
The inventory skyrocketed by 15% in the past couple of weeks.
The active listing inventory increased by 358 homes in the past two weeks, up 15%, and now sits at 2,759. It was the most significant two-week rise since June 2022. This sharp rise was unexpected and not typical for this time of year. The inventory is at its highest mid-January level since 2020. There are finally more choices for buyers. As long as rates remain elevated and above 7% with duration, the inventory will continue to rise at a sharper pace than usual. The issue is affordability. Higher rates place a damper on demand. With fewer pending sales, the inventory climbs at a faster pace.
Last year, the inventory was at 1,900 homes, 31% lower, or 859 fewer. The 3-year average before COVID (2017 through 2019) was 4,739, an additional 1,980 homes, or 72% more.
Homeowners continue to “hunker down” in their homes, unwilling to move due to their current underlying, locked-in, low fixed-rate mortgage. For December, 1,198 new sellers entered the market in Orange County, 296 fewer than the 3-year average before COVID (2017 to 2019), 20% less. Last December, there were 1,023 new sellers, 15% fewer than this year. More sellers are opting to sell compared to the previous year.
Demand
Demand grew by 4% in the past couple of weeks.
Demand, a snapshot of the number of new pending sales over the prior month, increased from 953 to 988 in the past couple of weeks, up 35 pending sales, or 4%. It was the lowest two-week mid-January rise since tracking began in 2004. The 3-year average climb before COVID (2017 to 2019) was 318. The much higher active listing inventory is not translating to additional pending sales. Buyers are very interest rate sensitive, and many climb onto the fence when rates rise above 7%, which is a significant psychological barrier. Mortgage rates have been very volatile ever since the Federal Reserve increased rates 11 times from March 2022 through July 2023. They were at 6.11% back in September, but have been stuck above 7% since December 18th, the last time the Federal Reserve met and indicated that they would not be cutting as many times in 2025 as they originally had anticipated. Rates will ultimately dictate the strength of the housing market this year.
As the Federal Reserve has indicated, watching all economic releases for signs of slowing is essential. That is the only path to lower mortgage rates right now. These releases can move mortgage rates higher or lower, depending on how they compare to market expectations. This week is the release of the S&P Global Manufacturing and Services PMI on Friday. Next week, the Federal Reserve meets and will conduct a news conference on Wednesday, ultimately revealing their appetite to cut rates in the near future, a crucial day for mortgage rates.
Last year, demand was 1,010, with 22 additional pending sales or 2% more. The 3-year average before COVID (2017 to 2019) was 1,710 pending sales, 73% more than today, or an additional 722.
With inventory climbing substantially faster than demand, the Expected Market Time (the number of days it takes to sell all Orange County listings at the current buying pace) increased from 76 to 84 days in the past couple of weeks. Last year, it was 56 days, noticeably faster than today. The 3-year average before COVID was 86 days, similar to today.
Luxury End
A new benchmark has been reached for luxury in Orange County.
There has been a big change in Orange County’s luxury home market. Luxury is defined as the top 10% of an area. The high end has surged higher since COVID. Luxury has been a disproportionate number of home sales, and values have continued to rise. Consequently, the threshold for luxury changed from $2 million to $2.5 million. From this point forward, luxury will now be defined as $2.5 million and greater for Orange County.
The luxury inventory of homes priced above $2.5 million is at 737 homes. Luxury demand is at 97 pending sales. The Expected Market Time for luxury homes priced above $2.5 million is 228 days. The luxury market will improve extensively over the next couple of months.
The Expected Market Time for homes priced between $2.5 million and $4 million is 149 days. In the past two weeks, for homes priced between $4 million and $6 million, the Expected Market Time increased from 216 to 272 days. For homes priced above $6 million, the Expected Market Time increased from 294 to 595 days. At 595 days, a seller would be looking at placing their home into escrow around September 2026.
Orange County Housing Summary
- The active listing inventory in the past couple of weeks surged higher by 358 homes, up 15%, and now sits at 2,759, its highest mid-January level since 2020. In December, 20% fewer homes came on the market compared to the 3-year average before COVID (2017 to 2019), 296 less. Yet, 175 more sellers came on the market this December compared to December 2023. Last year, there were 1,900 homes on the market, 859 fewer homes, or 31% less. The 3-year average before COVID (2017 to 2019) was 4,739, or 72% extra.
- Demand, the number of pending sales over the prior month, increased by 35 pending sales in the past two weeks, up 4%, and now totals 988, its second lowest level for mid-January since tracking began in 2004, only behind 2023’s 939. Last year, there were 1,010 pending sales, 2% more. The 3-year average before COVID (2017 to 2019) was 1,710, or 73% more.
- With the inventory surging higher compared to the slight rise in demand, the Expected Market Time, the number of days to sell all Orange County listings at the current buying pace, increased from 76 to 84 days in the past couple of weeks. Last year, it was 56 days, noticeably faster than today. The 3-year average before COVID (2017 to 2019) was 86 days, similar to today.
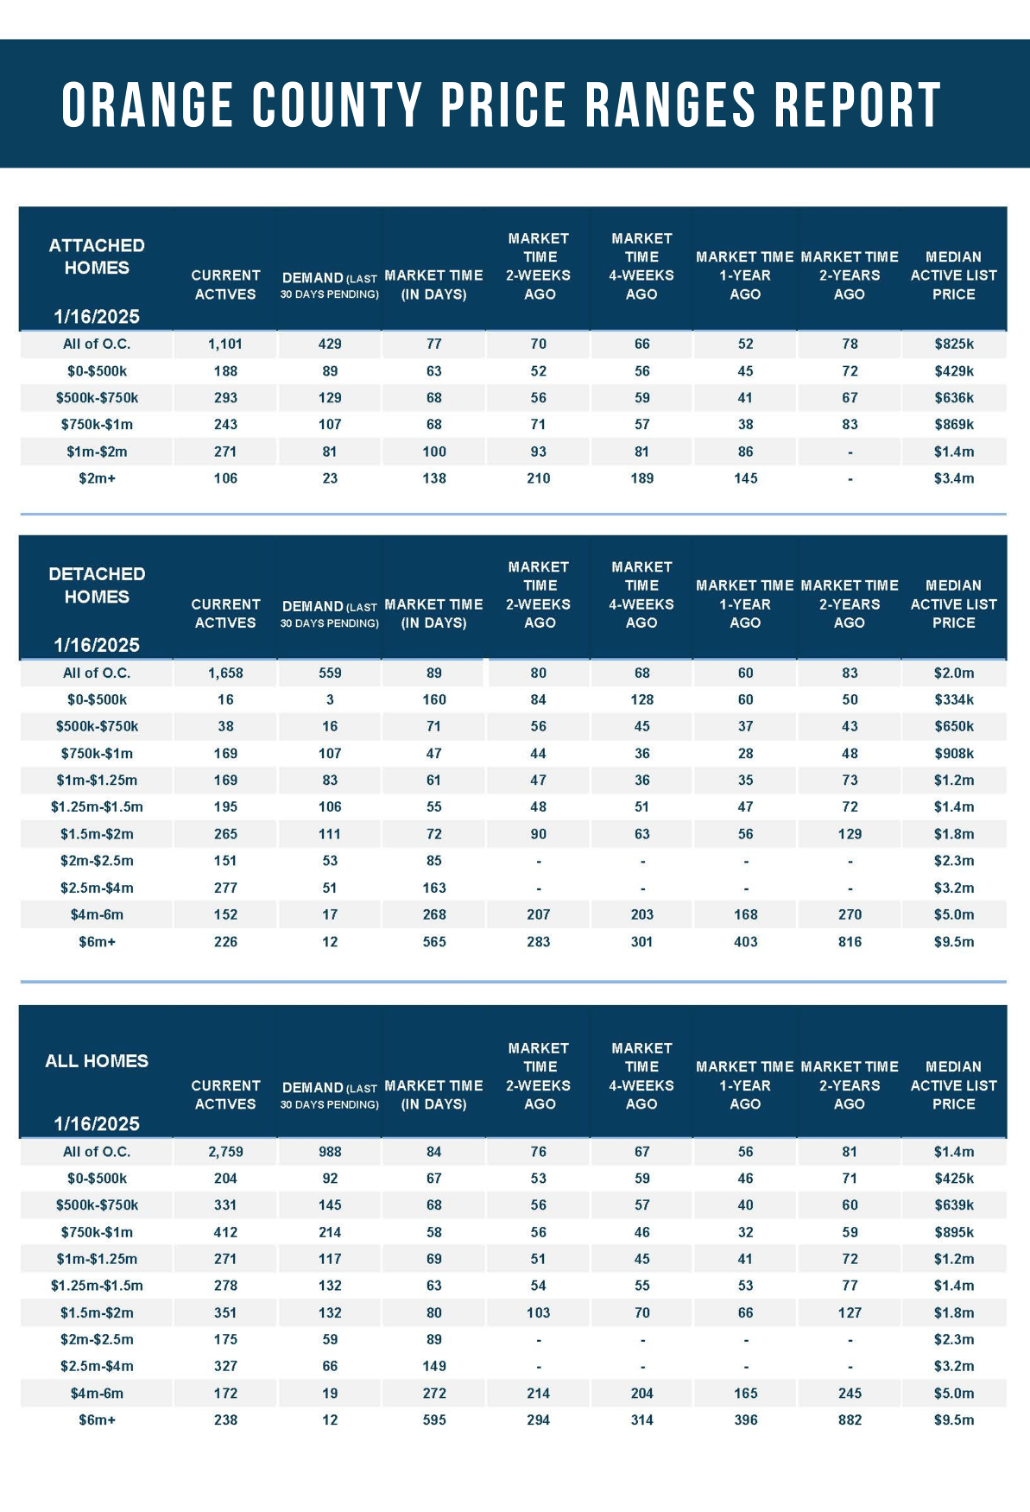
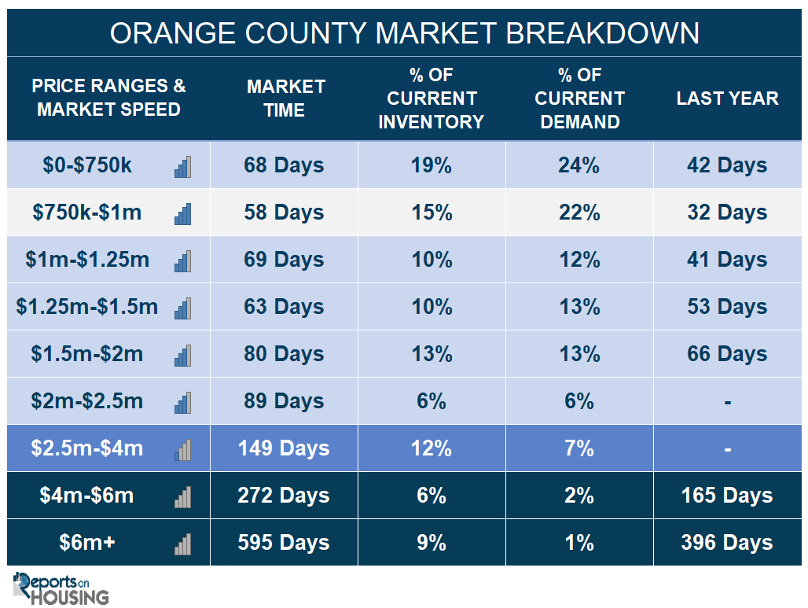
- In the past two weeks, the Expected Market Time for homes priced below $750,000 increased from 55 to 68 days. This range represents 19% of the active inventory and 24% of demand.
- The Expected Market Time for homes priced between $750,000 and $1 million increased from 56 to 58 days. This range represents 15% of the active inventory and 22% of demand.
- The Expected Market Time for homes priced between $1 million and $1.25 million increased from 51 to 69 days. This range represents 10% of the active inventory and 12% of demand.
- The Expected Market Time for homes priced between $1.25 million and $1.5 million increased from 54 to 63 days. This range represents 10% of the active inventory and 13% of demand.
- The Expected Market Time for homes priced between $1.5 million and $2 million decreased from 103 to 80 days. This range represents 13% of the active inventory and 13% of demand.
- The Expected Market Time for homes priced between $2 million and $2.5 million is 89 days. This range represents 6% of the active inventory and 6% of demand.
- The Expected Market Time for homes priced between $2.5 million and $4 million is 149 days. In the past two weeks, for homes priced between $4 million and $6 million, the Expected Market Time increased from 216 to 272 days. For homes priced above $6 million, the Expected Market Time increased from 294 to 595 days.
- The luxury end, all homes above $2 million, account for 27% of the inventory and 10% of demand.
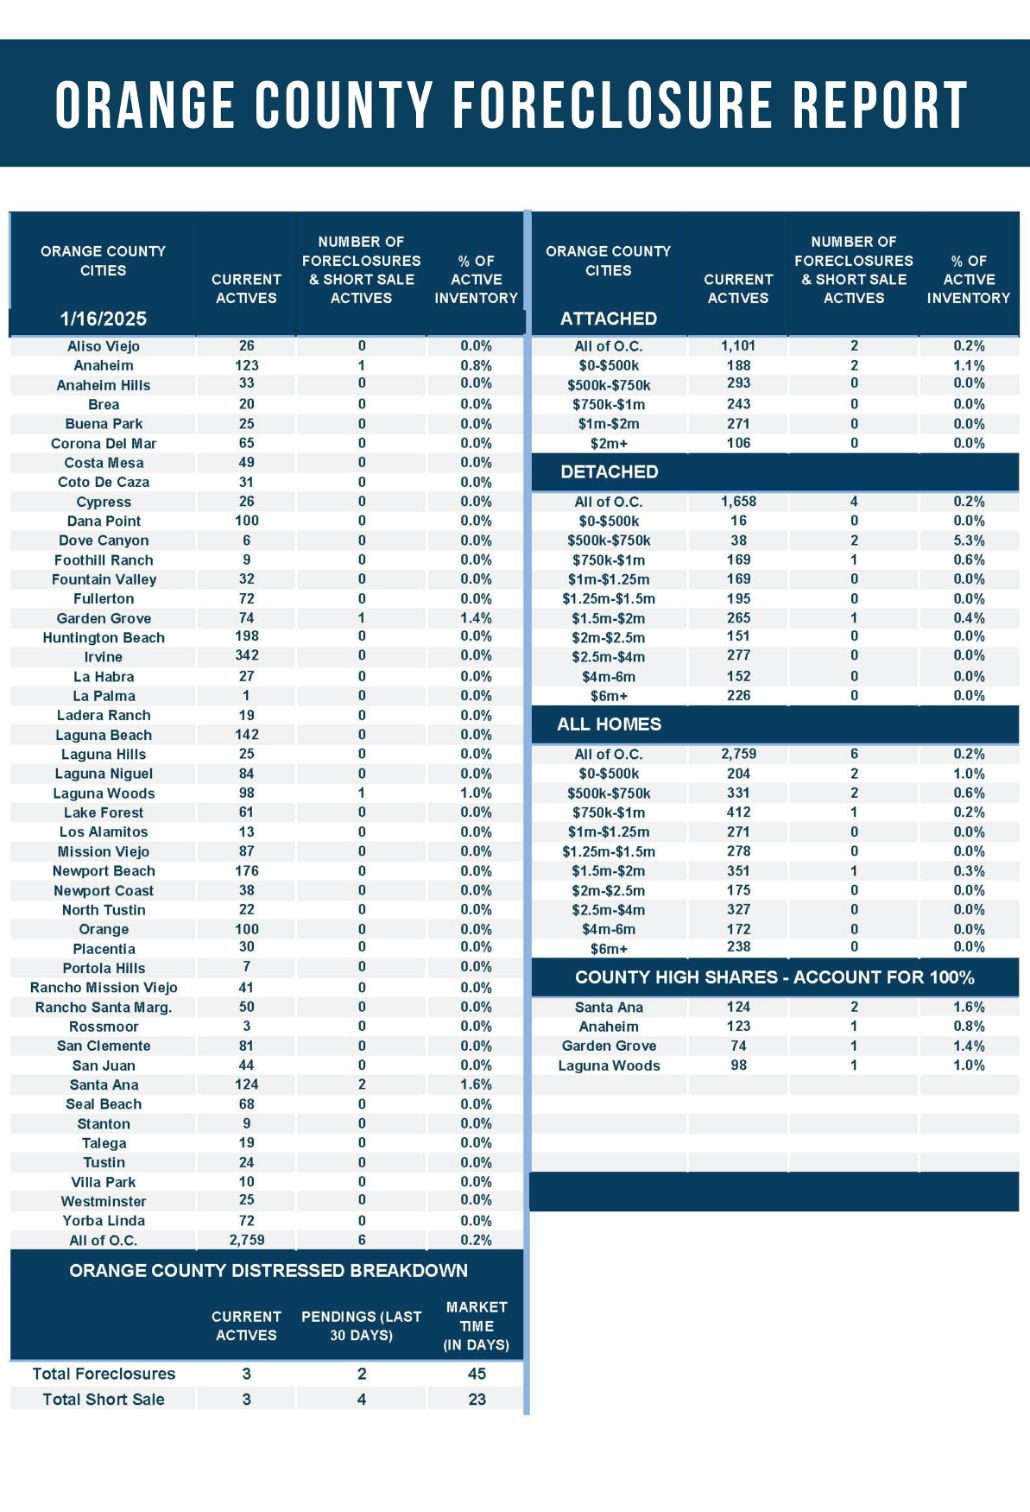
- Distressed homes, both short sales and foreclosures combined, comprised only 0.2% of all listings and 0.6% of demand. Only three foreclosures and three short sales are available today in Orange County, with six total distressed homes on the active market, unchanged from two weeks ago. Last year, eight distressed homes were on the market, similar to today.
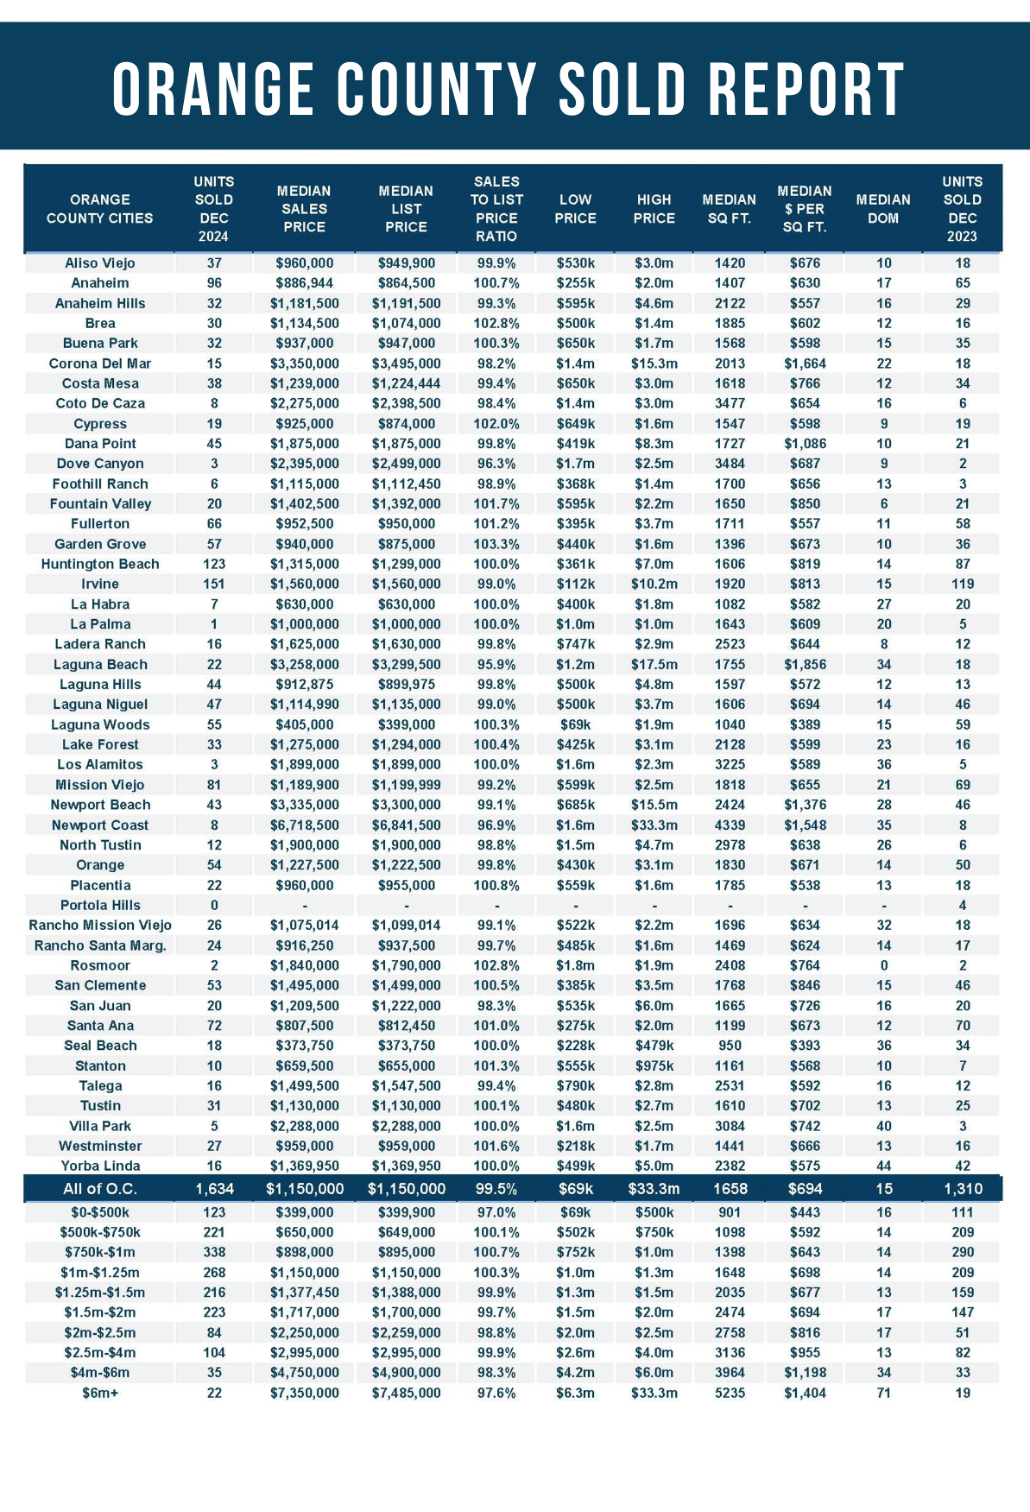
- There were 1,634 closed residential resales in December, up 25% compared to December 2023’s 1,310 and up 3% from November 2024. The sales-to-list price ratio was 99.5% for Orange County. Foreclosures accounted for 0.1% of all closed sales, and there were no short sales. That means that 99.9% of all sales were good ol’ fashioned sellers with equity.
Have a great week.
Sincerely,
Steven Thomas
Quantitative Economics and Decision Sciences
Copyright 2025—Steven Thomas, Reports On Housing—All Rights Reserved. This report may not be reproduced in whole or in part without express written permission from the author.