December 23, 2023
HAPPY NEW YEAR!!! Now, what does that mean for Orange County real estate?
First, let us look back at what happened in 2024 in terms of inventory, demand, luxury properties, and the Expected Market Time.
Active Inventory
The inventory climbed all year until its late peak in September.
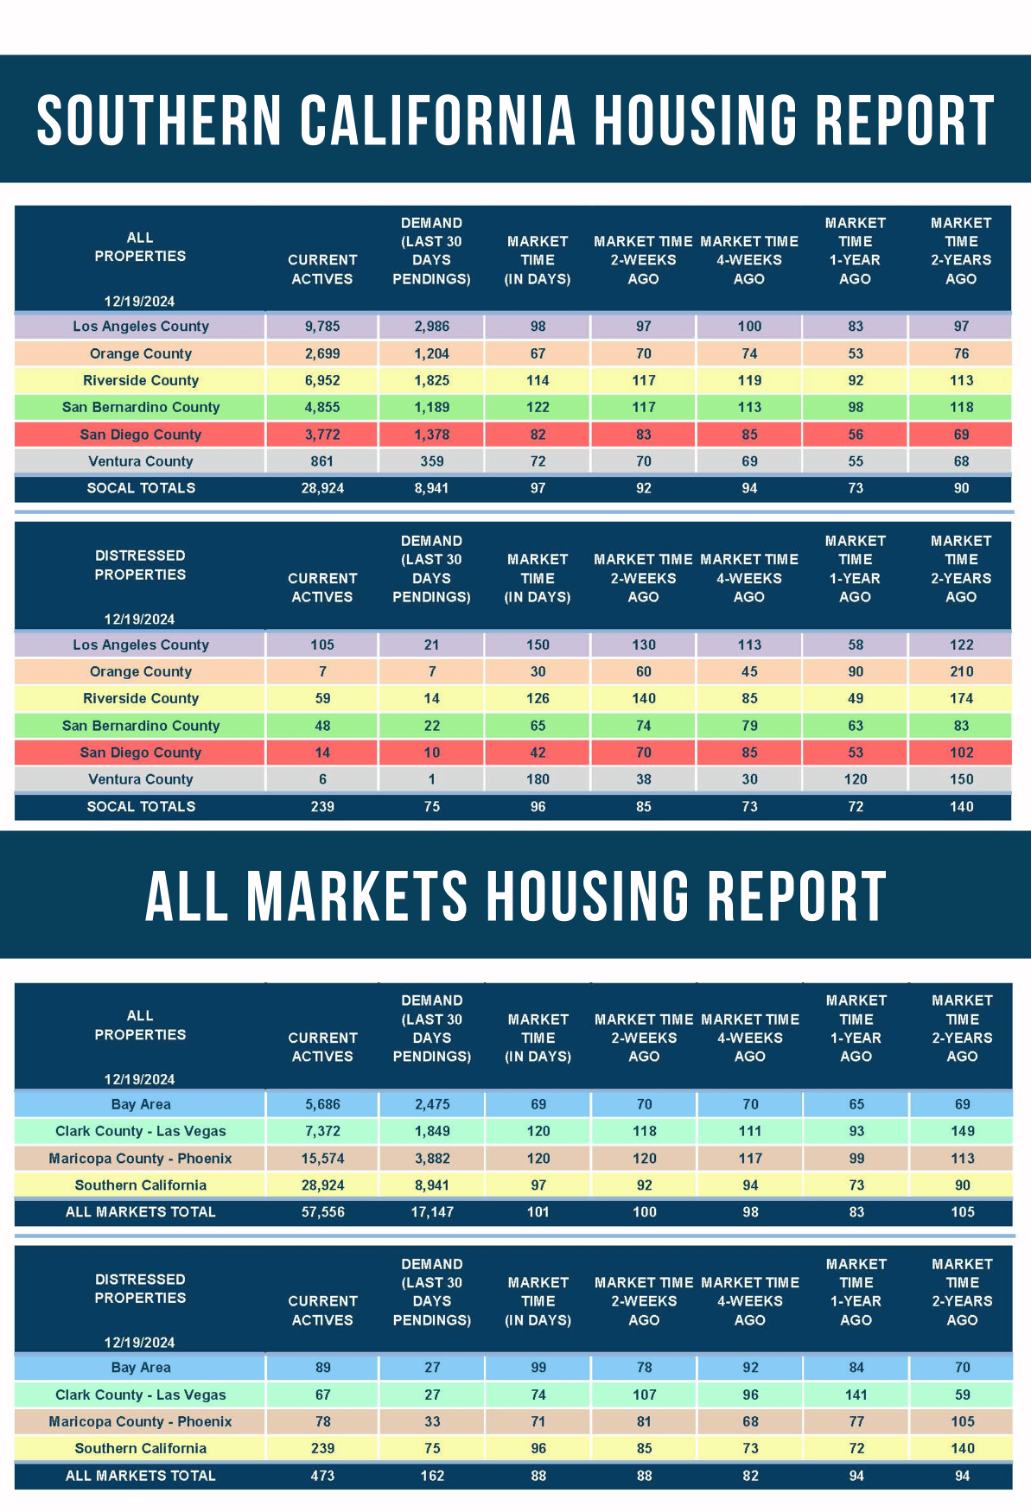
The year started with an active inventory of 1,623 homes, the second lowest level to start a year since tracking began in 2004, only behind 2022’s 954 anemic start. The average start before the pandemic was 4,500 homes, an astonishing 177% higher. A lack of available homes to purchase has been the mantra for the housing market since the pandemic hit nearly five years ago. Unlike in 2023, when the inventory fell from January through mid-April, this year was different, more like 2022, when mortgage rates were climbing. From January until its peak in September of 3,695, the inventory grew by 128%, adding 2,072 homes. It was the highest peak since 2022. The 3-year average peak before COVID (2017 to 2019) was 6,959 homes, 88% higher than this year. From September until the year’s end, the number of available homes decreased to 2,699, similar to 2022’s 2,642 level. The end to 2024 was 40% below the 3-year average end to December of 4,479. The start of 2025 will be very similar to the start of 2023, with about 2,500 available homes to purchase.
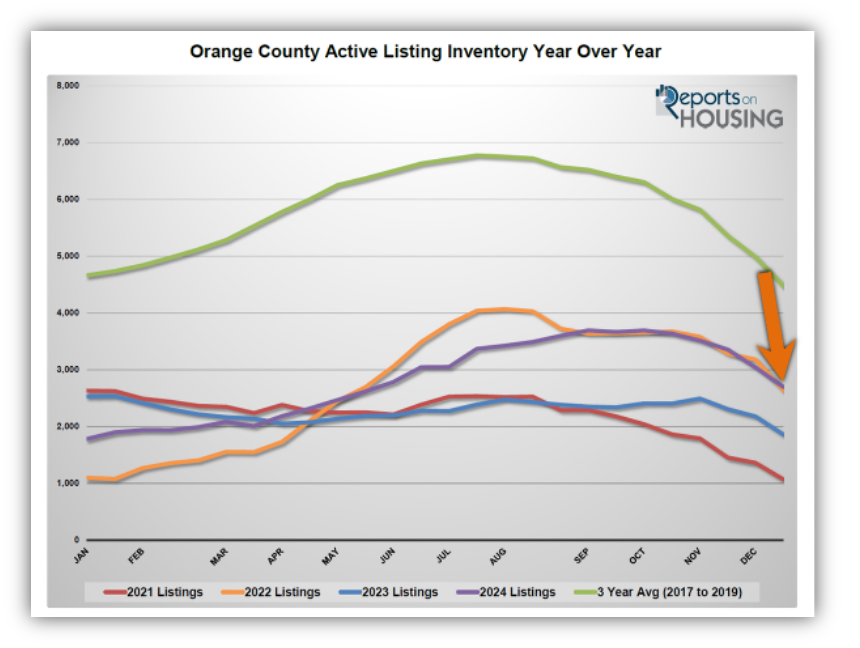
In 2022, due to skyrocketing mortgage rates, homeowners opted to stay put and “hunker down,” enjoying their fixed, low monthly mortgage payments. There were 22% fewer homes placed on the market in 2022 compared to the 3-year pre-pandemic average, 8,450 less. This trend grew significantly as 2022 progressed, and rates eclipsed 7% in October and November 2022. In 2023, the trend continued where 2022 left off, and homeowners hunkered down all year with 41% fewer homes placed on the market, 16,023 less. A notable 81% of California homeowners with a loan enjoy a fixed rate at or below 5% (Q3-2024). 65% are at or below 4%, and 29% have a rate at or below 3%. Yet, homeowners are tired of waiting for rates to fall so they can sell and find a new home. It has been 28 months since rates were below 6%, August 2022. In 2024, through November, there have been 3,497 additional FOR-SALE signs compared to the lows of 2023, 16% more. There are 32% fewer signs than the 3-year average, or 12,055 less.
Demand
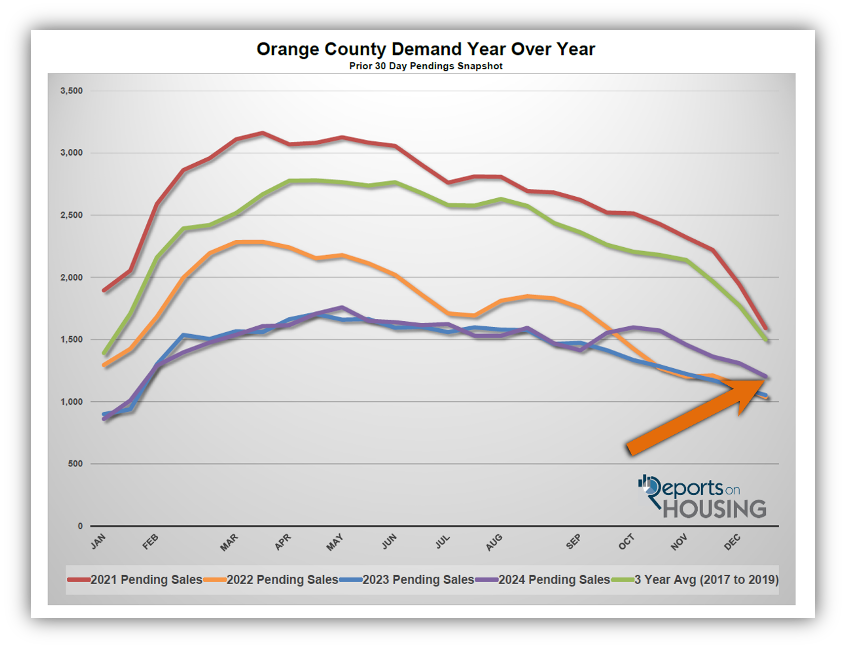
Demand resembled the lows of 2023 but has improved since September.
At the beginning of the year, demand for Orange County homes looked much like the subdued start to 2023, down 4% or 39 pending sales compared to last year, and down 38% compared to the 3-year average before COVID (2017 to 2019). Demand has been muted because higher rates severely impacted home affordability. Considering mortgage rates, home values, and household incomes, affordability has remained at historic lows.
After starting the year at 910 pending sales, demand peaked in May at 1,759, its second lowest peak since tracking began in 2004, only behind 2023’s 1,706. It was 38% below the 3-year average peak before COVID (2017 to 2019) of 2,816 pending sales. Mortgage rates started the year at 6.7% but climbed above 7% in February. They bounced around that level until April when they rose to 7.5% and remained in the 7s until mid-July. Buyer activity wanes considerably when mortgage rates linger above 7%. Thus, in 2024, buyer demand did not change much despite more available homes on the market. Finally, rates dropped below 7% with duration, from mid-July through the end of October. Demand jumped in September when rates fell to 6.1%. Buyer demand decoupled from 2023 levels, and pending sales activity remained stronger than last year through December, even though rates climbed above 7% in November and again at the end of December.
Unfortunately, demand was considerably blunted this year as 7%-plus mortgage rates plagued the Spring and Summer Markets. The more favorable mortgage rate environment came too late, matching up with the Autumn Market, a much slower time of the year.
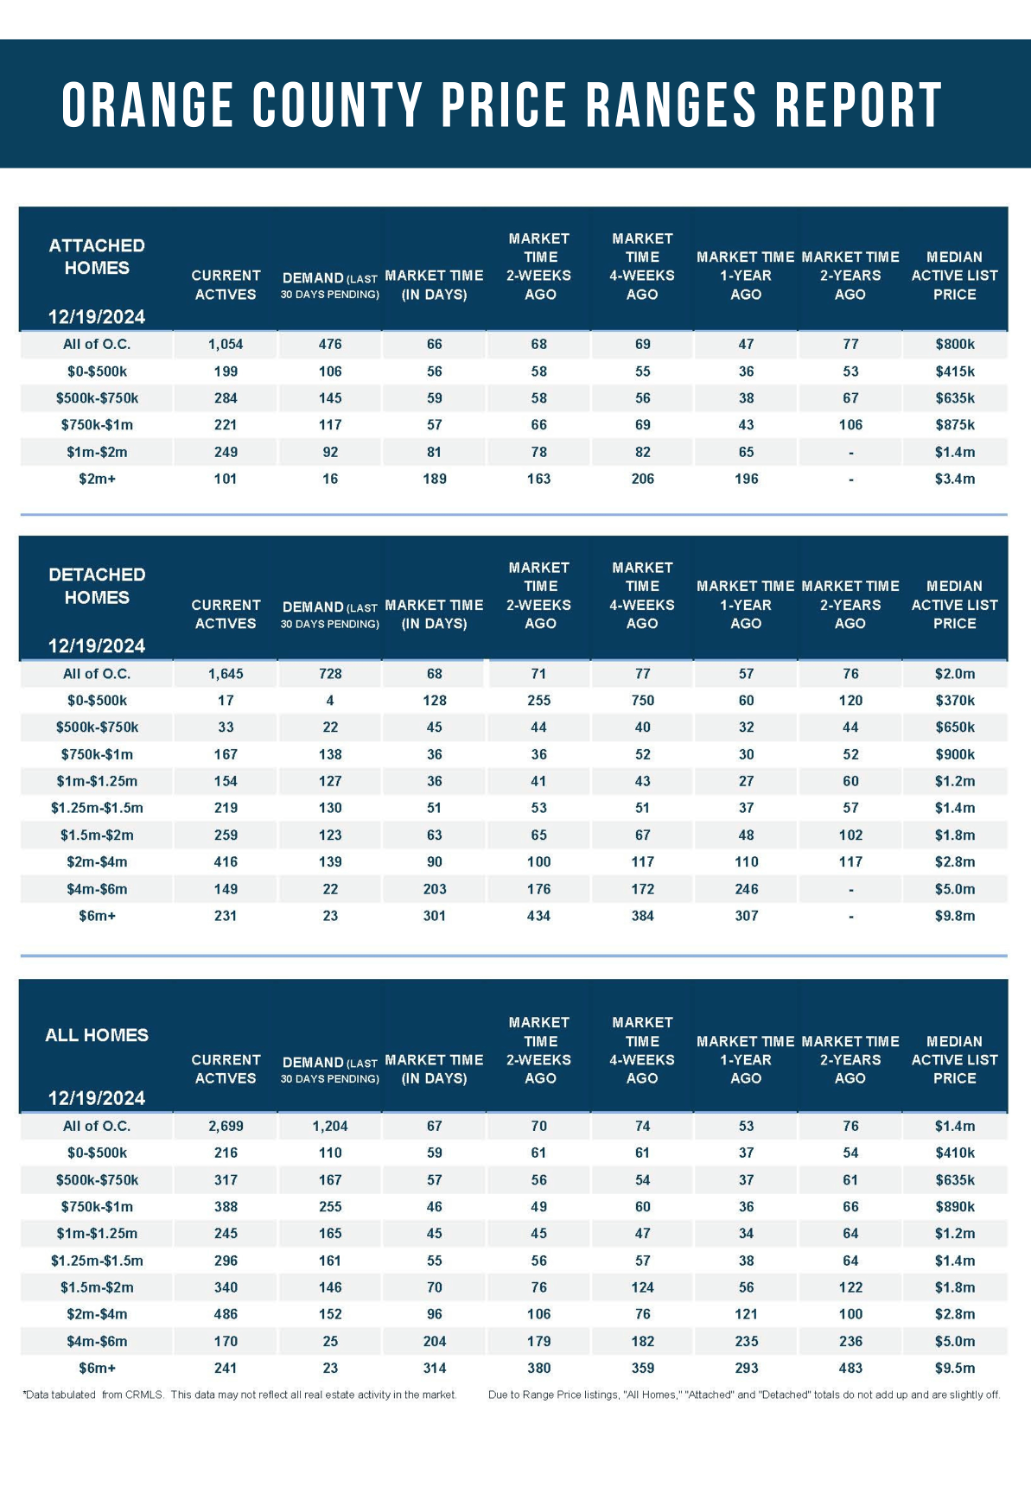
Within the past four weeks, demand dropped by 159 pending sales, or 12%, to 1,204 pending sales, the lowest reading since January. At the end of December 2023, demand was at 1,053 pending sales, or 13% lower, one of the lowest demand readings since tracking began in 2004. The 3-year average end to December before COVID was 1,499 pending sales, or 25% higher.
Luxury End
The luxury home market was much hotter than in 2023.
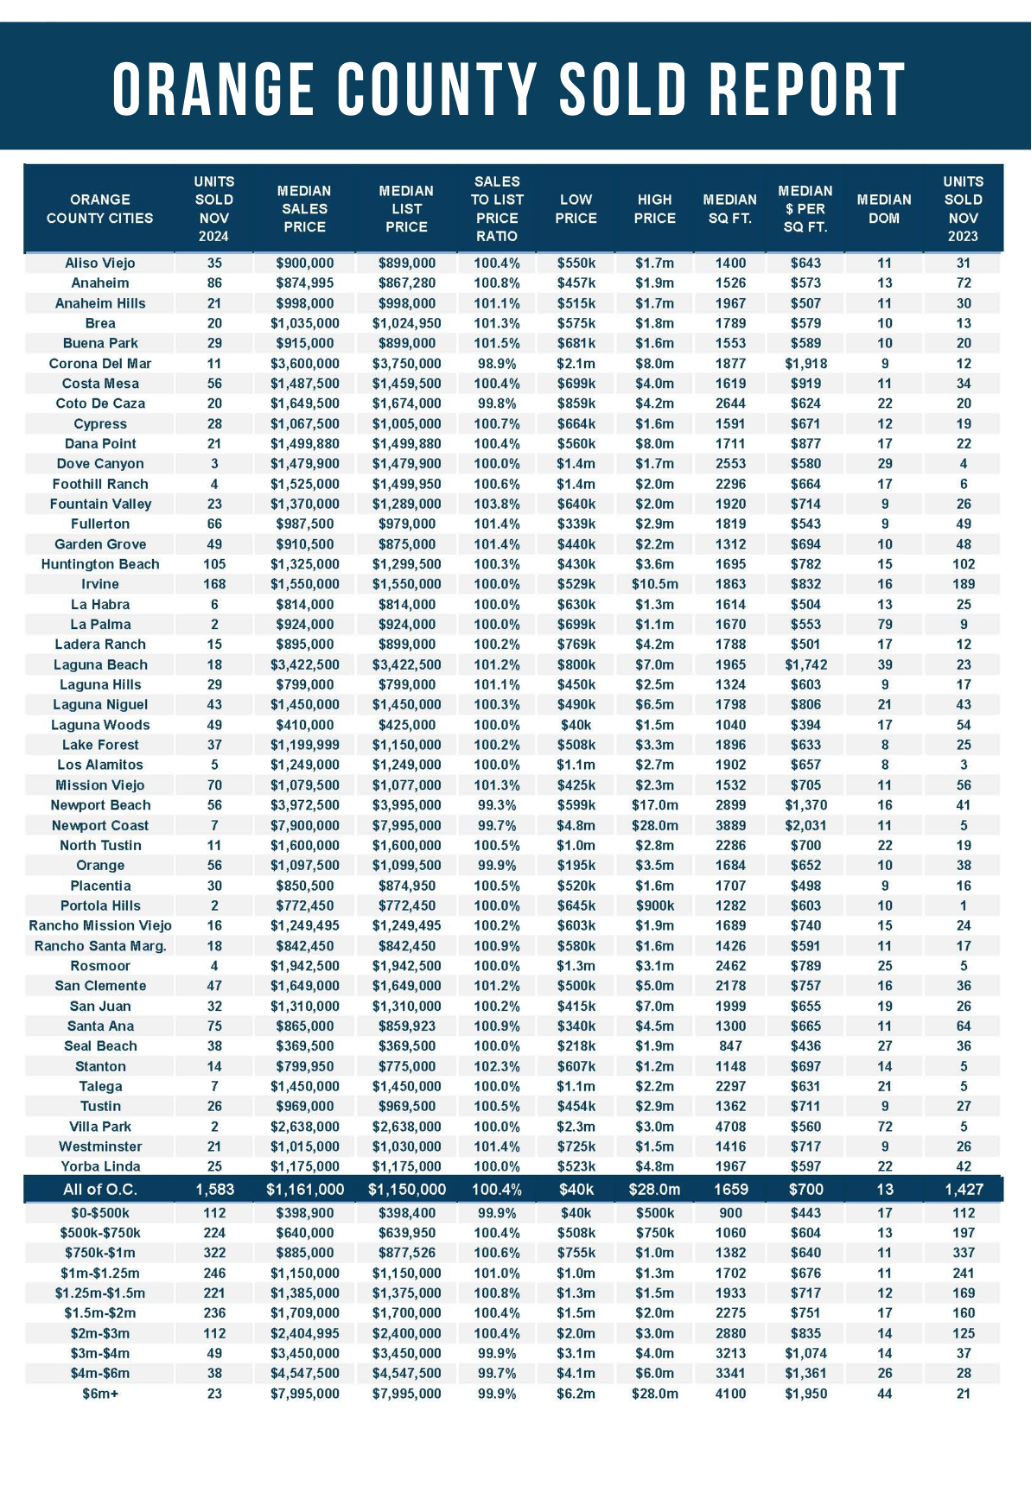
2021 was a record-setting year for luxury sales above $2 million in Orange County, eclipsing 2020 by 88% with 3,548 closed sales. Despite higher rates, 2022 was off by only 14% compared to 2021, with 3,047 closed sales. In 2023, luxury sales dropped to 2,530, still the 3rd highest. Luxury rebounded in 2024. Through November, there were 3,100 closed sales, up 32% from 2023, an additional 755. It is the second most closed luxury sales, above $2 million, since tracking began in 2004, 5% less than in 2021.
During the pandemic, the luxury market evolved to an incomprehensible fast pace. Luxury homes that typically took months to sell were selling almost instantly. In February 2022, the Expected Market Time (the time between coming on the market and opening escrow) reached a record low of 45 days. That changed as the Federal Reserve stepped in and increased the Federal Funds rate. Suddenly, the credit market became substantially more expensive, and the luxury market was impacted just like all other price ranges. In February, the Expected Market Time for homes priced above $2 million dropped to 84 days, its lowest level since May 2022. It surpassed 150 days in June and eclipsed 160 days in November.
As of the end of December, luxury demand is at 200 pending sales, 67% higher than in 2023. The inventory is at 897 after plunging by 9% in the previous two weeks, 35% higher than in 2023. The Expected Market Time for luxury finished the year at 135 days.
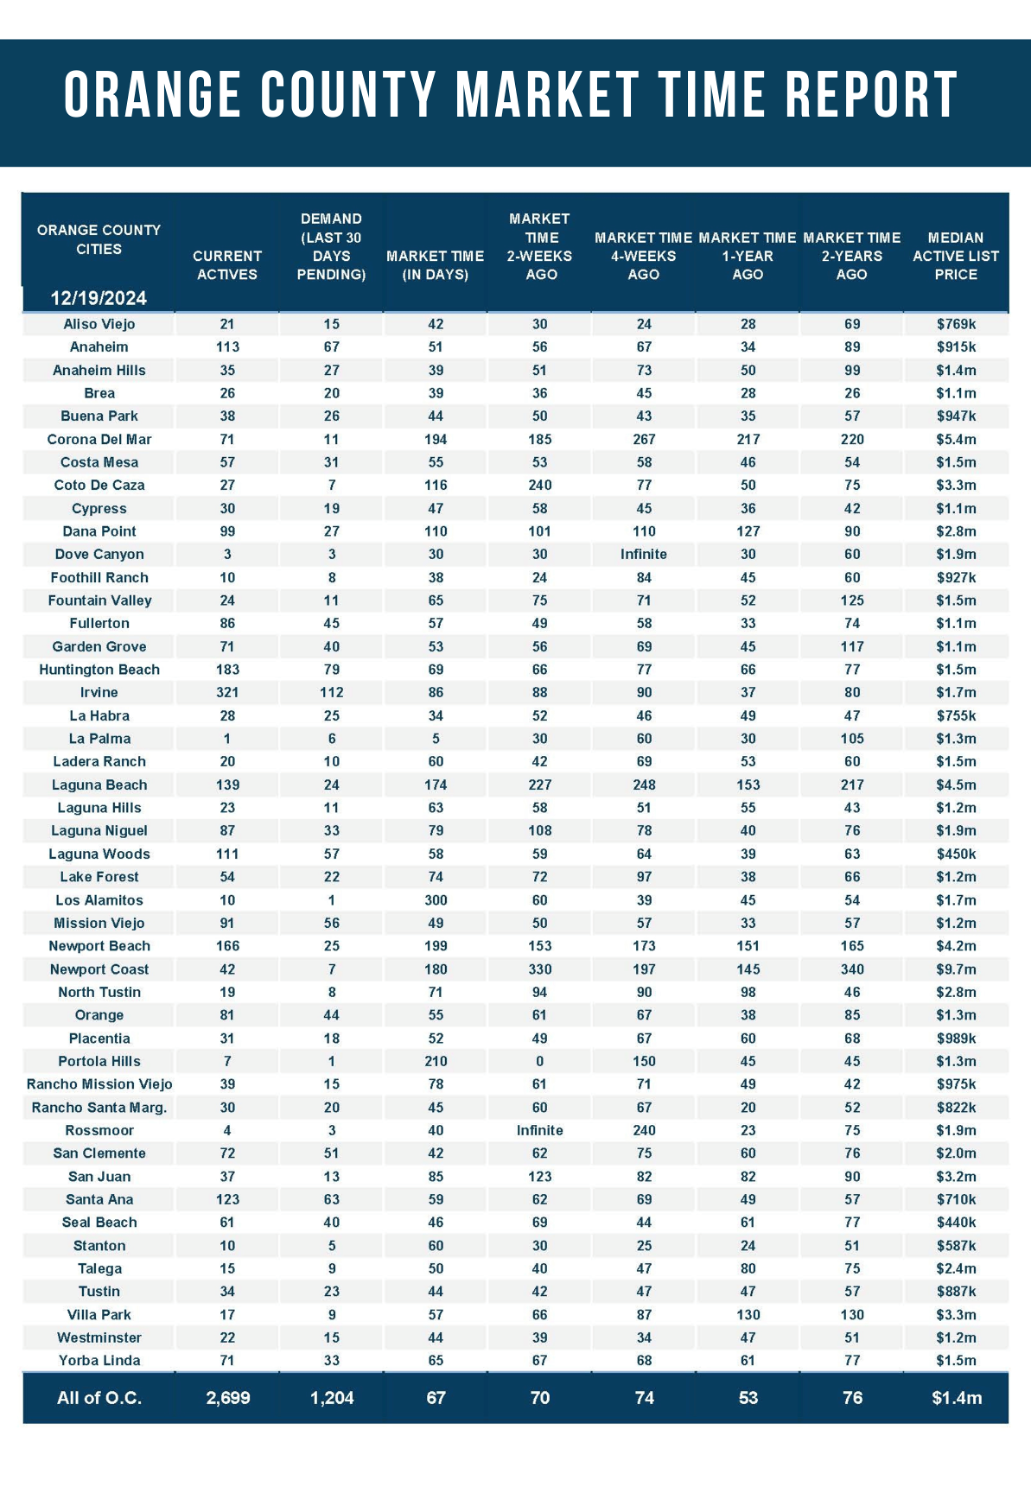
Expected Market Time
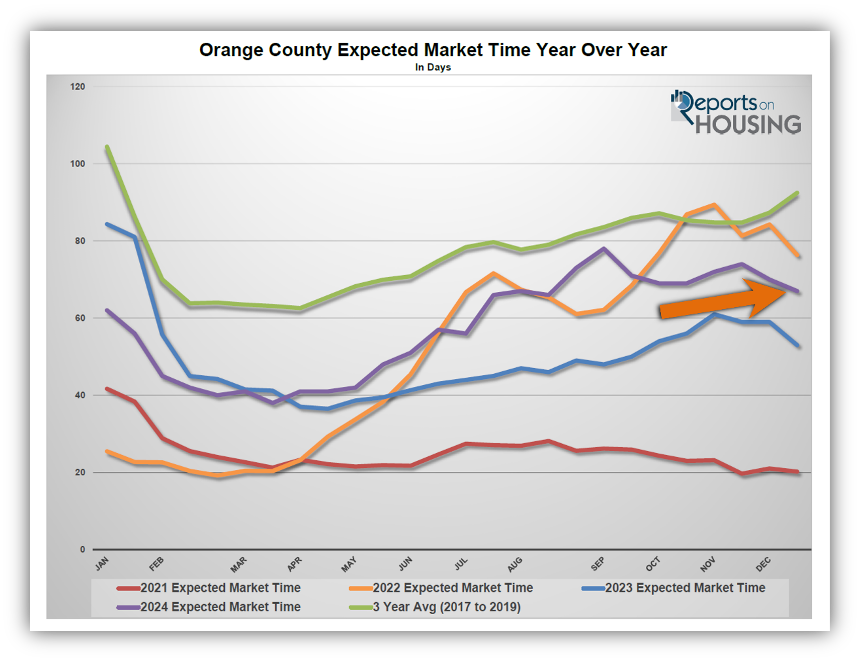
The time it took to sell a home grew longer as the year progressed.
The Expected Market Time, the amount of time it would take to place a home listed today into escrow down the road (based upon current supply and demand), started the year at 54 days, stronger than pre-pandemic levels due to a limited inventory. Rates did not cooperate with 2024, rising above 7% in February. Yet, the ultra-low inventory prevailed, and the Expected Market Time dropped to 37 days to close out March. Homes were flying off the market.
Behind the scenes, more homes were coming on the market compared to 2023, and those extra homes started accumulating with rates above 7%. The inventory slowly climbed. After demand peaked in early May, the inventory continued to grow. With a rising inventory and slowly falling demand, the Expected Market Time grew longer and longer. It eclipsed 50 days in June, 60 days in July, and 70 days in August. It bounced around 70 days through year’s end. In the past two weeks, the Expected Market Time for Orange County dropped from 70 to 67 days, higher than 2023’s year-end at 53 days.
The housing market is at the mercy of rates, so it all depends on the path of mortgage rates in 2025.
Two opposing forces have steered the strength of the housing market: a scarcity of available homes and home affordability. The year started with a lack of available homes. Yet, as mortgage rates eclipsed 7% and remained elevated for much of the year, homes stagnated on the market, and the active inventory grew. Careful pricing was critical as seller competition increased. Home values accelerated early in the year and then waned during the year’s second half. The Federal Reserve telegraphed that they were going to start cutting rates. Rates dropped below 6.5% in August and remained there for 42 days until October 4th, when a jobs report was released that showed that the jobs market was considerably hotter than expectations. Even though the Federal Reserve has cut the short-term Federal Funds rate by 1% (0.5% in September, 0.25% in November, and 0.25% last week), long-term 30-year mortgage rates have climbed to 7.1% today, according to Mortgage News Daily. That is 1% higher than where they were right before they cut rates by 0.5% in September. The Federal Reserve projects the economic numbers for 2025 to be hotter than initially anticipated, and the rekindling of inflation is an additional concern. They have indicated they might not cut rates as much in 2025 as originally projected. The United States economy has been resilient, backed by a robust labor market, low unemployment, and increasing consumer spending. Yet, some headwinds should not be ignored: credit card and automobile delinquencies have risen sharply, and new home housing starts have dropped to 2019 levels, which could lead to layoffs and impact the jobs numbers. The economy is expected to cool, but will it continue to beat expectations? Mortgage rates will drop only with subdued economic readings. The hotter the economic readings, the higher mortgage rates will remain. The economic numbers will dictate the path of mortgage rates in 2025. The forecast has three different scenarios:
Scenario 1 – Resilient, Solid Economic Numbers Starting in the Spring (our base case)
- Interest Rates – Look for mortgage rates to bump between 6.5% and 7% with economic readings that illustrate a robust economy in line with Wall Street and economists’ expectations. The Federal Reserve will cut its short-term rate only a couple of times.
- Active Inventory – after starting the year with 2,400 homes, the third lowest start to a year since tracking began in 2004, only behind 2022 and 2024, the inventory will slowly grow until peaking in September. It will reach a peak of only 4,700 homes, well below the over 7,000 home peak average before COVID, but 27% higher than this year. As mortgage rates improve, the “Hunkering Down” effect, where homeowners opt to stay in their homes due to their underlying fixed low mortgage rates, will diminish. There will be 25% fewer homes compared to the 3-years before COVID (2017 to 2019), yet 3,100 more FOR-SALE signs than in 2024.
- Demand – buyer demand will pick up during the Spring Market due to rates a better rate environment compared to 2024. The housing market will heat up, and multiple offers will be the norm. Expect bidding wars during the Spring Market, but only if a home is priced appropriately. Buyers will not be willing to stretch the price to secure a home.
- Closed Sales – the number of successful closed sales will increase by 8% to 10% compared to 2024, with around 22,500 total.
- Home Values – home values will rise between 3% to 6% for the year.
Scenario 2 – Economy Cools During the Spring (15% chance)
- Interest Rates – mortgage rates will drop between 6% and 6.5%, with economic readings illustrating a slowing economy and lower than Wall Street and economists’ expectations. The Federal Reserve will cut more than expected, dropping the Federal Funds rate four times.
- Active Inventory – after starting the year with less than 2,400 homes, the third lowest start to a year since tracking began in 2004, only behind 2022 and 2024, the inventory will slowly grow until peaking in July or August. It will reach a peak of only 4,000 homes, well below the over 7,000 home peak average before COVID, and 8% higher than this year. As mortgage rates improve, the “Hunkering Down” effect, where homeowners opt to stay in their homes due to their underlying fixed low mortgage rates, will diminish. There will be 25% fewer homes compared to the 3-years before COVID (2017 to 2019), yet 3,100 more FOR-SALE signs than in 2024.
- Demand – buyer demand will pick up substantially during the Spring Market. The housing market will heat up as rates remain below 6.5% with duration. Multiple offers and bidding wars will prevail, and buyers will be willing to stretch the price to secure a home.
- Closed Sales – the number of successful closed sales will increase by 12% to 16% compared to 2024, with around 23,750 total.
- Home Values – home values will rise between 5% to 8% for the year.
Scenario 3 – Stronger Economic Numbers, Stronger Jobs Market, and a Rise in Inflation Risk (15% chance)
- Interest Rates – mortgage rates will remain above 7% for most of the year, with economic readings that illustrate a robust economy and a very strong labor market, exceeding Wall Street’s and economists’ expectations. The Federal Reserve will be forced not to cut the Federal Funds Rate.
- Active Inventory – after starting the year with less than 2,400 homes, the third lowest start to a year since tracking began in 2004, only behind 2022 and 2024, the inventory will slowly grow until peaking in October or November. It will reach a peak of only 5,400 homes, still well below the over 7,000 home peak average before COVID, but 46% higher than this year. As mortgage rates improve, the “Hunkering Down” effect, where homeowners opt to stay in their homes due to their underlying fixed low mortgage rates, will diminish. There will be 25% fewer homes compared to the 3-years before COVID (2017 to 2019), yet 3,100 more FOR-SALE signs than in 2024.
- Demand – buyer demand will be sluggish during the Spring and Summer Markets, with rates stuck above 7% with duration. The Spring Market will feel short as the inventory quickly rises and the market slows, similar to this year. Buyers will be unwilling to stretch the price to secure a home. With more seller competition, proper pricing will be critical to ensure success.
- Closed Sales – the number of successful closed sales will increase between 0% and 2% compared to 2024, with around 20,900 total.
- Home Values – home values will be down 1% to up 1% for the year.
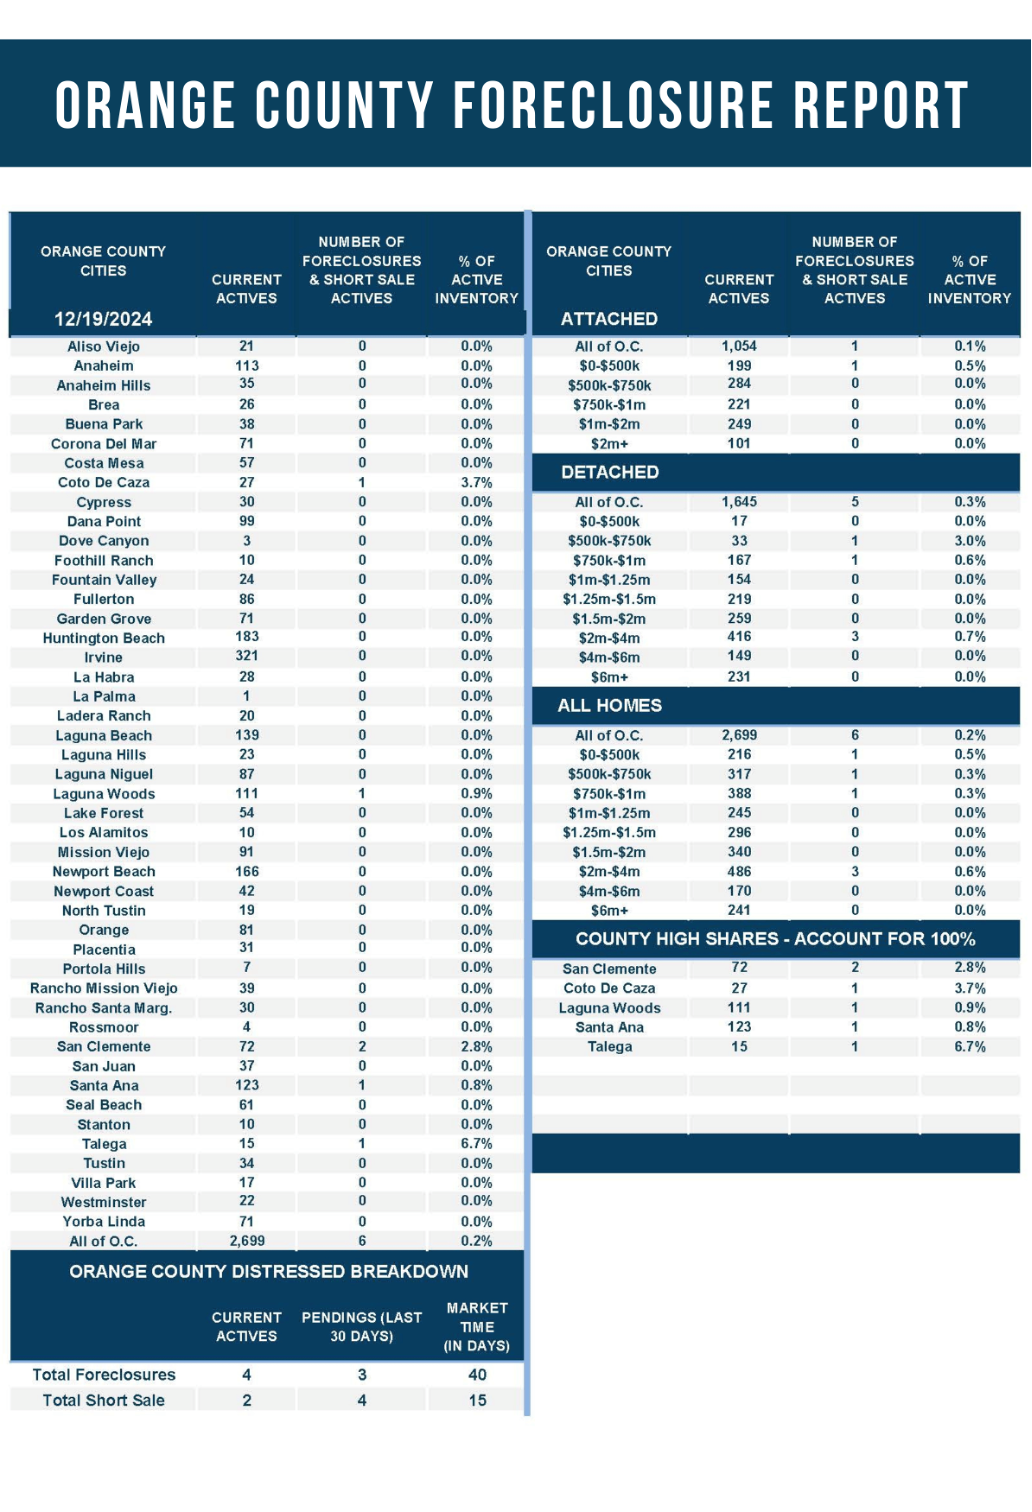
Additionally, the housing market will follow a typical housing cycle. Spring is the strongest in terms of demand, followed by the Summer Market, then the Autumn Market, and finally the Holiday Market. Luxury housing will be at its strongest for the first half of the year and then will become more sluggish with longer market times during the second half. Finally, do not expect a wave of foreclosures and short sales. Distressed properties are still far below pre-pandemic levels, and the housing stock (all homeowners across the country) is the healthiest in U.S. history.
The bottom line is that nobody truly knows the actual path of the United States economy in 2025. Based on monthly economic releases and where they align with expectations, rates will be between 6% and 7.5%. Housing is at the mercy of rates. How hot the housing market gets in 2025 depends upon the economy’s strength.
Happy New Year!
Sincerely,
Steven Thomas
Quantitative Economics and Decision Sciences
Copyright 2024—Steven Thomas, Reports On Housing—All Rights Reserved. This report may not be reproduced in whole or in part without express written permission from the author.