December 9, 2024
Housing data demonstrates that a significant drop in home values are not on the horizon despite the current market slowdown.
A Low Historical Supply
With a limited inventory and over a decade of tight lending standards, housing values will not plunge as they did during the Great Recession.
A surprising 44% of Americans thought the housing market would crash and values would plunge, according to a LendingTree survey conducted at the end of last year. A shocking 52% of millennials believed in a 2024 crash. The same study was conducted at the end of 2022, and 41% of Americans thought housing values would nosedive in 2023. The market did not collapse in either 2023 or 2024. How could so many convinced Americans get it wrong?
The Great Recession was a painful downturn for housing. So many homeowners were burned as values cratered and equity evaporated seemingly overnight. Everyone was affected by it personally or they knew someone who was painfully impacted and left with nothing. It was the most devastating period for housing since the Great Depression. As a result, the immediate knee-jerk response to any slowdown in housing is that values will tumble once again like they did during the Great Recession.
In 2018, when rates climbed from 4% to 5%, many believed that housing values would plunge. At the beginning of COVID, when the economy came to a screeching halt and many homeowners entered forbearance, the market was expected to tilt heavily in the buyer’s favor. And, when the Federal Reserve raised the Federal Funds Rate eleven times between March 2022 and July 2023, the housing bubble was supposed to pop. Yet, that did not occur.
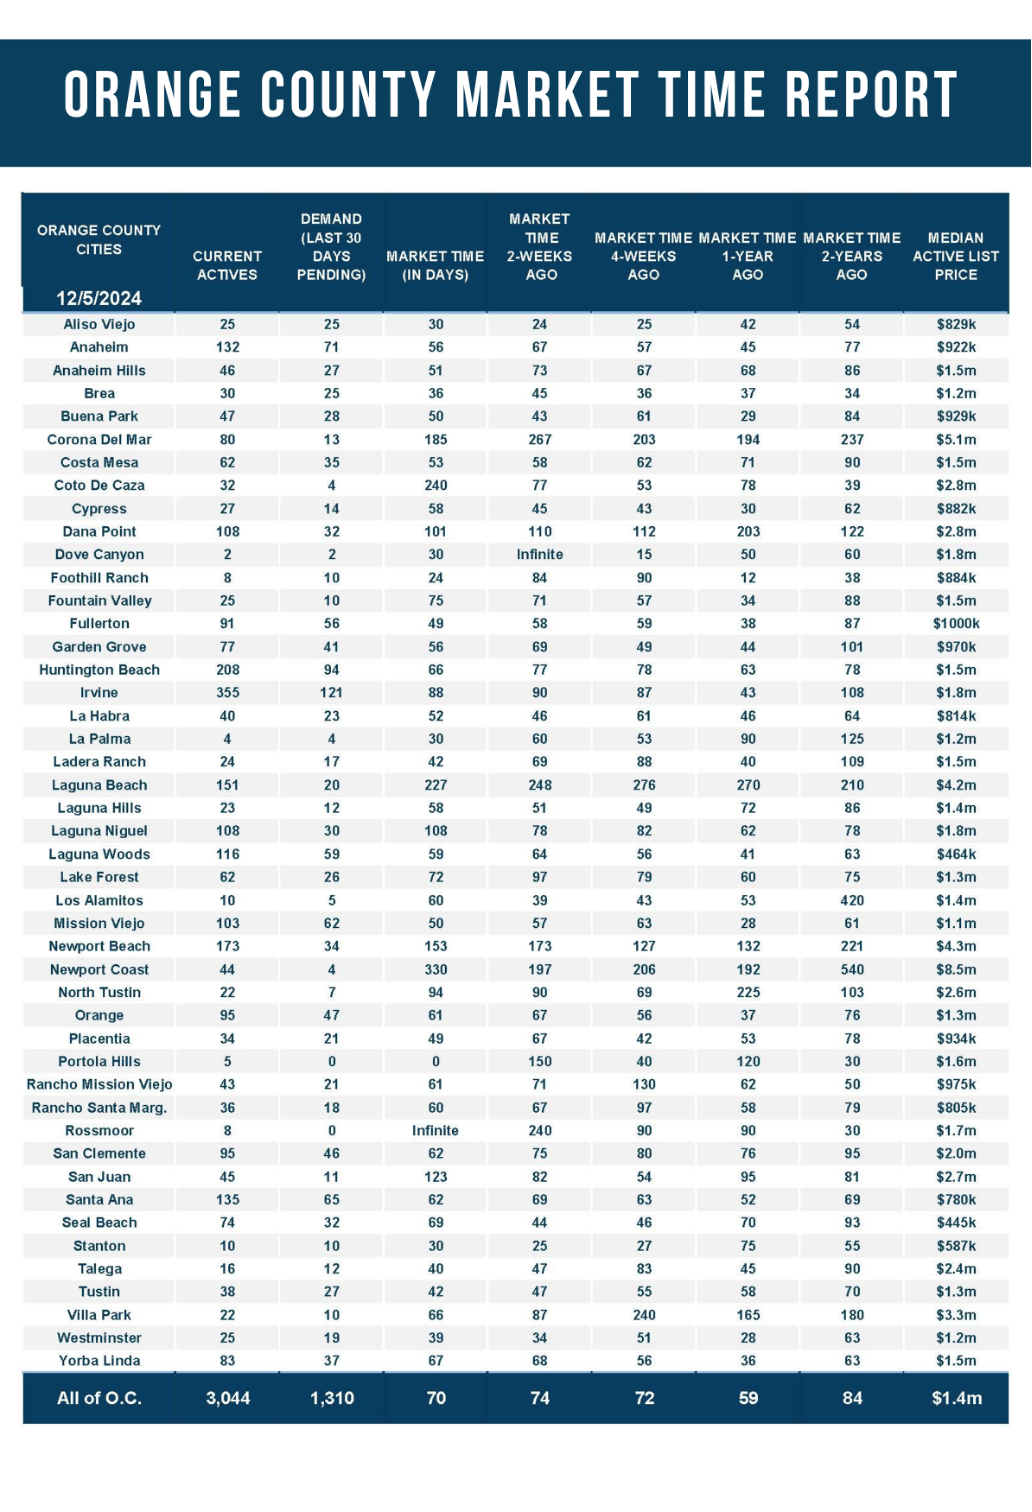
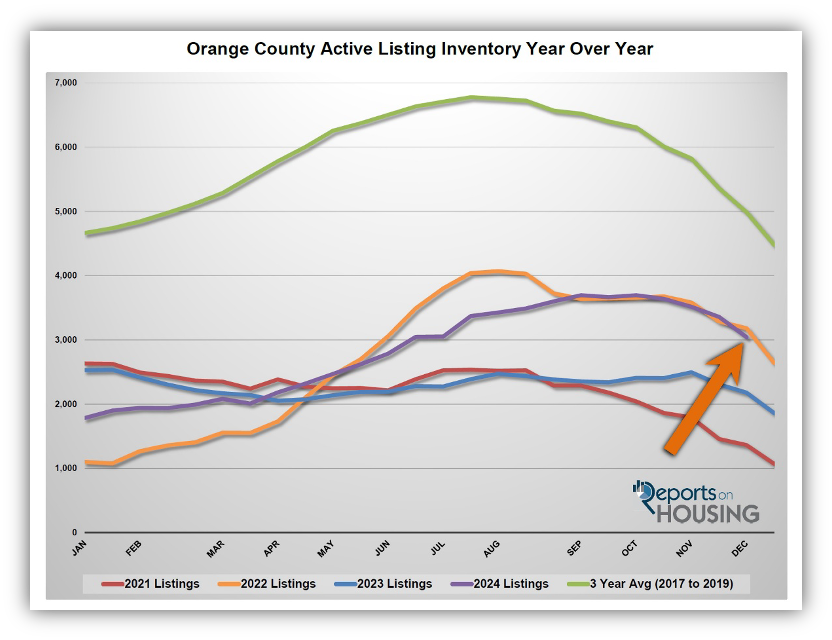
There are many reasons that housing has not crashed over the years despite the continued sentiment that it was inevitable. There will not be a plunge in home values because there are simply not enough available homes to purchase. Today’s inventory is at 3,044 homes. While there are 40% more homes this year compared to last year, the 3-year average before COVID (2017 to 2019) was 4,988, 64% more than today.
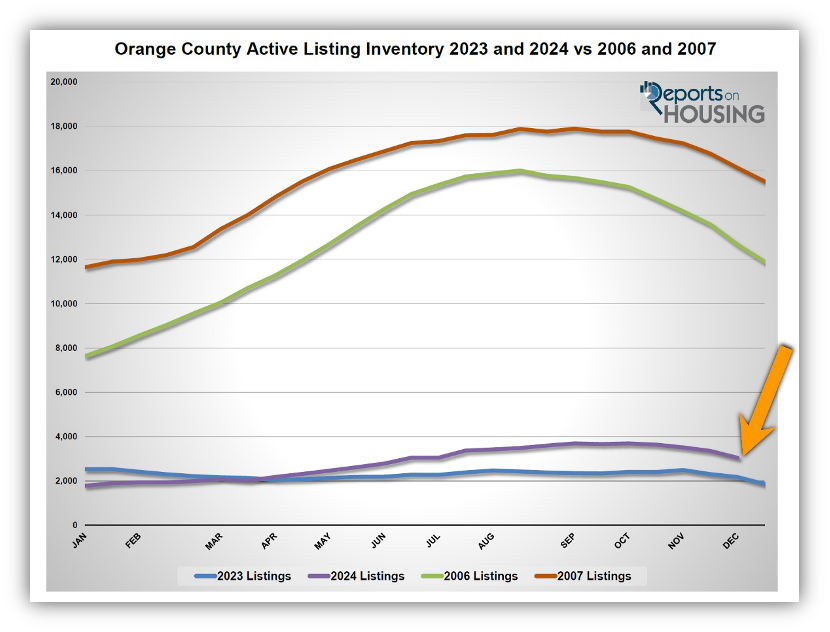
The inventory has been stuck at anemic levels since the beginning of the pandemic. The difference is striking when comparing today’s supply to the two years leading up to the Great Recession, 2006 and 2007. The inventory peaked at 16,006 homes in 2006, and 17,898 in 2007. The 2023 peak was 2,496, and in 2024, it was 3,695. The inventory has remained at very low, anemic levels compared to the glut of available homes leading up to the Great Recession. The 3-year average peak prior to the pandemic was nearly 7,000, still considerably lower than the levels reached in 2006 and 2007.
In 2006, as demand plummeted and the inventory ballooned, the Expected Market Time (the number of days it takes to sell all Orange County listings at the current buying pace, based upon supply and demand) climbed to over 200 days. In 2007, when demand dropped even further, the Expected Market Time skyrocketed to over 400 days. When housing is severely out of balance, which it was prior to and during the Great Recession, values plunge.
Since the Federal Reserve raised the short-term rate, demand has plummeted to levels that rival the Great Recession. They have remained low since the second half of 2022. Yet, that low demand has been matched up against very little supply. Today’s Expected Market Time is 70 days, a far cry from 2006’s over 200 days and 2007’s over 400.
Even in today’s high mortgage rate environment, values have risen year-over-year. According to Freddie Mac’s House Price Index, the Los Angeles/Orange County metro has grown by 6% year-over-year through October. In 2023, home values rose by 8%. The low inventory has continued to place pressure on prices and has not allowed values to plunge despite severe affordability constraints.
Today’s United States housing stock is the strongest ever. Ever since the Great Recession, buyers have been purchasing homes with strict qualifications, strong credit, great jobs, and low fixed payments. There is record tappable equity (the amount of equity a homeowner can use for a loan while still retaining 20% equity), record equity rich (50% plus equity), and a record number of homeowners who own their home free-and-clear. There will be no housing crash because of the strength of the homeowner and the limited supply of homes available to purchase.
Active Listings
The inventory plunged by 9% in the past couple of weeks.
The active listing inventory decreased by 314 homes in the past two weeks, down 9%, and now sits at 3,044, its lowest level since the start of June. It was the largest drop so far this year. The inventory cyclically plunges during the Holiday Market. December is home to the fewest number of homes placed on the market and the greatest number of sellers who throw in the towel and pull their homes off the market due to a lack of success so that they can enjoy the holidays and wait for a better season to sell. Expect the inventory to continue to sink until ringing in a New Year.
Last year, the inventory was at 2,180 homes, 28% lower, or 864 fewer. The 3-year average before COVID (2017 through 2019) was 4,988, an additional 1,944 homes, or 64% more.
Homeowners continue to “hunker down” in their homes, unwilling to move due to their current underlying, locked-in, low fixed-rate mortgage. It became a crisis once rates skyrocketed higher in 2022. For November, 1,541 new sellers entered the market in Orange County, 713 fewer than the 3-year average before COVID (2017 to 2019), 32% less. Last November, there were 1,494 new sellers, 3% fewer than this year. More sellers are opting to sell compared to the previous year.
Demand
Demand dipped by 4% in the past couple of weeks.
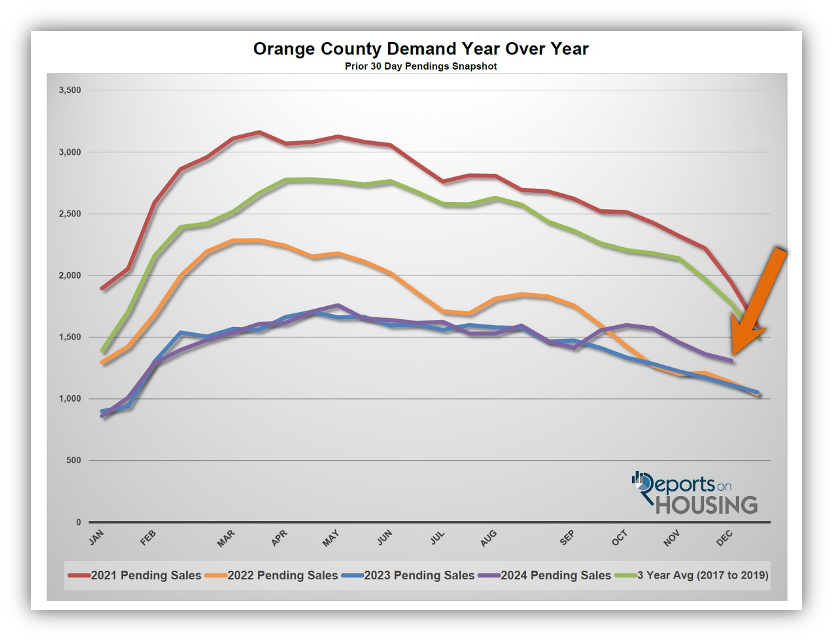
Demand, a snapshot of the number of new pending sales over the prior month, decreased from 1,363 to 1,310 in the past couple of weeks, down 53 pending sales, or 4%, its lowest level since the start of February. While demand is continuing its seasonal drop until the New Year, it remains elevated compared to last year. Last year, rates were higher from September through December. Today’s better mortgage rate environment has paved the way for slightly higher demand, 18% higher or an extra 197 pending sales.
As the Federal Reserve has indicated, watching all economic releases for signs of slowing is essential. These releases can potentially move mortgage rates higher or lower, depending on how they compare to market expectations. The Consumer Price Index (CPI) will be released on Wednesday, and the Producer Price Index will be released on Thursday, two closely watched inflation gauges that can impact mortgage rates.
Last year, demand was 1,113, 197 fewer pending sales or 15% less. The 3-year average before COVID (2017 to 2019) was 1,774 pending sales, 35% more than today, or an additional 464.
With supply falling faster than demand, the Expected Market Time (the number of days it takes to sell all Orange County listings at the current buying pace) decreased from 74 to 70 days in the past couple of weeks. Last year, it was 59 days, faster than today. The 3-year average before COVID was 87 days, slower than today.
Luxury End
The luxury market slowed slightly in the past couple of weeks.
In the past couple of weeks, the luxury inventory of homes priced above $2 million (the top 10% of the Orange County housing market) decreased from 1,096 to 991 homes, down 105 or 10%. Luxury demand decreased by 31 pending sales, down 13%, and now sits at 207. With demand rising and the supply falling, the Expected Market Time for luxury homes priced above $2 million increased from 138 to 144 days. The luxury market has improved over the last couple of months due to the stock market reaching record levels.
Year over year, the active luxury inventory is up by 246 homes or 33%, and luxury demand is up by 74 pending sales or 56%. Last year’s Expected Market Time was 168 days, slower than today.
In the past two weeks, the expected market time for homes priced between $2 million and $4 million decreased from 104 to 76 days. For homes priced between $4 million and $6 million, the Expected Market Time decreased from 182 to 106 days. For homes priced above $6 million, the Expected Market Time increased from 359 to 380 days. At 380 days, a seller would be looking at placing their home into escrow around December 2025.
Orange County Housing Summary
- The active listing inventory in the past couple of weeks plunged by 314 homes, down 9%, and now sits at 3,044, its lowest level since the start of June and its largest drop of the year. In November, 32% fewer homes came on the market compared to the 3-year average before COVID (2017 to 2019), 713 less. Yet, 47 more sellers came on the market this November compared to November 2023. Last year, there were 2,180 homes on the market, 864 fewer homes, or 28% less. The 3-year average before COVID (2017 to 2019) was 4,988, or 64% extra.
- Demand, the number of pending sales over the prior month, decreased by 53 pending sales in the past two weeks, down 4%, and now totals 1,310. Last year, there were 1,113 pending sales, 15% fewer. The 3-year average before COVID (2017 to 2019) was 1,774, or 35% more.
- With supply falling faster than demand, the Expected Market Time, the number of days to sell all Orange County listings at the current buying pace, decreased from 74 to 70 days in the past couple of weeks. The 3-year average before COVID (2017 to 2019) was 87 days, slower than today.
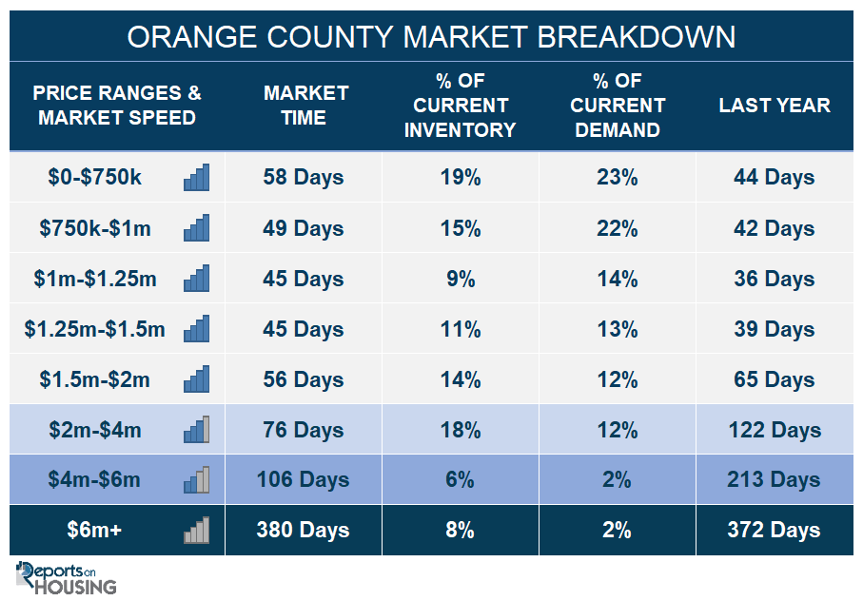
- In the past two weeks, the Expected Market Time for homes priced below $750,000 increased from 57 to 58 days. This range represents 19% of the active inventory and 23% of demand.
- The Expected Market Time for homes priced between $750,000 and $1 million decreased from 60 to 49 days. This range represents 15% of the active inventory and 22% of demand.
- The Expected Market Time for homes priced between $1 million and $1.25 million decreased from 47 to 45 days. This range represents 9% of the active inventory and 14% of demand.
- The Expected Market Time for homes priced between $1.25 million and $1.5 million decreased from 57 to 45 days. This range represents 11% of the active inventory and 13% of demand.
- The Expected Market Time for homes priced between $1.5 million and $2 million decreased from 91 to 56 days. This range represents 14% of the active inventory and 12% of demand.
- In the past two weeks, the expected market time for homes priced between $2 million and $4 million decreased from 104 to 76 days. For homes priced between $4 million and $6 million, the Expected Market Time decreased from 182 to 106 days. For homes priced above $6 million, the Expected Market Time increased from 359 to 380 days.
- The luxury end, all homes above $2 million, account for 30% of the inventory and 16% of demand.
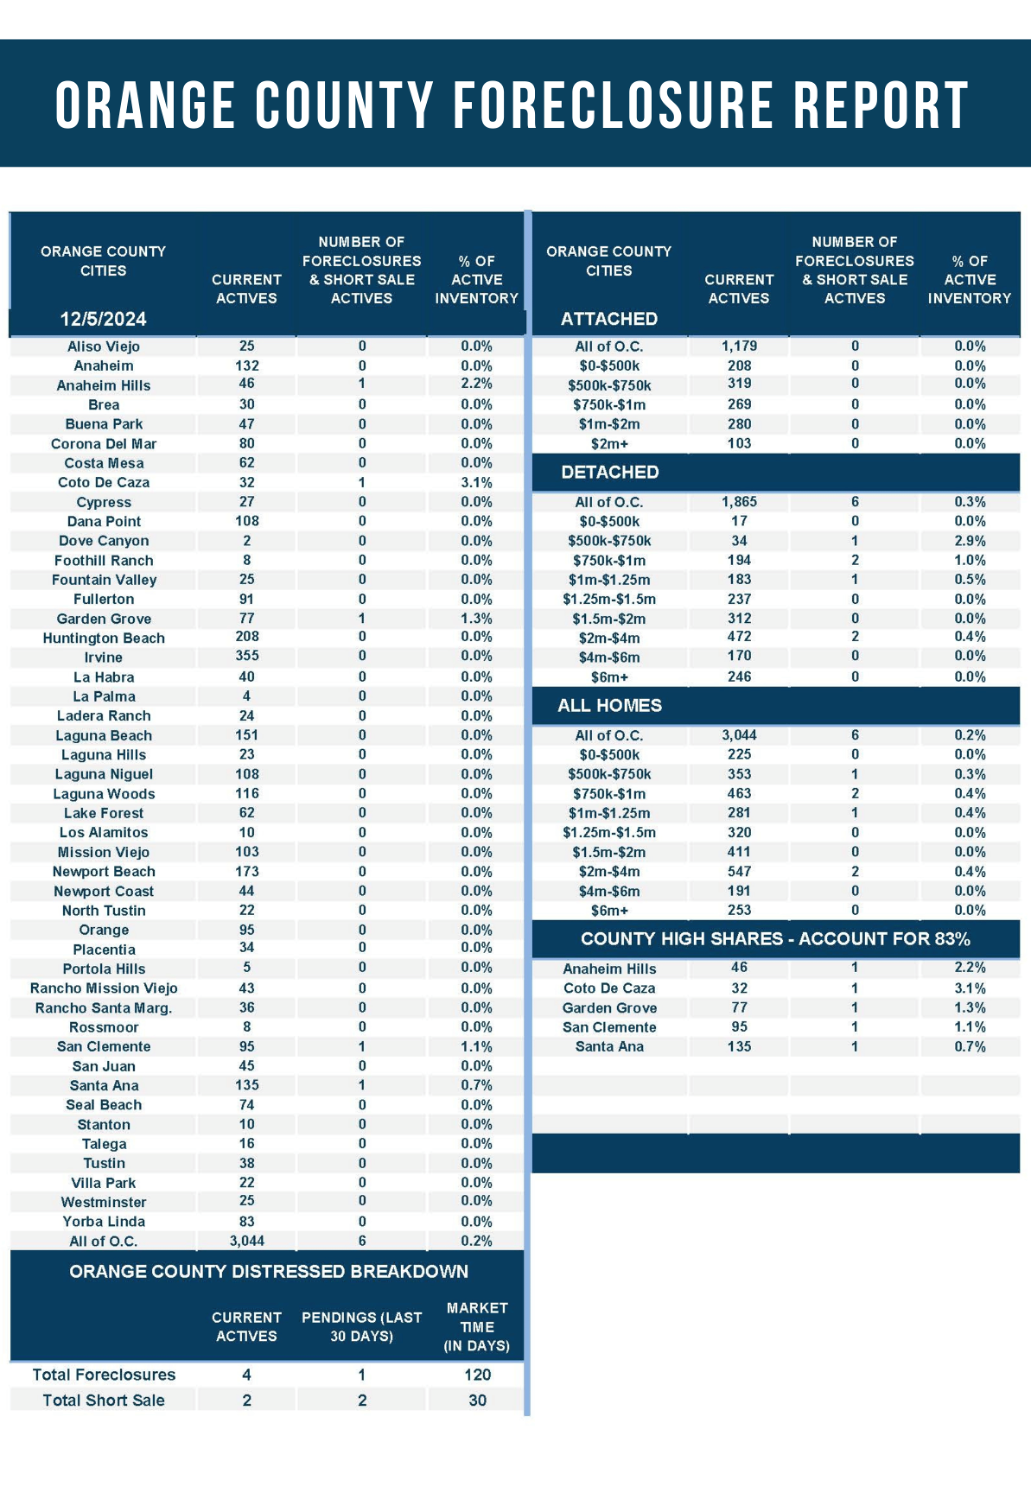
- Distressed homes, both short sales and foreclosures combined, comprised only 0.2% of all listings and 0.2% of demand. Only four foreclosures and two short sales are available today in Orange County, with six total distressed homes on the active market, unchanged from two weeks ago. Last year, six distressed homes were on the market, identical to today.
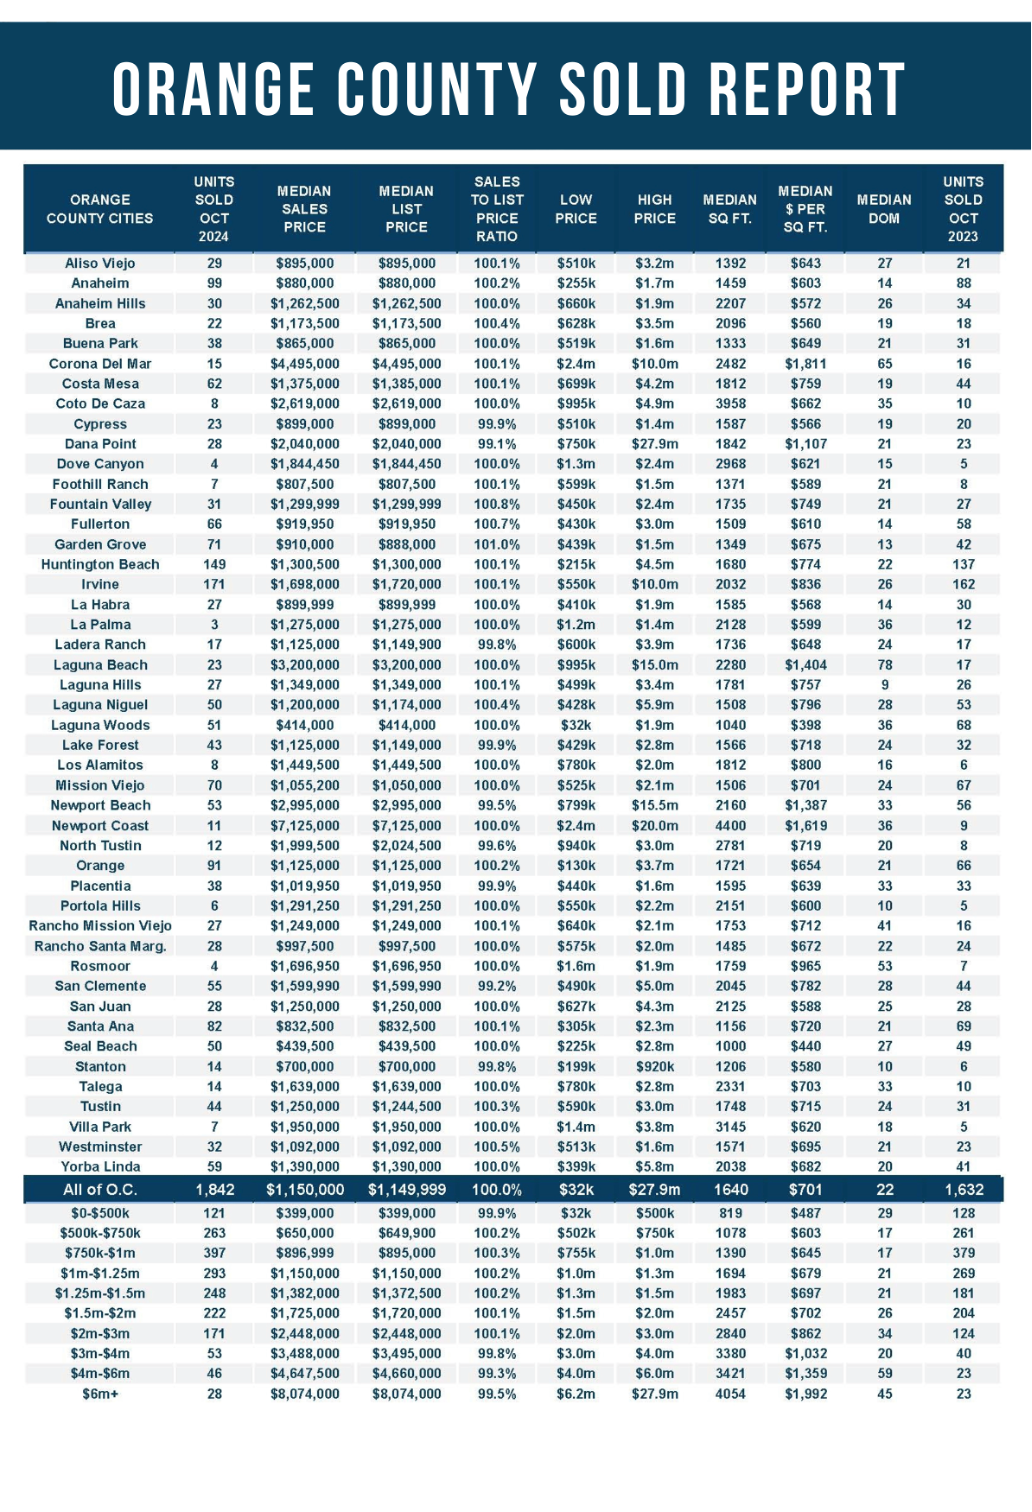
- There were 1,842 closed residential resales in October, up 13% compared to October 2023’s 1,632 and up 14% from September 2024. The sales-to-list price ratio was 100.0% for Orange County. Foreclosures accounted for 0.1% of all closed sales, and there were no short sales. That means that 99.9% of all sales were good ol’ fashioned sellers with equity.
Have a great week.
Sincerely,
Steven Thomas
Quantitative Economics and Decision Sciences
Copyright 2024—Steven Thomas, Reports On Housing—All Rights Reserved. This report may not be reproduced in whole or in part without express written permission from the author.