October 13, 2025
Far too many sellers do not spend enough time carefully pricing their homes before coming on the market, and ultimately walk away with less money and take a lot longer to sell.
It All Boils Down to Price
The data illustrates a clear trend: the greater the price reduction, the lower the seller’s net proceeds and the longer the home remains on the market.
Farmers’ Markets are the new craze, with their pop-up tents and a vibrant array of fresh seasonal produce, meats, fish, baked goods, honey, preserves, and handmade crafts. The colorful displays of seasonal fruit are often picked within hours of the markets’ opening, offering incredible flavors and freshness. Yet, sometimes they set the price of fruit too high, which deters too many shoppers from making a purchase. When too much fruit sits until it starts to spoil, the price is lowered, often at a heavy discount, to move it. Ultimately, they earn less than they would have if they had priced it correctly when it was fresh and appealing.
Similarly, when a homeowner initially comes on the market after pounding the FOR SALE sign in the yard, the home is fresh to the market. Yet, when a home is overpriced, it deters many buyers from making an offer or even touring the house. It sits on the market with waning activity. When the price is finally adjusted, it is not met with the same fanfare as when it initially came on the market. Instead, it is sold at a discount. Like the fruit that starts to spoil, the homeowner ultimately earns less than they would have if they had priced their home correctly when it was fresh to the market.
Too many sellers in Orange County are initially listing their properties at too high a price. They then have to adjust the asking price to secure a buyer willing to write a purchase offer. The data indicates that starting overpriced and then reducing it results in the seller walking away with less money. The sales price to last list price ratio is very revealing. This refers to the final list price before becoming a pending sale. These are averages, meaning there are exceptions, but the overall trend is astonishing. In Orange County, 66% of all closed sales in September did not reduce the asking price. It was 80% in March. The sales price to last list price ratio for these homes was 98.4%, meaning, on average, a home appropriately priced sold close to its initial asking price. A house listed at $1 million sold for $984,000, $16,000 below the asking price. The median days on the market before becoming a pending sale was only 16, indicating that accurate pricing also means considerably less time on the market.
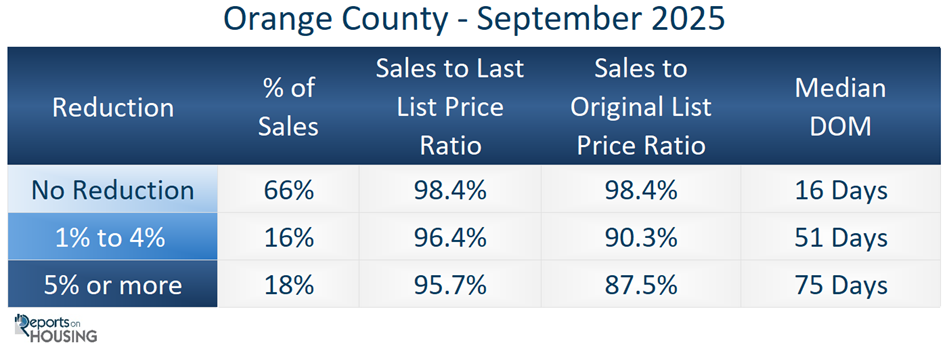
16% of all closed sales reduced their asking prices between 1% and 4%. The sales-to-last list price ratio for these homes was 96.4%; on average, it took 51 days to become a pending sale, nearly two months. A house that reduced its list price to $1 million sold for $964,000, a considerable $20,000 less than the homeowners with no reduction.
For homes that reduced their asking prices by 5% or more, 18% of closed sales in September, the sales-to-last list price ratio was 95.7% after being on the market for 75 days. A home that finally reduced its price to $1 million sold for $957,000, a staggering $27,000 less than the homeowners who did not need to reduce the asking price.
The sales price to original list price ratio reveals the difference between a home’s original asking price and the value buyers are ultimately willing to pay. This is the price of a home when it initially comes on the market before any price reductions. For homes that reduced the asking price between 1% and 4%, the sales price to original list price ratio was 95.1%. For example, a house initially listed at $1,068,000 had to reduce the asking price to $1 million to secure success and ultimately sold for $964,000, an astonishing $104,000 less than the original price.
Homes that reduced the asking price by at least 5% had a sales-to-original list price ratio of 87.5%. A house initially listed at $1,094,000 had to lower the asking price, often more than once, to $1 million to find success, and ultimately sold for $957,000. That is an overwhelming $137,000 less than the original asking price.
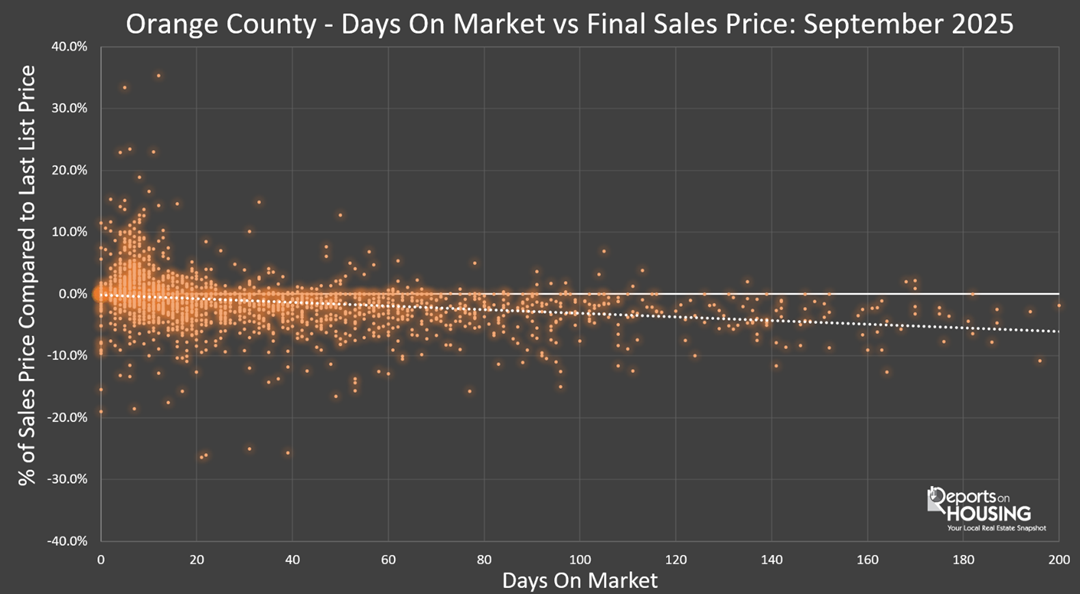
The scatter chart below shows all September closed sales in Orange County. Each dot represents a closed sale. Homeowners who meticulously arrived at the asking price had a substantially higher chance of selling quickly and very close to their asking price, often at or above the asking price. Sellers who were exposed to the market for a long time ultimately had to adjust the price. For the most part, even after dropping the asking price, sellers accepted an offer below their final list price. The dotted line represents the trend line, illustrating how a home’s final sales price typically drops as it sits on the market longer.
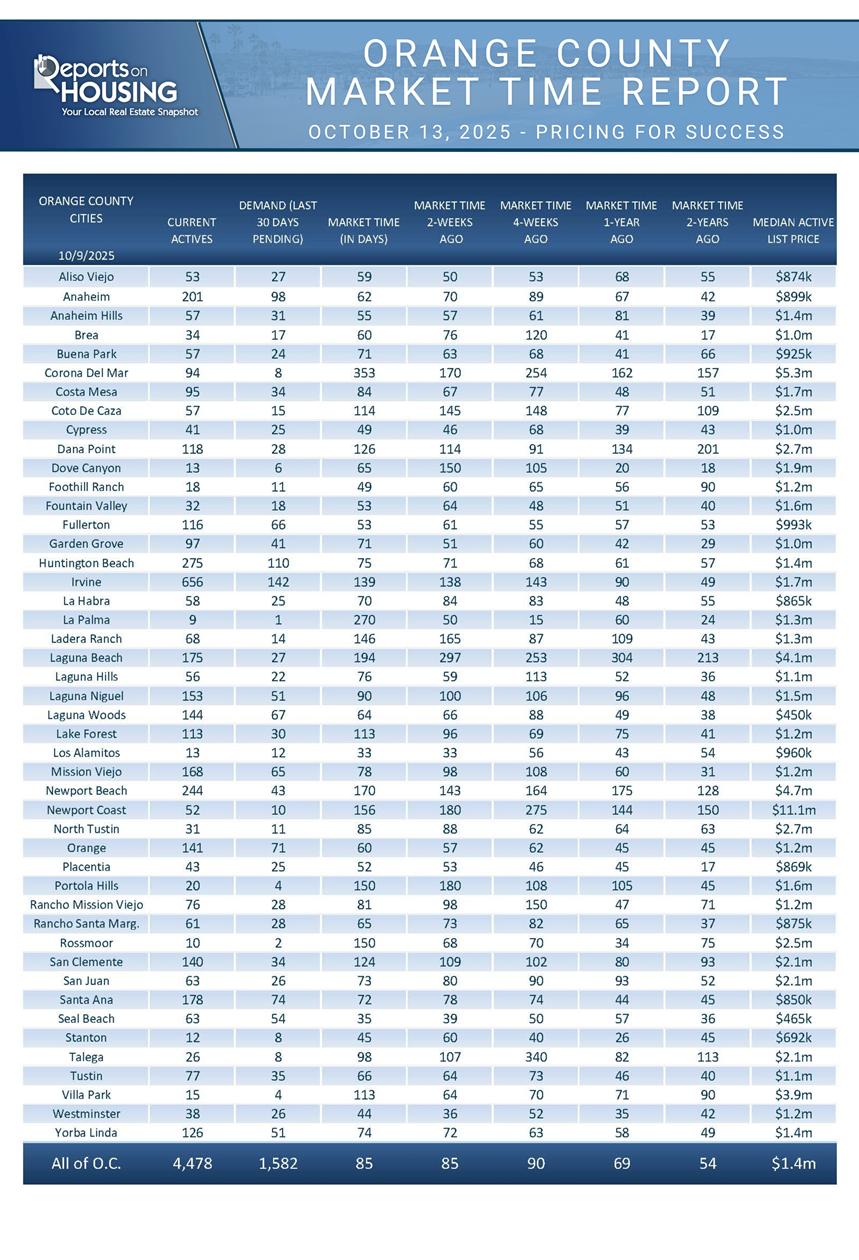
Setting an accurate initial asking price is one of the most critical steps for a seller to secure an interested buyer and achieve a successful home sale outcome. That does not mean adding a little bit extra to the price to leave room for negotiations. This is also not the year to “test the market” and attempt to see if the market will pay a much higher, unrealistic premium price for a home. There is too much seller competition, and the market is moving at its slowest October pace since 2019. There are currently 4,478 homes on the market, 21% more than last year’s 3,694, and 86% more than 2023’s 2,408 homes. Today’s Expected Market Time is 85 days, compared to 69 days last year and 54 days two years ago.
Most buyer activity occurs during the first 10 days a home is listed FOR SALE. Sellers only get one opportunity for this initial first impression. Buyers are waiting on the sidelines for anything new that hits the market. They examine every photo and all the details, including bedrooms, bathrooms, square footage, condition, upgrades, location, lot size, amenities, year built, garages, storage, and view. Yet, the price is by far the most important. Buyers decide whether or not to see a home based on its price.
It is revealing how 42% of all active listings have reduced the asking price at least once. Many sellers mistakenly expect a noticeable boost in showing activity after lowering the asking price. When a seller reduces the asking price, it is not met with the same level of anticipation and excitement as when it was initially placed on the market.
Today’s market is not instant. Sellers must price their home for success by scrutinizing every comparable pending and recent closed sale, carefully arriving at a home’s Fair Market Value.
Active Listings
The inventory dropped by 2% in the past couple of weeks.
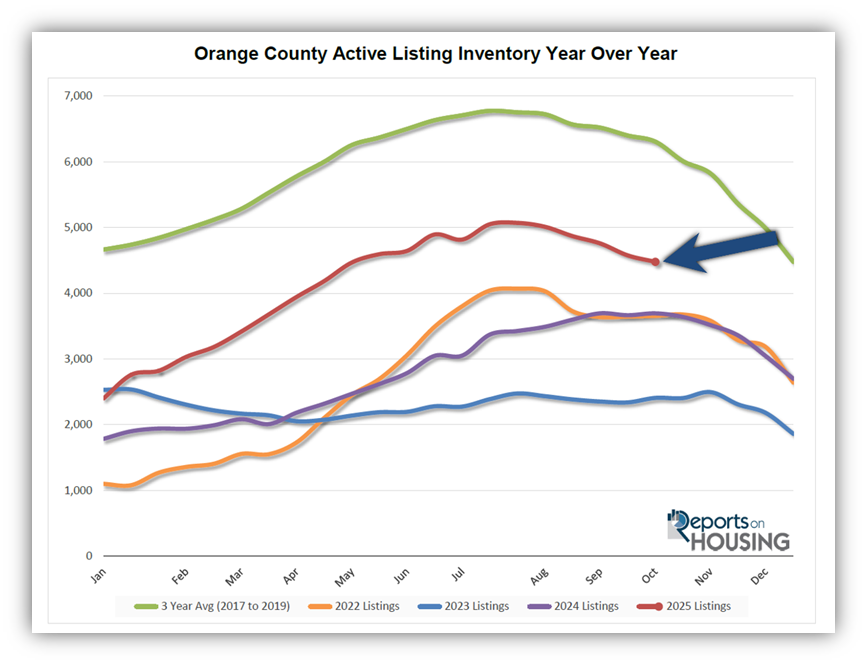
The active listing inventory decreased by 98 homes over the past two weeks, representing a 2% decrease, and now stands at 4,478, its lowest level since the start of May. It is October, the middle of the Fall Market, when inventory and demand typically drop at similar rates. The inventory has continuously dropped ever since it peaked at the end of July, shedding 12% or 593 homes. It will continue to fall for the remainder of the year and will even pick up steam in mid-November, as housing transitions to the Holiday Market. The fewest homes come on the market in December, and the second fewest in November. Additionally, many unsuccessful sellers give up and remove their homes from the market. As a result, the inventory declines rapidly to close out the year.
Last year, the inventory was at 3,694 homes, 18% lower, or 784 fewer. The 3-year average before COVID (2017-2019) was 6,306, an additional 1,828 homes, or 41% more.
Homeowners continue to “hunker down” in their homes, unwilling to move due to their current underlying, locked-in, low fixed-rate mortgage. This trend has been easing from the lows established in 2023. Through September, 24,066 homes were placed on the market in Orange County, 8,347 fewer than the 3-year average before COVID (2017-2019), 26% less. In 2024, 21,845 homes entered the market, compared to 18,773 in 2023. More sellers are opting to sell in 2025. Yet, for the second month in a row, the number of homes coming on the market was fewer compared to the prior year. In September, 2,211 homes came on the market, 4% less than last year’s 2,303.
Demand
Demand decreased by 2% in the past couple of weeks.
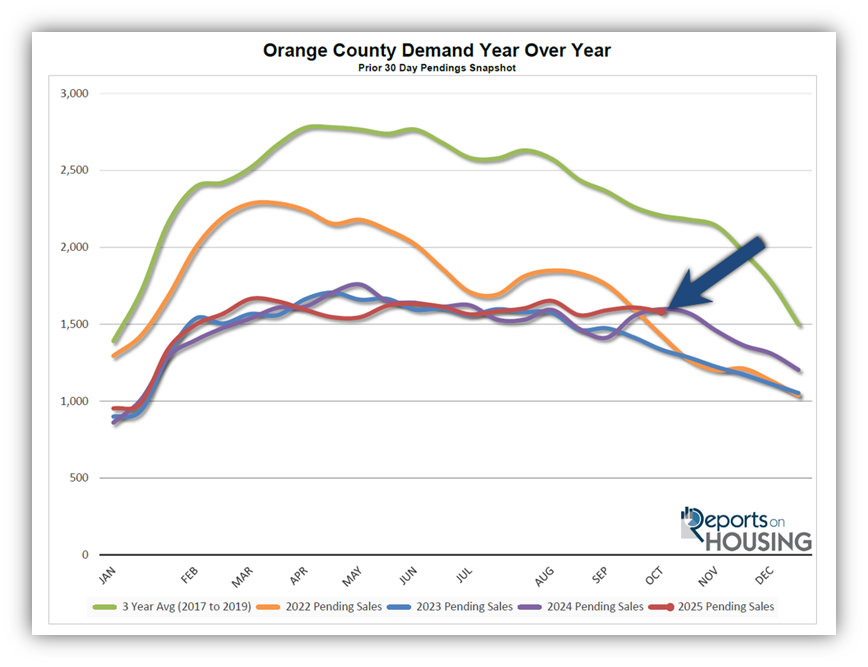
Demand, a snapshot of the number of new pending sales over the prior month, decreased from 1,609 to 1,582 in the past couple of weeks, representing a 27-pending-sale drop, or 2%. Demand is similar to last year when rates dropped below 6.5% for 47 days. Today’s demand is much higher than in 2022 and 2023 when rates eclipsed 7% and even touched 8% on October 23, 2023. According to Mortgage News Daily, rates are at 6.32%. They have been below 6.5% for 40 days, and unlike last year, they do not appear to be going higher anytime soon. They have been moving sideways ever since the start of the government shutdown. There is a notable absence of economic data, particularly the weekly initial jobless claims and the extremely critical jobs report, which was supposed to be released on October 3rd. The labor market was already weakening and could have led to a further drop in mortgage rates. Nonetheless, it appears that these lower rates are here to stay, which has improved affordability and had an impact on demand. The lower the rates fall, the stronger the effect. For now, demand is expected to decline slowly, at a pace slower than the active inventory.
Last year, demand was 1,554, with 55 fewer pending sales, or 3% less. The 3-year average before COVID (2017-2019) was 2,262 pending sales, 41% higher than today, representing an additional 653 pending sales.
As the Federal Reserve has indicated, it is essential to watch all economic releases for signs of slowing. That is the only path to lower mortgage rates at this time. These releases can cause mortgage rates to move higher or lower, depending on how they compare to market expectations. Yet, with the government shutdown, most critical data will not be released until the shutdown is resolved. The Labor Department is bringing back staff to work on a key consumer inflation report, CPI. It was initially supposed to come out on the 15th, but has been postponed until October 24th. Until then, in the absence of data, rates will not move much.
Expected Market Time
The Expected Market Time has remained unchanged over the past couple of weeks.
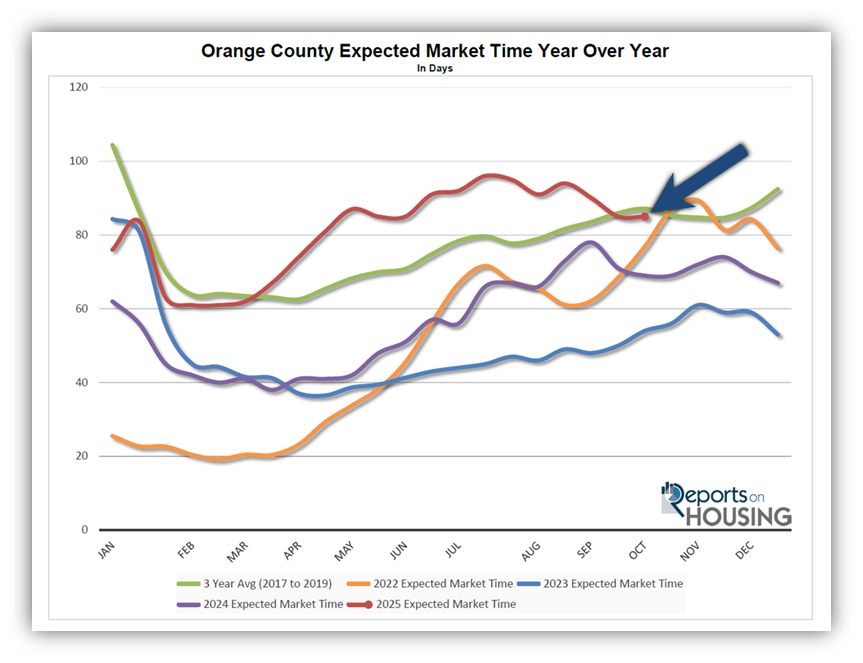
With the supply of available homes falling by 98 homes, down 2%, and demand dropping by 27 pending sales, down 2%, the Expected Market Time (the number of days it takes to sell all Orange County listings at the current buying pace) remained unchanged at 85 days in the past couple of weeks, its highest October reading since 2019, before the pandemic.
Last year, it was 69 days, faster than today. The 3-year average before COVID was 87 days, similar to today.
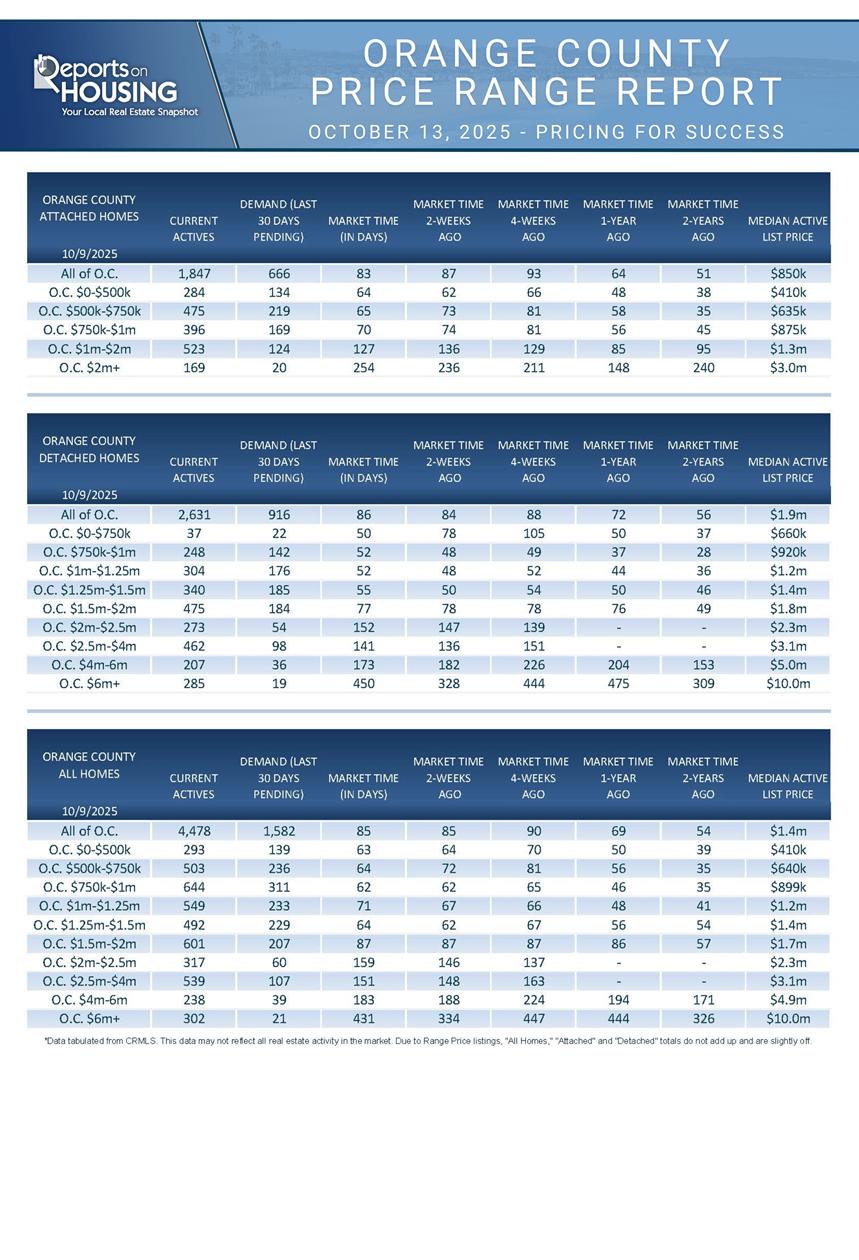
The Expected Market Time for condominiums and townhomes decreased from 87 to 83 days in the past two weeks. It was at 64 days last year. For detached homes, the Expected Market Time increased from 84 to 86 days. It was 72 days a year ago. The attached home market is slightly stronger than the detached home market.
Luxury End
The luxury market slowed slightly over the past couple of weeks.
The luxury inventory of homes priced above $2.5 million (the top 10% of the Orange County housing market) decreased from 1,135 to 1,079 homes, a decline of 56 homes, or 5%. Luxury demand decreased by 15 pending sales, down 8%, and now stands at 167. The Expected Market Time for luxury homes priced above $2.5 million increased from 187 to 194 days. The government shutdown and market uncertainty have stopped the recent improvements in the luxury market.
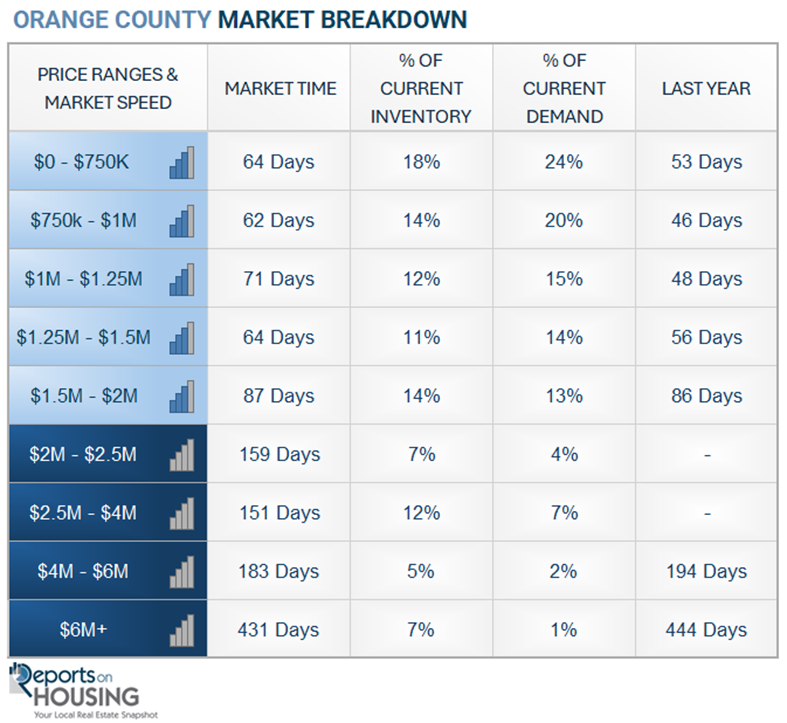
In the past two weeks, the Expected Market Time for homes priced between $2.5 million and $4 million increased from 148 to 151 days. For homes priced between $4 million and $6 million, the Expected Market Time decreased from 188 to 183 days. For homes priced above $6 million, the Expected Market Time increased from 334 to 431 days. Luxury is at 194 days overall. At this pace, a seller would be looking at becoming a pending sale around April 2026.
Orange County Housing Summary
- INVENTORY: The active listing inventory in the past couple of weeks decreased by 98 homes, down 2%, and now stands at 4,478. Last year, there were 3,694 homes on the market, 784 fewer homes, or 18% less. The 3-year average before COVID (2017-2019) was 6,306, which is 41% higher. From January through September, 26% fewer homes came on the market compared to the 3-year average before COVID (2017-2019), 8,347 less. Yet, 2,221 more sellers came on the market this year than last, and 5,333 more compared to 2023.
- DEMAND: Buyer demand, the number of pending sales over the prior month, increased by 18 homes, up 1%, and now stands at 1,609, its highest level since the end of March. Last year, there were 1,591 pending sales, 3% lower than today. The 3-year average before COVID (2017-2019) was 2,262, which is 41% higher.
- MARKET TIME: With inventory and demand falling at a similar pace, the Expected Market Time, the number of days to sell all Orange County listings at the current buying pace, remained unchanged at 86 days in the past couple of weeks. It is the highest October level since 2019. Last year, it was 69 days, slightly faster than today. The 3-year average before COVID (2017-2019) was 87 days, similar to today.
- LUXURY: In the past two weeks, the Expected Market Time for homes priced between $2.5 million and $4 million increased from 148 to 151 days. For homes priced between $4 million and $6 million, the Expected Market Time decreased from 188 to 183 days. For homes priced above $6 million, the Expected Market Time increased from 334 to 431 days.
- DISTRESSED HOMES: Short sales and foreclosures combined, comprised only 0.2% of all listings and 0.3% of demand. Only four foreclosures and three short sales are available today in Orange County, with a total of seven distressed homes on the active market, down one from two weeks ago. Last year, five distressed homes were on the market, similar to today.
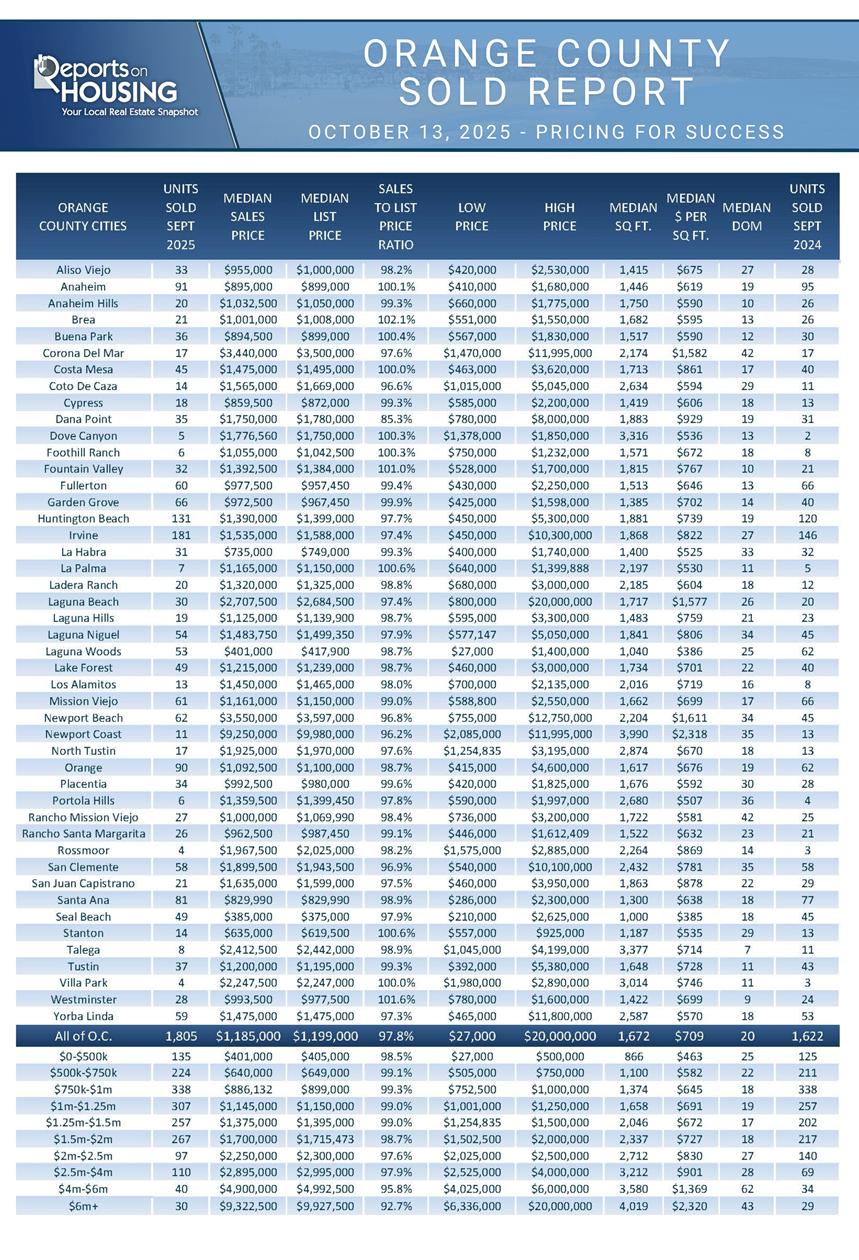
- CLOSED SALES: There were 1,805 closed residential resales in September, 11% higher than September 2024’s 1,622 sales, but down 4% from August 2025. The sales-to-list price ratio was 97.8% for Orange County. Foreclosures accounted for 0.2% of all closed sales, and there were no short sales. That means that 99.8% of all sales were sellers with equity.
Have a great week.
Sincerely,
Steven Thomas
Quantitative Economics and Decision Sciences
Copyright 2025—Steven Thomas, Reports On Housing—All Rights Reserved. This report may not be reproduced in whole or in part without express written permission from the author.