September 15, 2025
The lowest mortgage rates of the year are paving the way for a much different Fall Market with a falling inventory, increasing demand, and declining market times.
Fall Market Expectations
Rates have slowly made their way from just over 7% for the first couple of months of the year to nearly 6.25% today, paving the way for a bump in buyer demand.
Anyone who has taken up running knows that initially it is hard to run that far. A great strategy is to simply run a mile consistently for a couple of weeks, and then slowly ramp up the mileage. Going from a mile to a mile-and-a-half, from a mile-and-a-half to two miles, and then from two miles to three miles over the course of many weeks allows the body to adjust to the increasing demands of longer distance workouts. The consistency and slow progression build endurance, allowing a novice runner to run farther and farther distances. This approach is not instant; it does not happen overnight. Instead, over time, the new runner slowly improves.
Mortgage rates have reached their lowest level of the year, nearly 6.25%. It too did not happen overnight. They started the year at just above 7% and eclipsed 7.25% in mid-January. Mortgage rates tend to fluctuate from week to week, yet the trend has been for rates to improve slowly from month to month. They have been consistently below 7% since the end of May. They dropped below 6.75% at the start of August, and then dropped below 6.5% at the beginning of September. With weaker job numbers, they have settled close to 6.25%. Over time, mortgage rates have slowly improved.
These lower mortgage rates have arrived just as the housing market transitioned from the Summer Market to the Autumn Market. In real estate, the Autumn Market spans from the beginning of September, with the last hurrah of summer, Labor Day, and runs through mid-November, the week before Thanksgiving. Typically, in Orange County, this is the time of year when the supply of available homes slowly decreases, along with a corresponding slow decline in buyer demand. With both supply and demand falling at a similar pace, the Expected Market Time does not change much.
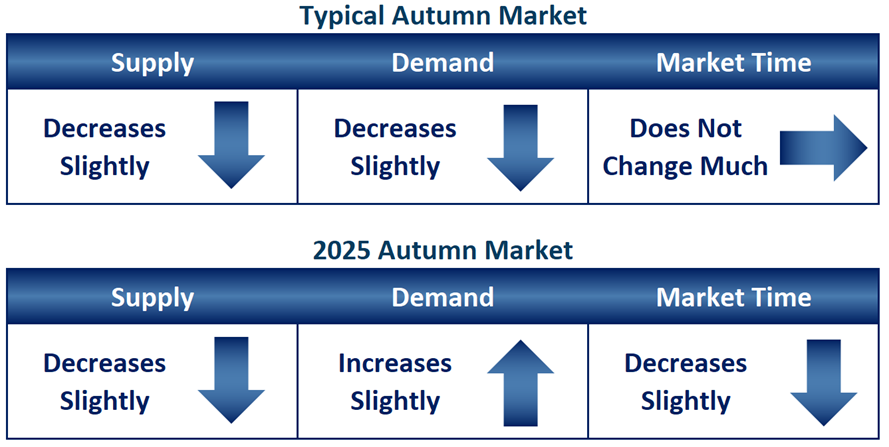
This year, with mortgage rates at their lowest level since last October, the Autumn Market is looking a bit different. Although inventory will gradually decline, as it usually does, demand is set to rise. Typically, fall does not bring stronger demand, but years of limited affordability have kept buyers on the sidelines. As rates and affordability improve, buyer demand will grow. With a declining supply and rising demand, the Expected Market Time will improve, and the market will speed up.
Last year was a similar story. Rates dropped below 6.5% at the end of August 2024 for the first time since May 2023. They bounced between 6% and 6.5% for 47 days, through the start of October. Demand (a snapshot of the number of new pending sales over the prior month) grew from 1,413 in mid-September to 1,598 in mid-October, an unprecedented 13% rise. The inventory remained unchanged. The Expected Market Time (the number of days it takes to sell all Orange County listings at the current buying pace) dropped from 78 days, its highest level of the year, to 69 days, a substantial improvement seemingly overnight.
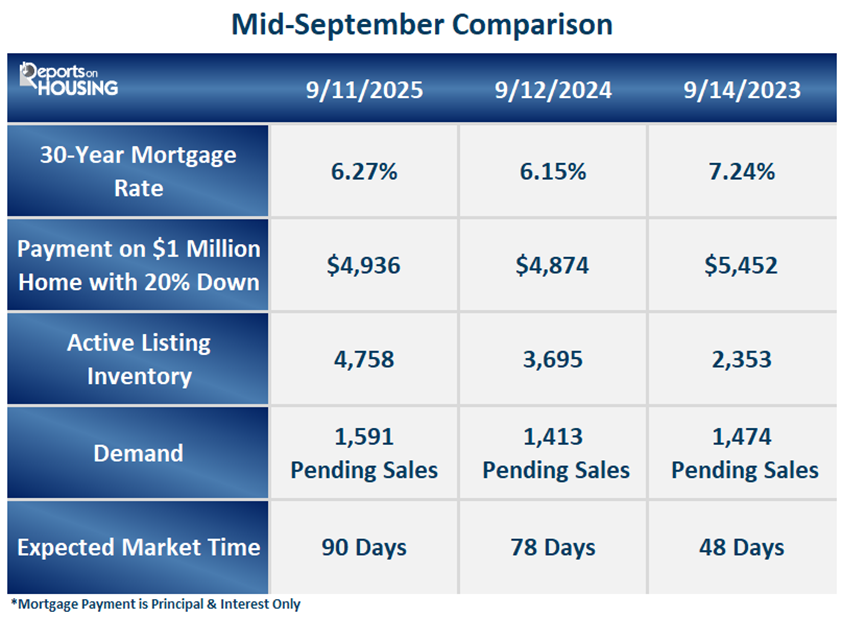
Mortgage rates are at 6.27% as of September 11th. For a $1 million home purchase with 20% down, the monthly payment would be $4,936. That is similar to last year’s 6.15% and $4,874 monthly payment, only $62 per month higher. In 2023, rates were nearly a whole percentage point higher at 7.24% and climbing. The $1 million home purchase would be a $5,452 payment, a considerable $516 per month higher than today, or nearly $6,200 per year.
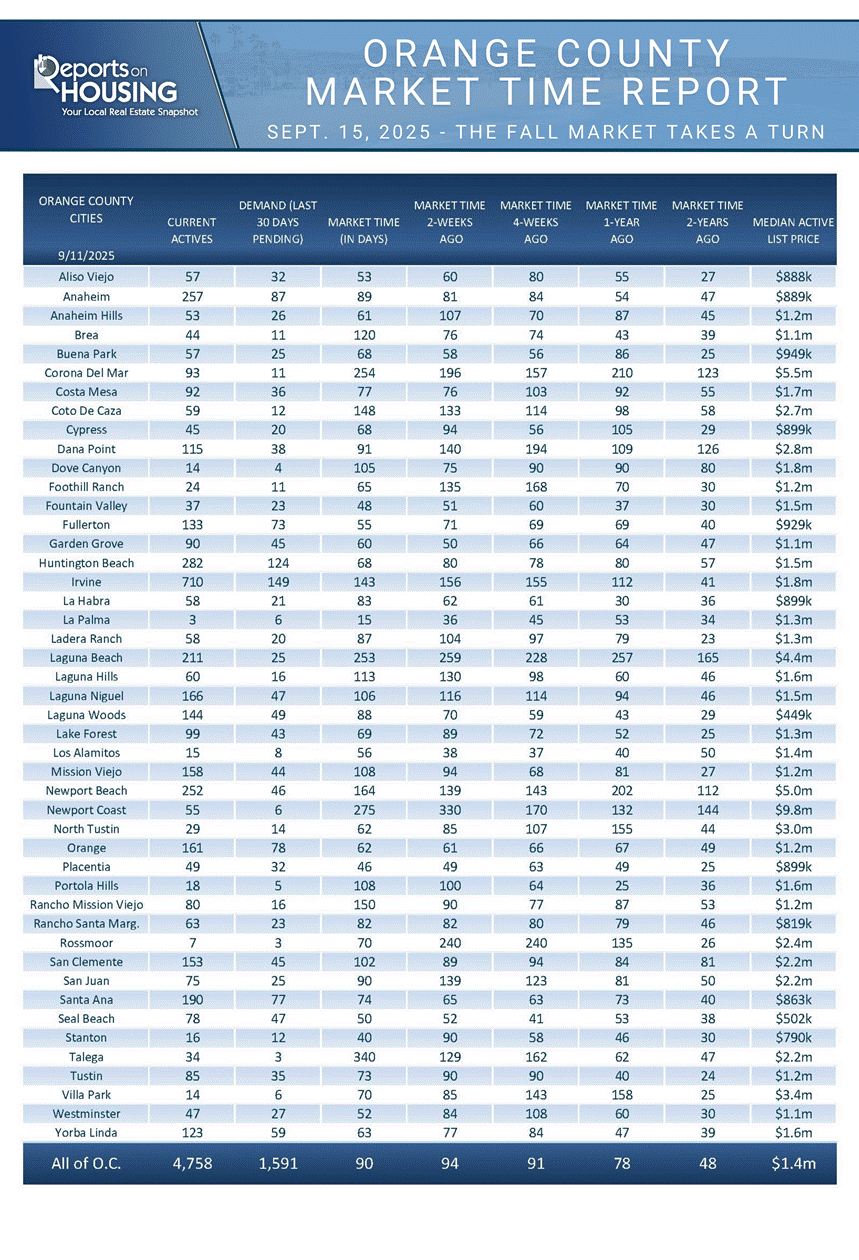
Demand is currently at 1,591 pending sales, having risen by 2% over the past couple of weeks. That is 13% higher than last year’s 1,431 pending sales, and 8% higher than 2023’s 1,474 level. This year, there are significantly more homes to choose from compared to the last couple of years, with 4,758 available today versus 3,695 last year, representing a 29% increase. The inventory has more than doubled since two years ago, when there were only 2,353 homes on the market. Today’s Expected Market Time is at 90 days, contrasted to last year’s 78 days, and 2023’s 48 days. The overall market is slower this year due to increased competition among sellers.
Lower mortgage rates improve affordability, and, with duration, they fuel an increase in buyer demand. This year, demand is poised to repeat last year’s uncharacteristic autumn surge. It appears that rates will remain below 6.5% for several months, a period significantly longer than last year’s brief reprieve from the higher mortgage rate environment. And the inventory is already slowly falling. With the inventory falling and demand rising, the Expected Market Time is primed to fall. The Autumn Market will be a turning point for the Orange County housing market. The longer rates remain below 6.5%, the more pronounced the change.
Active Listings
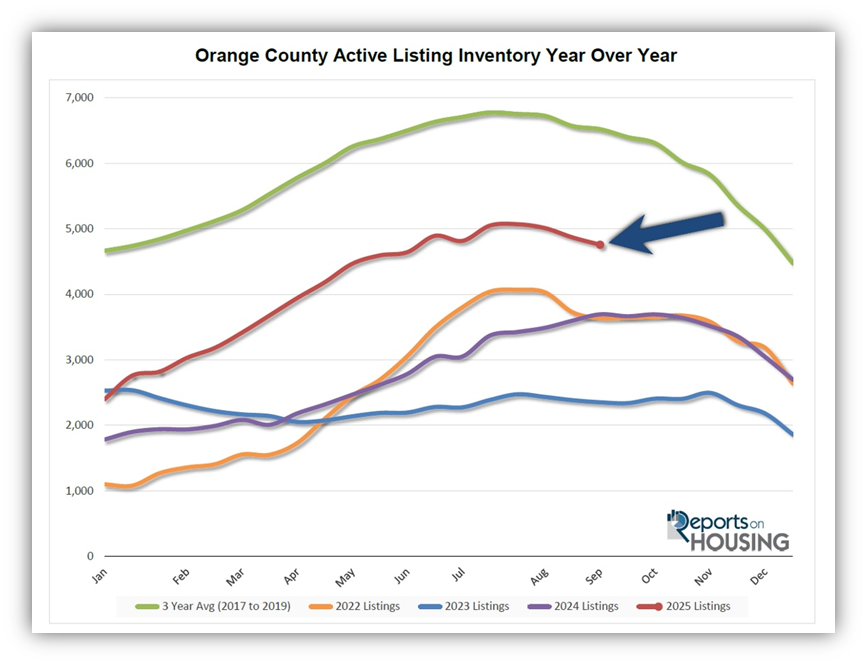
The inventory decreased by 111 homes in the past couple of weeks, its second-largest drop of the year.
The active listing inventory decreased by 111 homes over the past two weeks, representing a 2% decrease, and now stands at 4,758, its lowest level since June. Following the July 31st peak in the inventory, the number of available homes has dropped by 6%, or 313 homes. The inventory will slowly fall throughout the Autumn Market, from September through the week before Thanksgiving. With rates falling to their lowest level since last October, the pickup in demand will further erode the active inventory at a faster clip as long as rates remain below 6.5%. The decline will accelerate during the Holiday Market, from mid-November through the ringing in of a New Year.
Last year, the inventory was at 3,695 homes, 22% lower, or 1,063 fewer. The 3-year average before COVID (2017-2019) was 6,520, an additional 1,762 homes, or 37% more.
Homeowners continue to “hunker down” in their homes, unwilling to move due to their current underlying, locked-in, low fixed-rate mortgage. This trend has been easing from the lows established in 2023. Through August, 21,823 homes were placed on the market in Orange County, 7,561 fewer than the 3-year average before COVID (2017-2019), 26% less. In 2024, only 19,542 homes entered the market, and in 2023, it was only 16,770. More sellers are opting to sell in 2025. Yet, for the first time since November 2023, fewer homes came on the market compared to the prior year. In August, 2,363 homes came on the market, 5% less than last year’s 2,490.
Demand
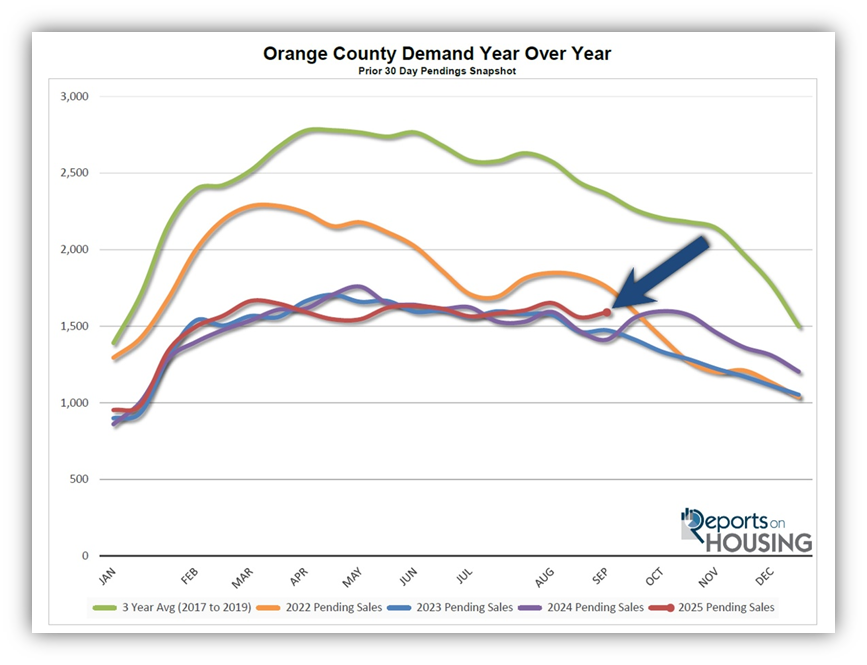
Demand increased by 2% in the past couple of weeks.
Demand, a snapshot of the number of new pending sales over the prior month, increased from 1,559 to 1,591 in the past couple of weeks, representing a 32-pending-sale rise, or 2%. Mortgage rates dropped below 6.5% for the first time since the start of October 2024 and have remained entrenched close to 6.25%. Affordability has dramatically improved over the course of the year, substantially lower than this year’s mid-January height at 7.26%. The current lower mortgage rate environment is a repeat of last year’s 47 days between 6% and 6.5%, which led to elevated demand for the remainder of
the year. The glaring difference in comparing this year to last is that the job sector of the economy today is much weaker and appears to be at a breaking point, where the Federal Reserve will have to step in. As a result, the pressure for lower rates is building, meaning mortgage rates could remain below 6.5% for the foreseeable future. This will ultimately lead to increasing, elevated demand and will allow the housing market to begin to thaw.
Last year, demand was 1,413, with 178 fewer pending sales, or 11% less. The 3-year average before COVID (2017-2019) was 2,363 pending sales, 49% higher than today, representing an additional 772 pending sales.
As the Federal Reserve has indicated, watching all economic releases for signs of slowing is essential. That is the only path to lower mortgage rates at this time. These releases can cause mortgage rates to move higher or lower, depending on how they compare to market expectations. This week, the Federal Reserve meets and will conduct a press conference to announce its decision on the Federal Funds rate. It will ultimately reveal its appetite to cut rates for the remainder of 2025 and into 2026. Next week, the Personal Consumption Expenditures – Price Index (PCE), the Fed’s preferred inflation gauge, will be released on Friday. It will be a pivotal two weeks for mortgage rates.
Expected Market Time
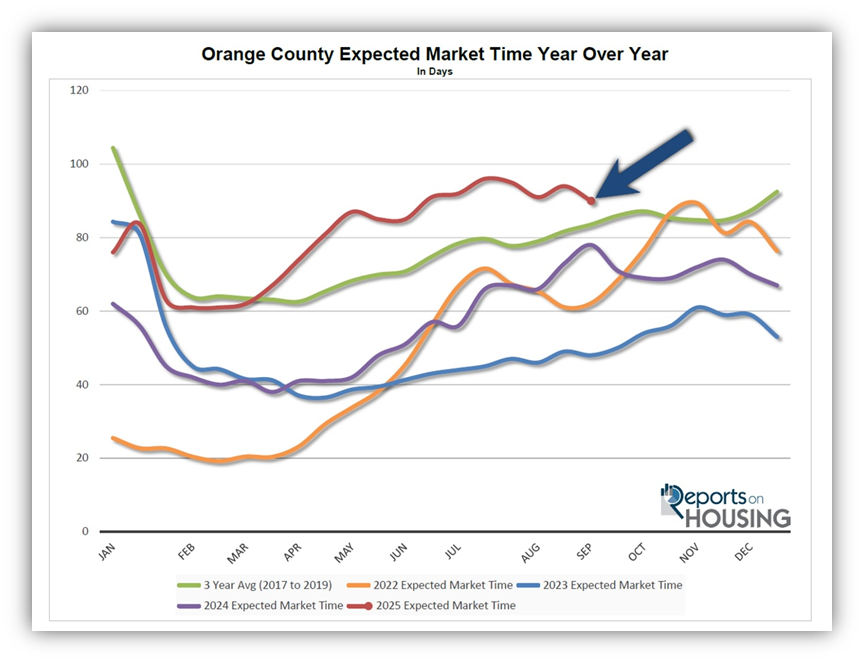
The Expected Market Time dropped to its lowest level since June.
With the supply of available homes falling by 111 homes, down 2%, and demand rising by 32 pending sales, up 2%, the Expected Market Time (the number of days it takes to sell all Orange County listings at the current buying pace) decreased from 94 to 90 days in the past couple of weeks, its lowest level since the beginning of June. Yet, 90 days is the highest mid-September reading since 2018.
Last year, it was 78 days, slightly faster than today. The 3-year average before COVID was 84 days, which is also a bit quicker than today.
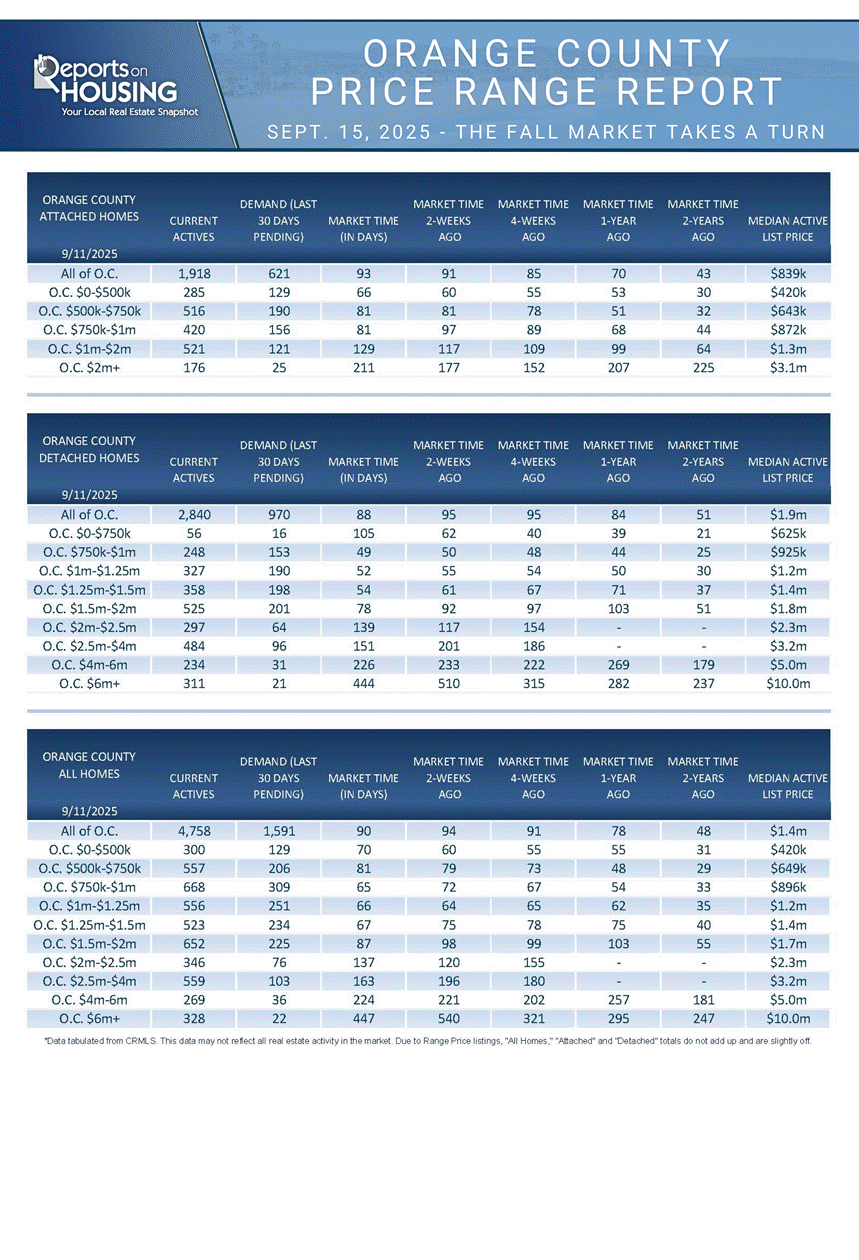
The Expected Market Time for condominiums and townhomes increased from 91 to 93 days in the past two weeks. It was at 70 days last year. For detached homes, the Expected Market Time decreased from 95 to 88 days. It was 84 days a year ago. The detached home market is stronger than the attached home market.
Luxury End
The luxury market improved dramatically over the past couple of weeks.
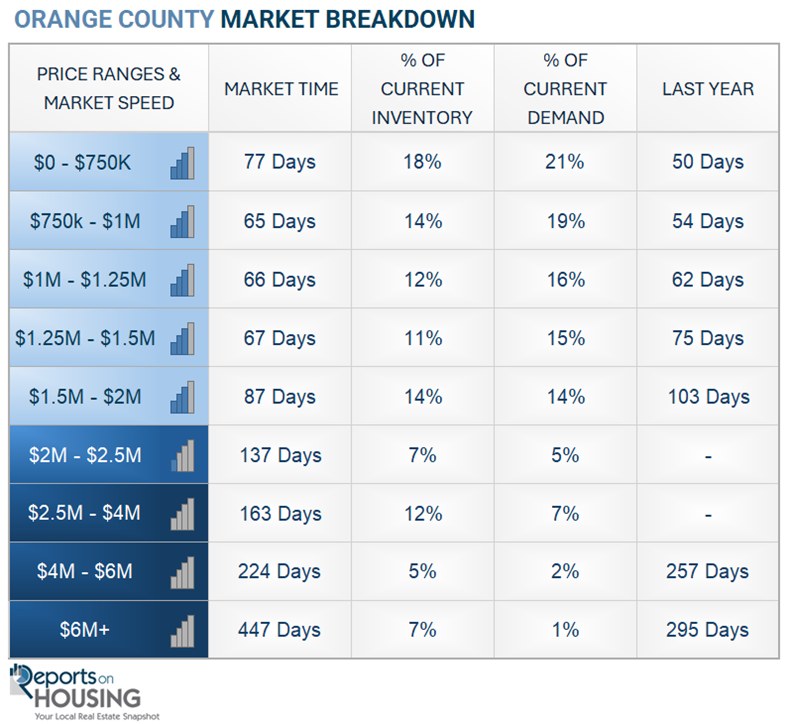
The luxury inventory of homes priced above $2.5 million (the top 10% of the Orange County housing market) decreased from 1,189 to 1,156 homes, a decline of 33 homes, or 3%. Luxury demand increased by 17 pending sales, up 12%, and now stands at 161. The Expected Market Time for luxury homes priced above $2.5 million dropped from 248 to 215 days, nearly reaching the 211-day level last seen a month ago. It will be interesting to see the direction of the luxury market as overall housing demand accelerates with mortgage rates falling to their lowest level since last October.
In the past two weeks, the Expected Market Time for homes priced between $2.5 million and $4 million decreased from 196 to 163 days. For homes priced between $4 million and $6 million, the Expected Market Time increased from 221 to 224 days. For homes priced above $6 million, the Expected Market Time decreased from 540 to 447 days. Luxury is at 215 days overall. At this pace, a seller would be looking at becoming a pending sale around April 2026.
Orange County Housing Summary
- INVENTORY: The active listing inventory in the past couple of weeks decreased by 111 homes, down 2%, and now stands at 4,758, its second largest drop of the year. After peaking on July 31st, the inventory has continued to descend slowly. Last year, there were 3,695 homes on the market, 1,063 fewer homes, or 22% less. The 3-year average before COVID (2017-2019) was 6,520, which is 37% higher. From January through August, 26% fewer homes came on the market compared to the 3-year average before COVID (2017-2019), 7,561 less. Yet, 2,281 more sellers came on the market this year than last, and 5,053 more compared to 2023.
- DEMAND: Buyer demand, the number of pending sales over the prior month, increased by 32 homes, up 2%, and now stands at 1,591. Last year, there were 1,413 pending sales, 11% lower than today. The 3-year average before COVID (2017-2019) was 2,363, which is 49% higher.
- MARKET TIME: With inventory falling and demand rising, the Expected Market Time, the number of days to sell all Orange County listings at the current buying pace, decreased from 94 to 90 days in the past couple of weeks, its lowest level since June. Yet, it is still the highest mid-September level since 2018. Last year, it was 78 days, slightly faster than today. The 3-year average before COVID (2017-2019) was 84 days, which is also a bit quicker than today.
- LUXURY: In the past two weeks, the Expected Market Time for homes priced between $2.5 million and $4 million decreased from 196 to 163 days. For homes priced between $4 million and $6 million, the Expected Market Time increased from 221 to 224 days. For homes priced above $6 million, the Expected Market Time decreased from 540 to 447 days.
- DISTRESSED HOMES: Short sales and foreclosures combined, comprised only 0.2% of all listings and 0.2% of demand. Only six foreclosures and three short sales are available today in Orange County, with a total of nine distressed homes on the active market, up two from two weeks ago. Last year, seven distressed homes were on the market, similar to today.
- CLOSED SALES: There were 1,875 closed residential resales in August, nearly identical to August 2024’s 1,877 sales, and down 3% from July 2025. The sales-to-list price ratio was 98.5% for Orange County. Foreclosures accounted for 0.2% of all closed sales, and short sales accounted for 0.1%. That means that 99.7% of all sales were sellers with equity.
Have a great week.
Sincerely,
Steven Thomas
Quantitative Economics and Decision Sciences
Copyright 2025—Steven Thomas, Reports On Housing—All Rights Reserved. This report may not be reproduced in whole or in part without express written permission from the author.