August 18, 2025
As negotiations lean more toward buyers, data and statistics will help set realistic expectations and guide them to a successful outcome in today’s market.
Knowing the Numbers
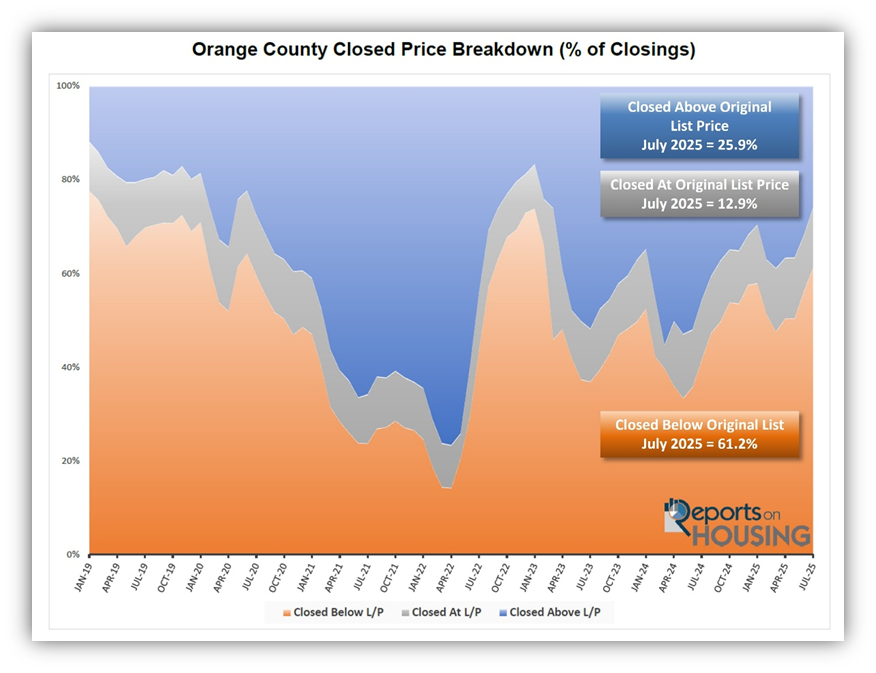
In July, 61% of all Orange County closed sales sold below their original list price, the highest level since February 2023.
Back in the 1990s, before navigation apps existed, driving around an unfamiliar area without a map often left many feeling completely turned around and lost. It was necessary to find a local gas station and purchase a map. Once that special guide was carefully unfolded, it was much easier to ascertain precisely where they needed to go to arrive at their desired location successfully.
Many buyers approach the market today without a proper roadmap. They rely on how they think today’s market should unfold without really knowing the facts. To help navigate the Orange County housing market effectively, they should carefully consider the best, most revealing roadmap: current data and statistics.
In July, 61.2% of all Orange County closed sales sold for below their original asking price. That is the highest level since February 2023, at 65.9%, when home affordability initially crumbled. Mortgage rates skyrocketed in 2022, from 3.25% in January to 7.37% in October of that year. Home buyer demand collapsed due to unaffordability, and the inventory rapidly rose; as a result, more homes sold below their original asking price. In April 2022, only 14% of all homes sold for less than their original asking price. That is when the limited number of homes on the market was flying off the market. It eclipsed 60% of closed sales in September 2022 as rates soared. The height was achieved in January 2023 at 73.8%. In July 2019, before the pandemic, when the housing market followed normal, cyclical trends, 69.8% of all sales closed below their original asking price, slightly higher than today.
A revealing 55% of all closed sales sold below their last list price (the final list price of a home when it became a pending sale). The median number of days on the market was 32 days. The median sales-to-last-list price ratio was 97.2%, indicating a sale 2.8% below the last list price. The median amount shaved off the asking price was $32,000.
But not everything is sold below the asking price. 12.9% sold at the original asking price, and the median time on the market was only eight days. An illuminating 25.9% sold for more than the original asking price with a median time on the market of eight days. The median amount paid above the asking price was $30,000.
Many are asking, “How in the world are that many homes selling above the asking price in today’s sluggish market?” It is a great question. Many homes that come on the market almost immediately become a pending sale. Homes that are priced right, in excellent condition, nicely upgraded, in turn-key condition, ready for an immediate move-in, and have a good location do not last long and acquire the most attention. Buyers who are entrenched in the market are often waiting for something outstanding to come along. When something pops up in an area that checks all the boxes, it frequently checks all the boxes for more than one buyer. When that occurs, buyers need to be prepared to write offers above the asking price. The market as a whole may be sluggish, but not for that one turnkey property when multiple buyers are vying for the same home, simple supply and demand kicks in. The buyer willing to pay the most is typically the buyer who wins.
When a buyer is interested in a home, they must consider all the data that is unique to that home:
- How long has the home been on the market?
- Has it been exposed to the market before?
- Has the price changed?
- How’s the condition, location, upgrades, and amenities?
- What is the home’s Fair Market Value based on the most recent comparable and pending sales?
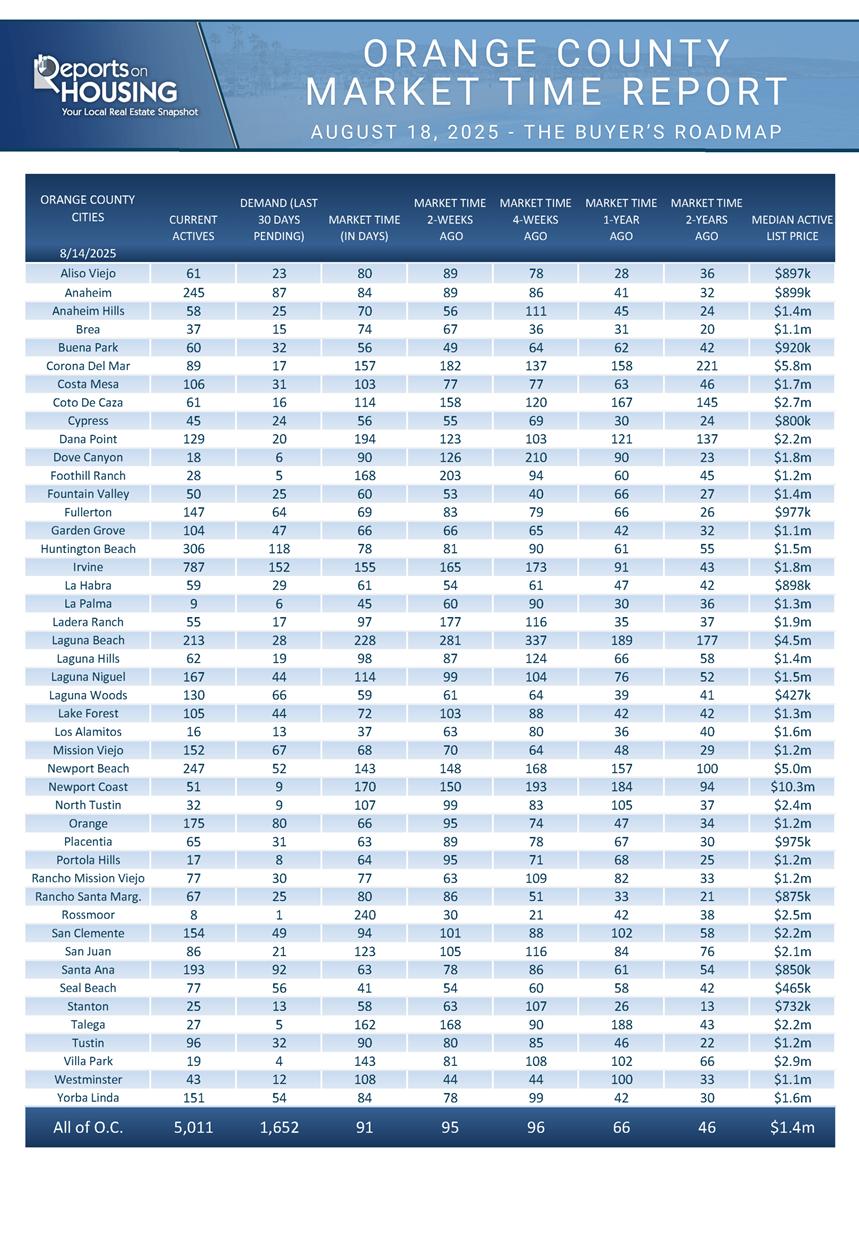
It is also crucial to understand the current local housing market. Some cities, areas, and neighborhoods are more desirable than others. In Orange County, as a whole, there are 5,011 homes on the market, and 40% reduced the asking price at least once. It appears that the inventory may have peaked a couple of weeks ago, so it will likely slowly fall for the remainder of the year. Demand (a snapshot of the number of new pending sales over the prior month) is currently at 1,652, not much different than the mid-March peak at 1,665 pending sales. It has been rising over the past month because interest rates have dropped to their lowest level of the year, improving affordability. The Expected Market Time (the number of days it takes to sell all Orange County listings at the current buying pace) is at 91 days, the highest level for mid-August since 2014, and significantly higher than last year’s 66 days or 2023’s 46 days. With improving rates, the Expected Market Time has been dropping recently. It was 96 days a month ago.
An Expected Market Time of 91 days means that many homes are not selling instantly. Homes that require work, have deferred maintenance, are in a poor location, lack updates and upgrades, or are overpriced will tend to linger on the market. These homes are excellent candidates for buyers looking to negotiate. As sellers languish on the market without success, they are more inclined to sharpen their pencils, dial back their expectations, and negotiate.
It is incumbent upon buyers to examine all the data, which serves as a roadmap to securing a home. Know the market. Know the stats. Know the property—every property for sale is unique.
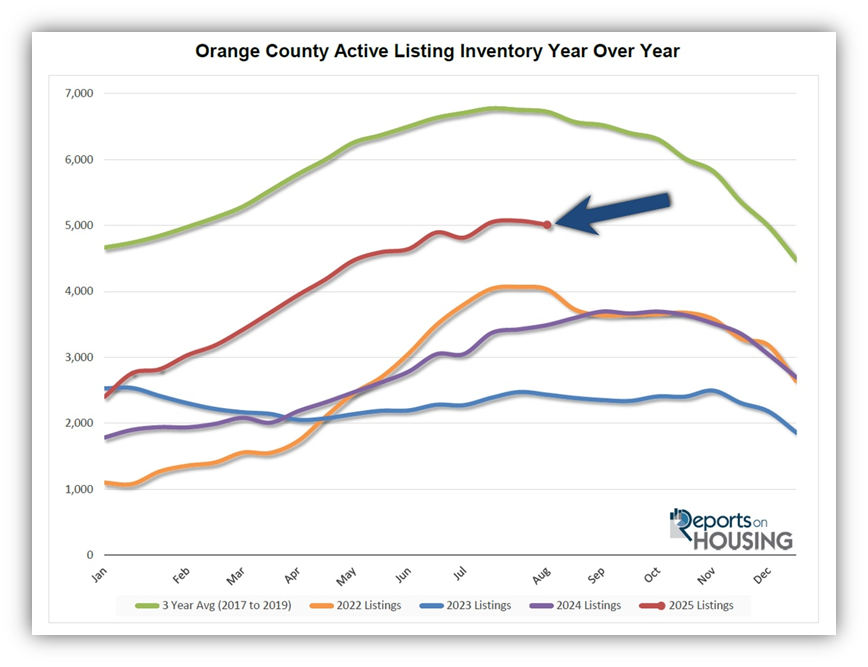
Active Listings
The inventory decreased by 60 homes in the past couple of weeks.
The active listing inventory decreased by 60 homes over the past two weeks, representing a 1% decrease, and now stands at 5,011. The Orange County peak may have been reached a couple of weeks ago, marking its first normal July-to-August peak since 2022. Over the past couple of years, climbing mortgage rates during the fall resulted in dropping demand, slower market times, and a growing inventory. Yet, Orange County may break out of that funk this year. The market is speeding up slightly as interest rates have improved to their lowest level of the year. The inventory stopped growing as demand improved. The pathway of the inventory depends upon the path of rates.
Last year, the inventory was at 3,490 homes, 30% lower, or 1,521 fewer. The 3-year average before COVID (2017-2019) was 6,723, an additional 1,712 homes, or 34% more.
Homeowners continue to “hunker down” in their homes, unwilling to move due to their current underlying, locked-in, low fixed-rate mortgage. This trend has been easing from the lows established in 2023. Through July, 19,477 homes were placed on the market in Orange County, 6,370 fewer than the 3-year average before COVID (2017-2019), 25% less. In 2024, only 17,052 homes entered the market, and in 2023, it was only 14,616. More sellers are opting to sell in 2025.
Demand
Demand increased by 3% in the past couple of weeks.
Demand, a snapshot of the number of new pending sales over the prior month, increased from 1,604 to 1,652 in the past couple of weeks, representing a 48-pending-sale rise, or 3%, its largest increase since May. It is the highest demand level since the 1,665 pending sales peak in mid-March. Since the start of August, mortgage rates have been at their lowest level of the year, bouncing between 6.5 and 6.6% with no points, according to Mortgage News Daily. The last time rates were this low was the start of last October. Even this slight improvement in rates has led to an increase in demand. Rates may improve further and drop below 6.5% with duration, depending upon inflation and jobs readings. The Federal Reserve will be more apt to cut rates further if the jobs market slows further. The most recent jobs report, released at the beginning of this month, indicated a severe softening over the past few months. While inflation may rise slightly over the remainder of the year due to tariffs, the weakening job market will be a larger factor in the Federal Reserve’s decisions.
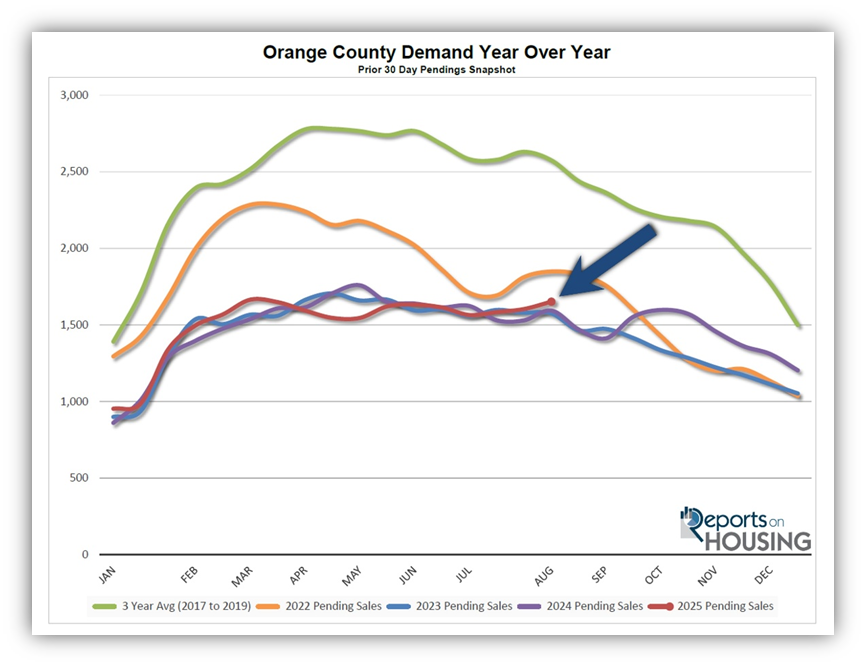
Last year, demand was 1,594, with 58 fewer pending sales, or 4% less. The 3-year average before COVID (2017-2019) was 2,574 pending sales, 56% higher than today, representing an additional 922 pending sales.
As the Federal Reserve has indicated, watching all economic releases for signs of slowing is essential. That is the only path to lower mortgage rates at this time. These releases can cause mortgage rates to move higher or lower, depending on how they compare to market expectations. This week marks the release of the S&P Global Manufacturing and Services Purchasing Managers Index (PMI), which tracks the strength of the U.S. manufacturing and services sectors. Next week, the Personal Consumption Expenditures – Price Index (PCE), the Fed’s preferred inflation gauge, will be released on Thursday.
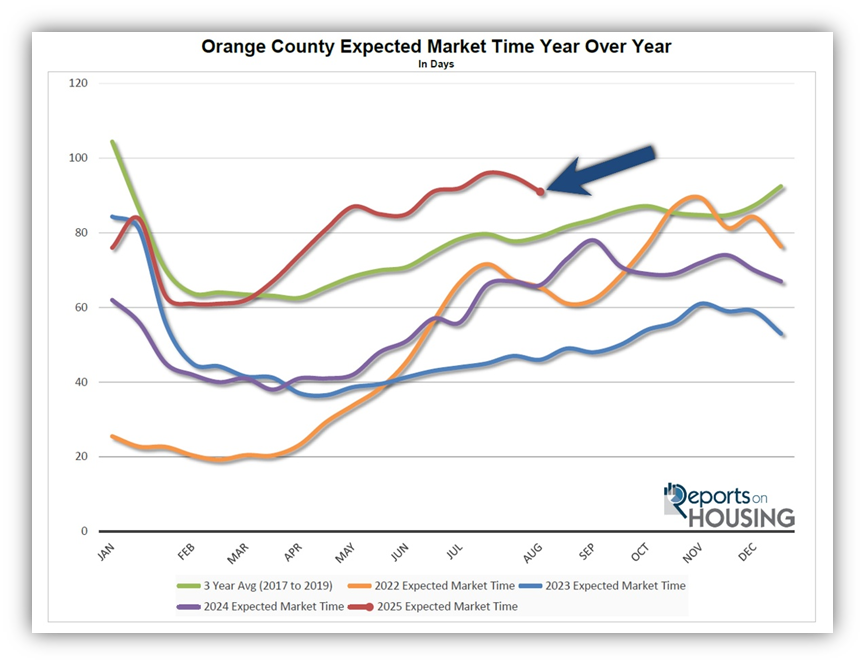
Expected Market Time
The Expected Market Time has improved by four days over the past couple of weeks.
With the supply of available homes falling by only 60 homes, down 1%, and demand rising by only 48 pending sales, up 3%, the Expected Market Time (the number of days it takes to sell all Orange County listings at the current buying pace) decreased from 95 to 91 days in the past couple of weeks, its best reading since mid-June. Yet, 91 days is the highest mid-August level since 2014.
Last year, it was 66 days, substantially faster than today. The 3-year average before COVID was 79 days, which is also quicker than today.
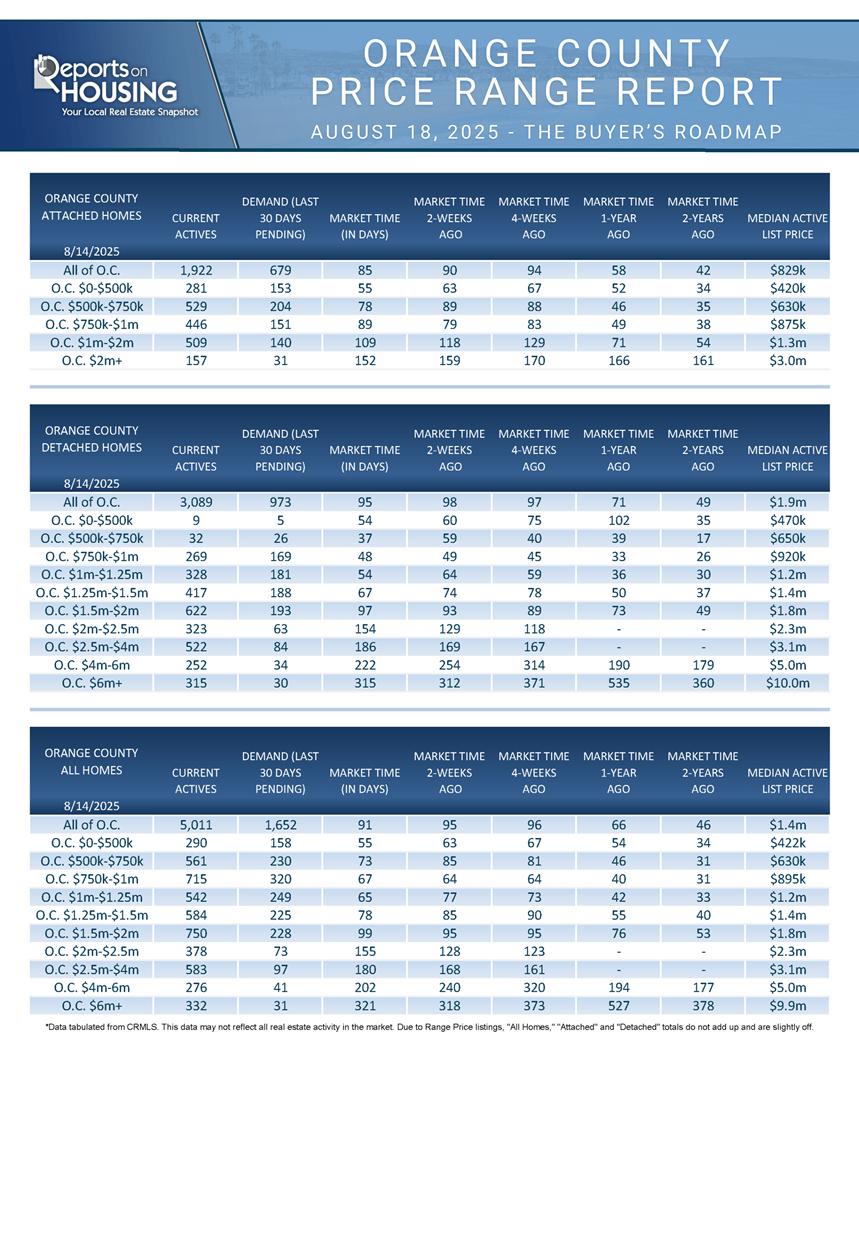
The Expected Market Time for condominiums and townhomes decreased from 90 to 85 days in the past two weeks. It was at 58 days last year. For detached homes, the Expected Market Time decreased from 98 to 95 days. It was 71 days a year ago.
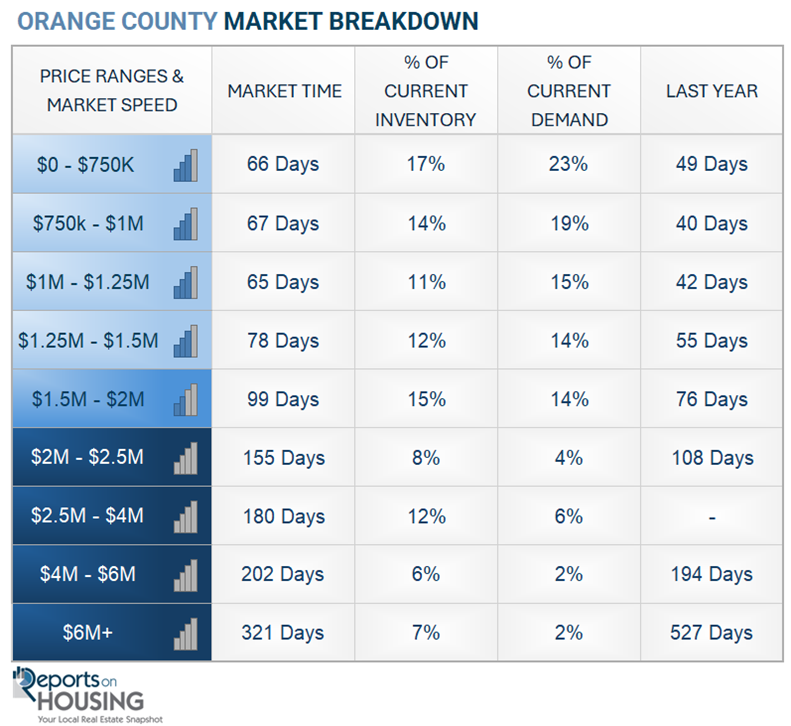
Luxury End
The luxury market has remained unchanged over the past couple of weeks.
The luxury inventory of homes priced above $2.5 million (the top 10% of the Orange County housing market) decreased from 1,201 to 1,191 homes, a decline of 10 homes, or 1%. Luxury demand decreased by two pending sales, down 1%, and now stands at 169. The Expected Market Time for luxury homes priced above $2.5 million remained unchanged at 211 days, still its strongest level since the start of June. With Wall Street continuing to outperform expectations, the luxury market remains on solid footing.
In the past two weeks, the Expected Market Time for homes priced between $2.5 million and $4 million increased from 168 to 180 days. For homes priced between $4 million and $6 million, the Expected Market Time decreased from 240 to 202 days. For homes priced above $6 million, the Expected Market Time increased from 318 to 321 days. Luxury is at 211 days overall. At this pace, a seller would be looking at becoming a pending sale around March 2026.
Orange County Housing Summary
- INVENTORY: The active listing inventory in the past couple of weeks decreased by 60 homes, down 1%, and now stands at 5,011. Orange County may have reached its peak a couple of weeks ago, marking its first normal July-to-August peak since 2022. Last year, there were 3,490 homes on the market, 1,521 fewer homes, or 30% less. The 3-year average before COVID (2017-2019) was 6,723, which is 34% higher. From January through July, 25% fewer homes came on the market compared to the 3-year average before COVID (2017-2019), 6,370 less. Yet, 2,425 more sellers came on the market this year than last, and 4,861 more compared to 2023.
- DEMAND: Buyer demand, the number of pending sales over the prior month, increased by 48 homes, up 3%, and now stands at 1,652. Last year, there were 1,594 pending sales, 4% lower than today. The 3-year average before COVID (2017-2019) was 2,574, which is 56% higher.
- MARKET TIME: With supply falling and demand rising, the Expected Market Time, the number of days to sell all Orange County listings at the current buying pace, decreased from 95 to 91 days in the past couple of weeks, still a high level for August. Last year, it was 66 days, substantially faster than today. The 3-year average before COVID (2017-2019) was 79 days, which is also faster than today.
- LUXURY: In the past two weeks, the Expected Market Time for homes priced between $2.5 million and $4 million increased from 168 to 180 days. For homes priced between $4 million and $6 million, the Expected Market Time decreased from 240 to 202 days. For homes priced above $6 million, the Expected Market Time increased from 318 to 321 days.
- DISTRESSED HOMES: Short sales and foreclosures combined, comprised only 0.1% of all listings and 0.3% of demand. Only four foreclosures and three short sales are available today in Orange County, with a total of seven distressed homes on the active market, down four from two weeks ago. Last year, eight distressed homes were on the market, similar to today.
- CLOSED SALES: There were 1,934 closed residential resales in July, down 5% compared to July 2024’s 2,034 and up 5% from June 2025. The sales-to-list price ratio was 97.5% for Orange County. Foreclosures accounted for 0.05% of all closed sales, and short sales accounted for 0.05%. That means that 99.9% of all sales were sellers with equity.
Have a great week.
Sincerely,
Steven Thomas
Quantitative Economics and Decision Sciences
Copyright 2025—Steven Thomas, Reports On Housing—All Rights Reserved. This report may not be reproduced in whole or in part without express written permission from the author.