March 3, 2025
While it is true that the Orange County housing market has been resilient despite higher mortgage rates, this year’s market speed is much different than the past several years.
It Is Taking Longer To Sell
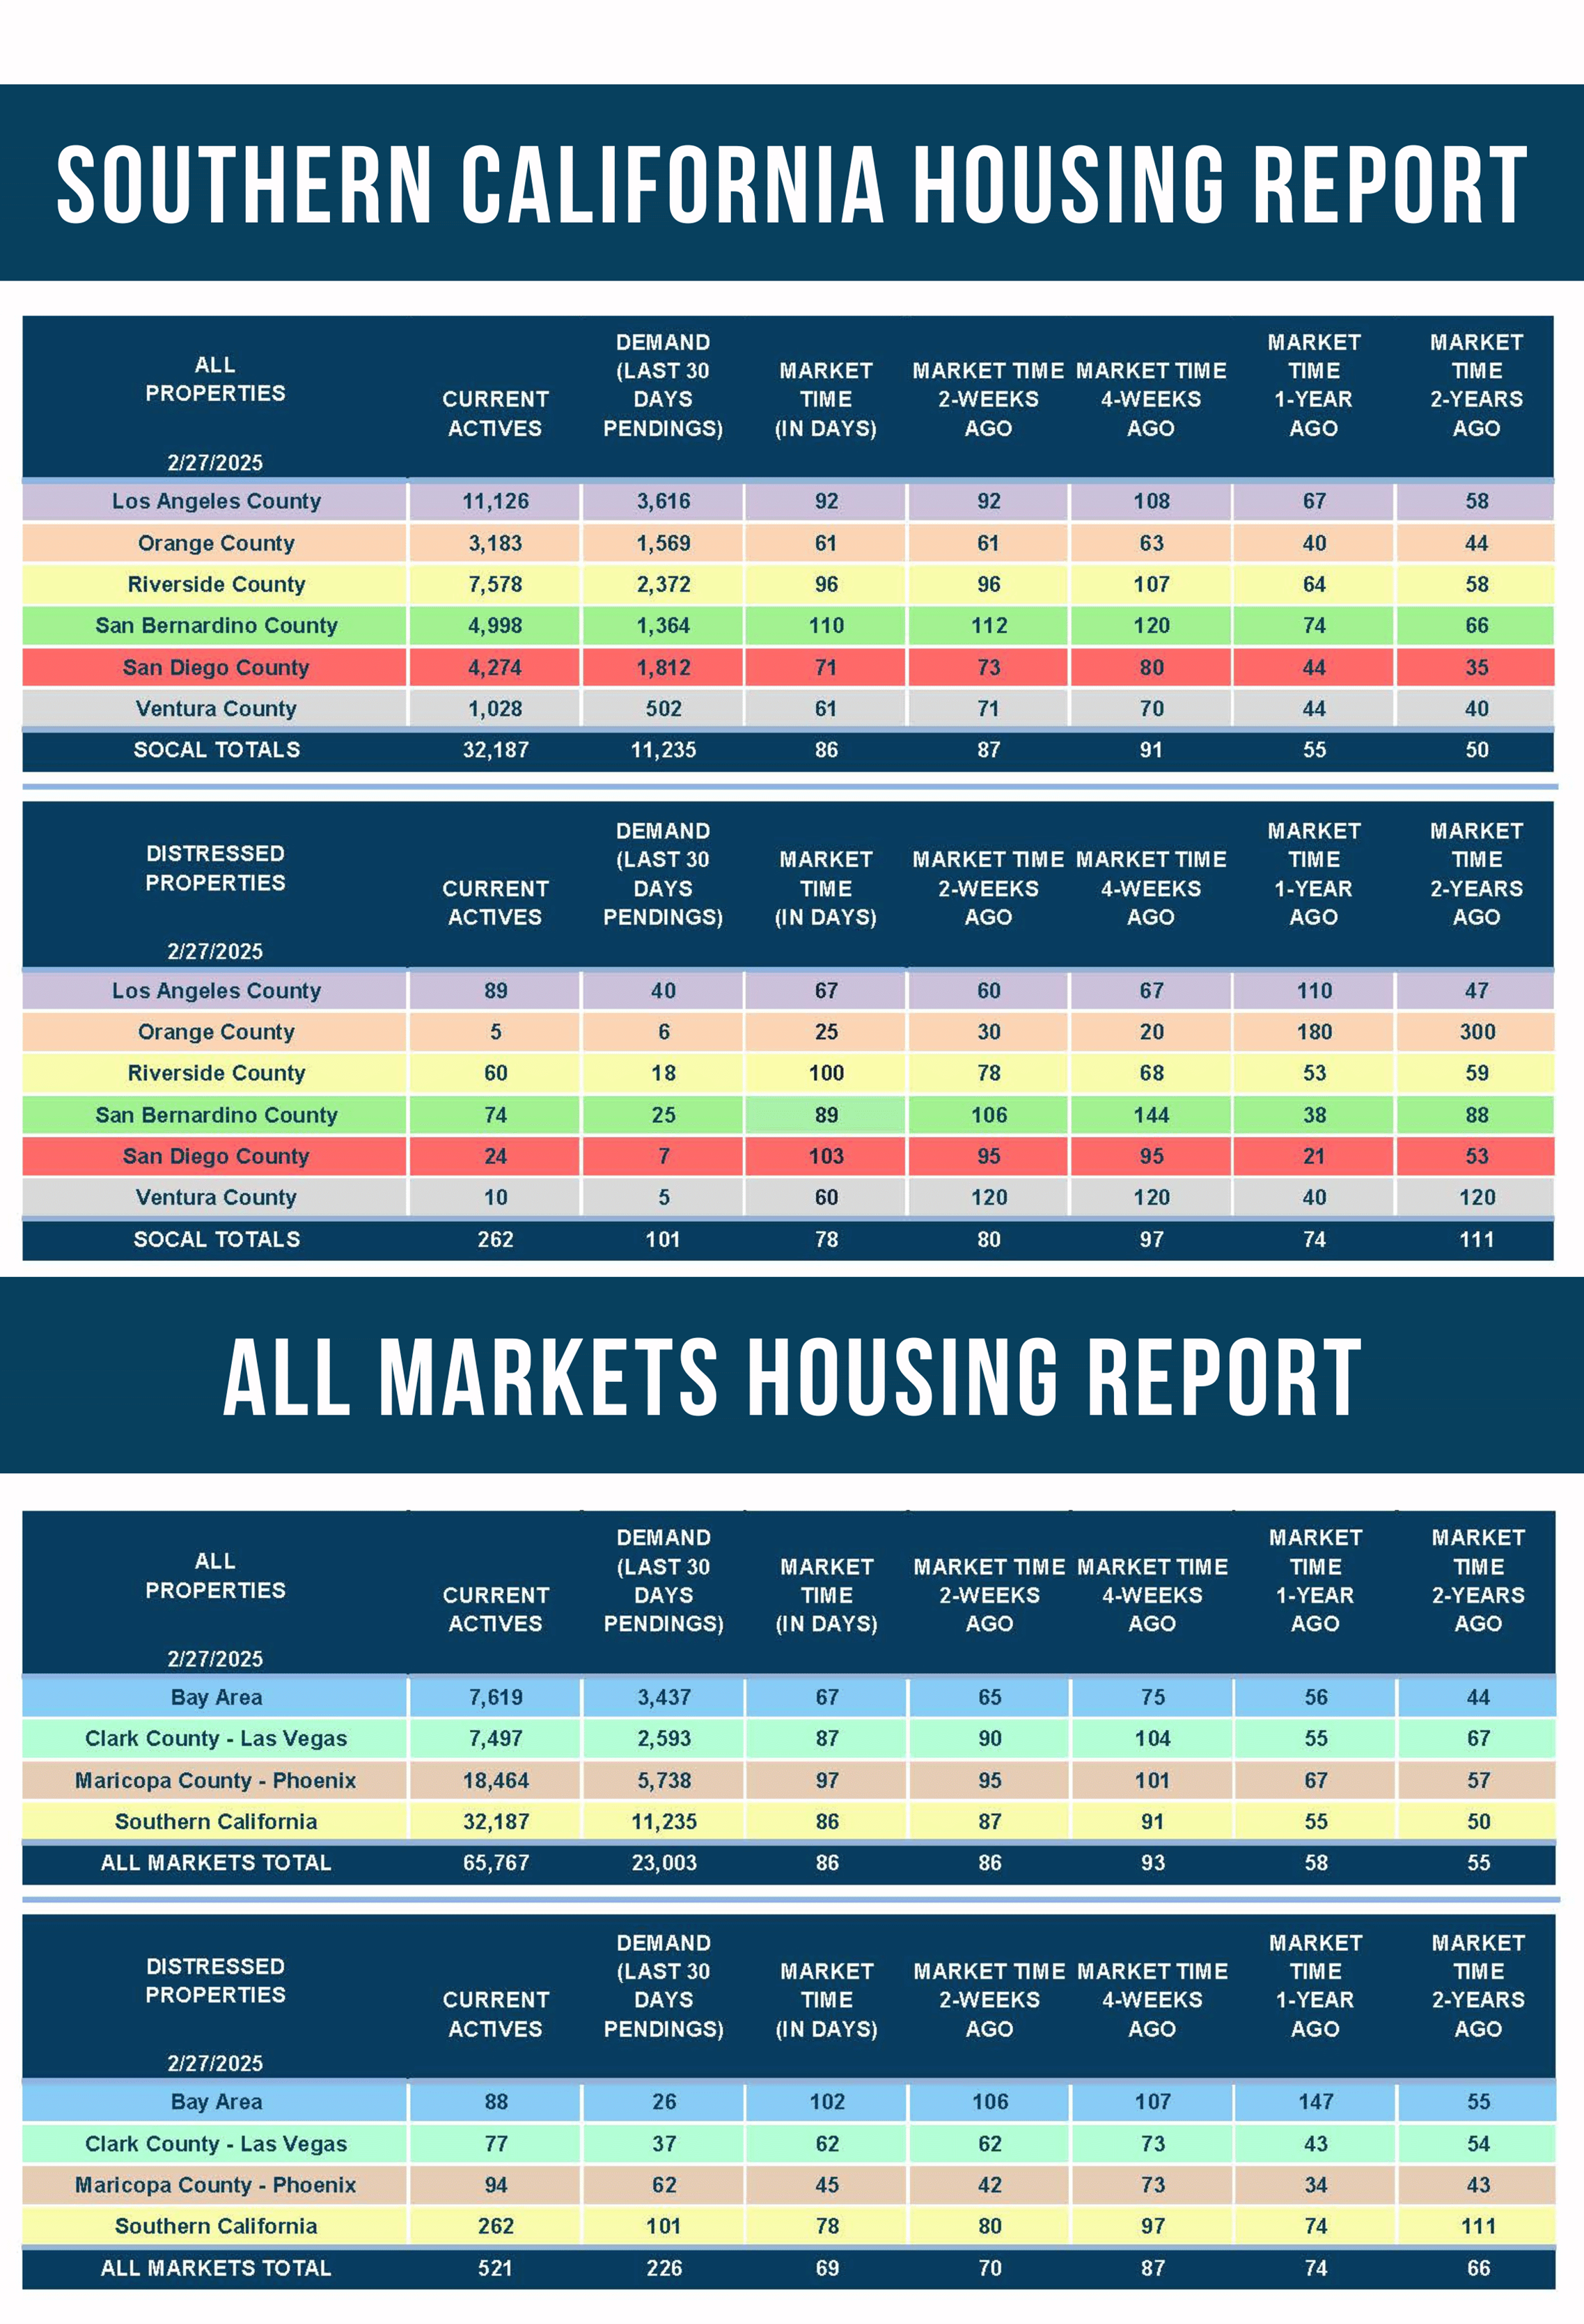
With a much higher inventory and similar demand, this year’s market time is at its highest since 2019.
Commuters know precisely how long it takes to get to work. They wake up at the same time. They get ready, eat breakfast, and jump in their cars in a timely, habitual rhythm. That is, until the day when their commute is disrupted by bumper-to-bumper traffic due to a brand new construction project with signs exclaiming that it will not be complete for a little over a year. It now takes much longer to arrive at work, so everyone has to recalibrate the commute and prepare by adjusting their morning routine to accommodate the extra time in the car.
The Orange County housing market is experiencing more traffic with extra FOR SALE signs and only slightly better buyer demand. The result is a much slower market that nobody had been anticipating. Housing is much different than the hot markets from 2020 through 2024. It takes longer to sell. Sellers need to recalibrate their expectations and spend more time preparing their homes for sale and methodically and carefully arrive at their asking price, the Fair Market Value of their home.
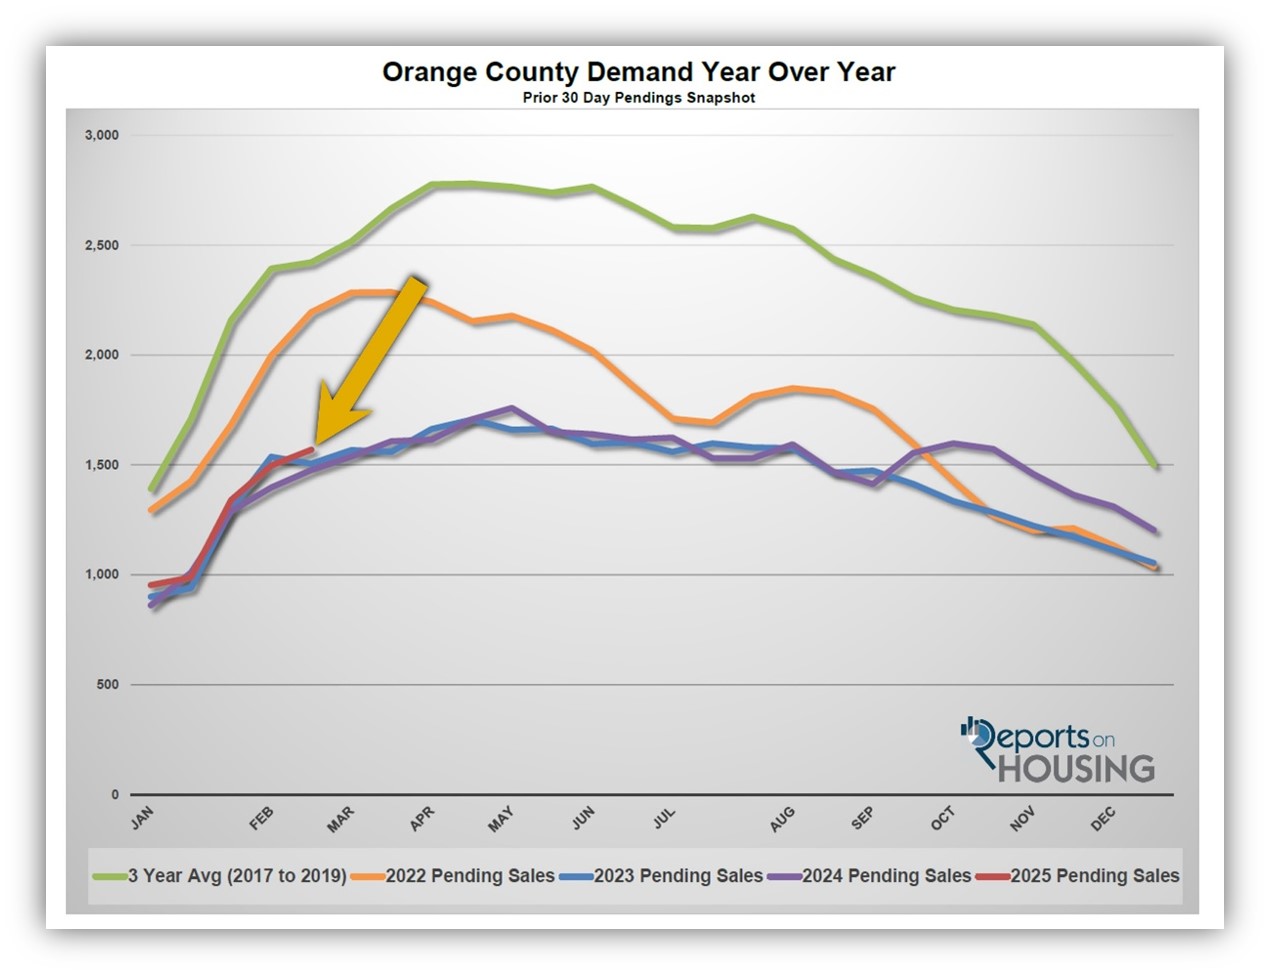
This is the third year where demand (a snapshot of the number of new pending sales over the prior month) has been stuck at very low levels, the lowest since tracking began in 2004. These low-demand readings are a direct result of unaffordability. When mortgage rates increased from 3.25% in January 2022 to over 7% in October, just nine months later, demand collapsed. The payment, principal and interest, on a $1 million home with 20% down grew from $3,481 per month at 3.25% to $5,322 at 7%, an increase of $1,841 monthly or over $22,000 annually. The current demand is at 1,569 pending sales, 6% higher than last year and 4% stronger than in 2023. Yet, it is 34% less than the 3-year average before the pandemic (2017 to 2019) of 2,422 pending sales.
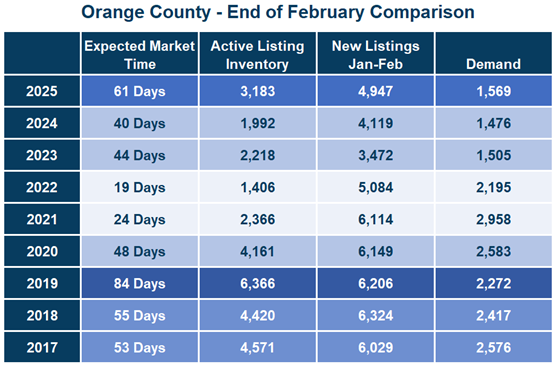
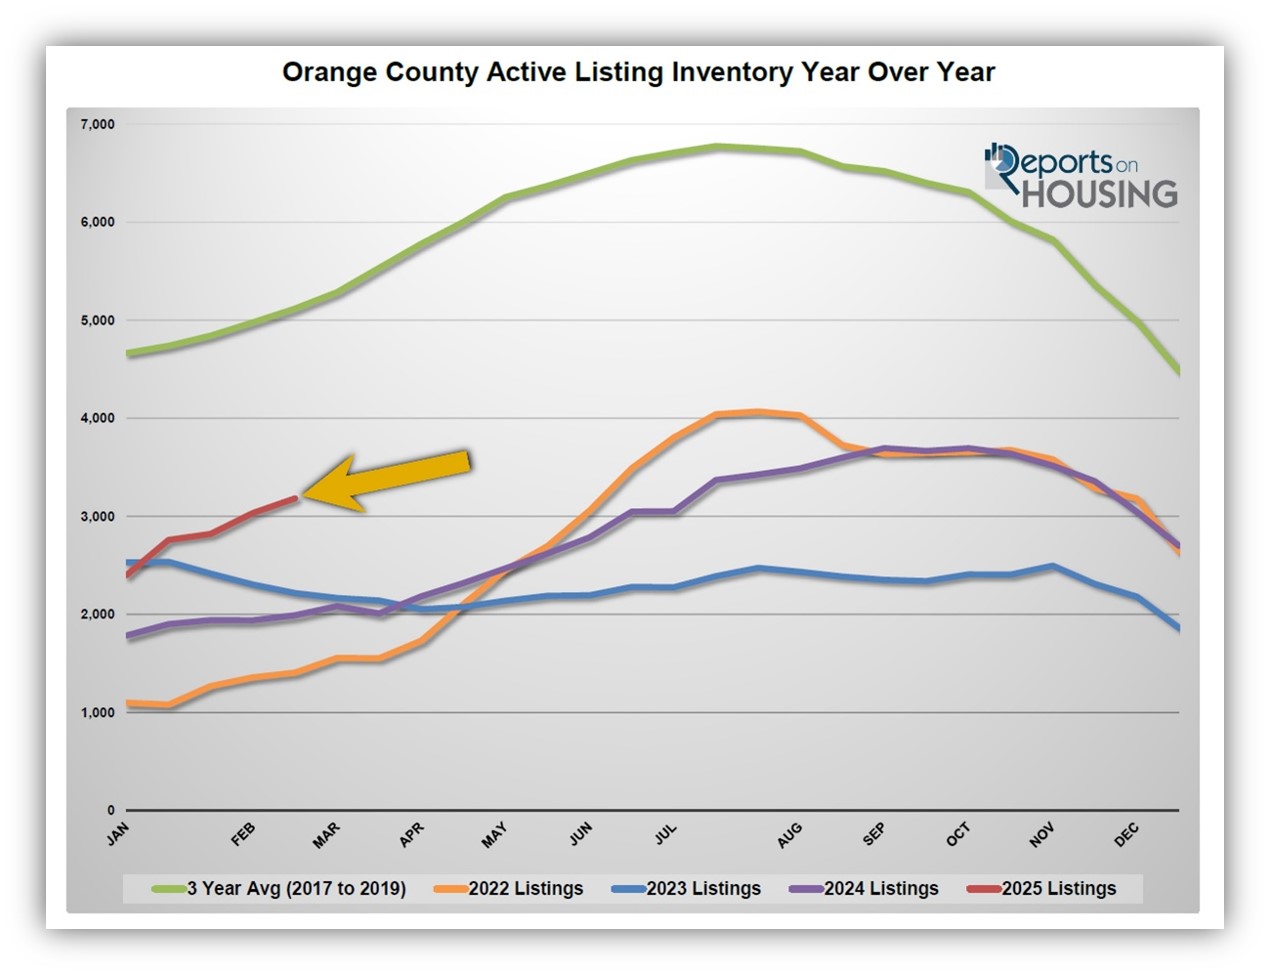
The active listing inventory is a different story altogether. Before this year, the inventory was stuck at chronically low, anemic levels from 2021 through 2024. That began to change last spring as more homeowners opted to sell than in 2023. Since demand was at similar levels in 2024 compared to 2023, the extra sellers accumulated on the market, and homes started taking longer to sell. Many homeowners were “hunkering down” in their homes, unwilling to move due to their underlying, locked-in, low fixed-rate mortgage. In 2023, there were only 3,472 new sellers in January and February, down 44% compared to the 3-year pre-pandemic average of 6,186. In 2024, there were 4,119, down 31%. In 2025, there were 4,947 new FOR SALE signs, down 20%. Yet, there are 828 additional signs compared to last year and 1,475 more than in 2023. These extra sellers have accumulated over time. Today, the active listing inventory stands at 3,183 homes, up 60% compared to last year. It is the highest level for this time of year since 2020, when there were 4,161 homes on the market.
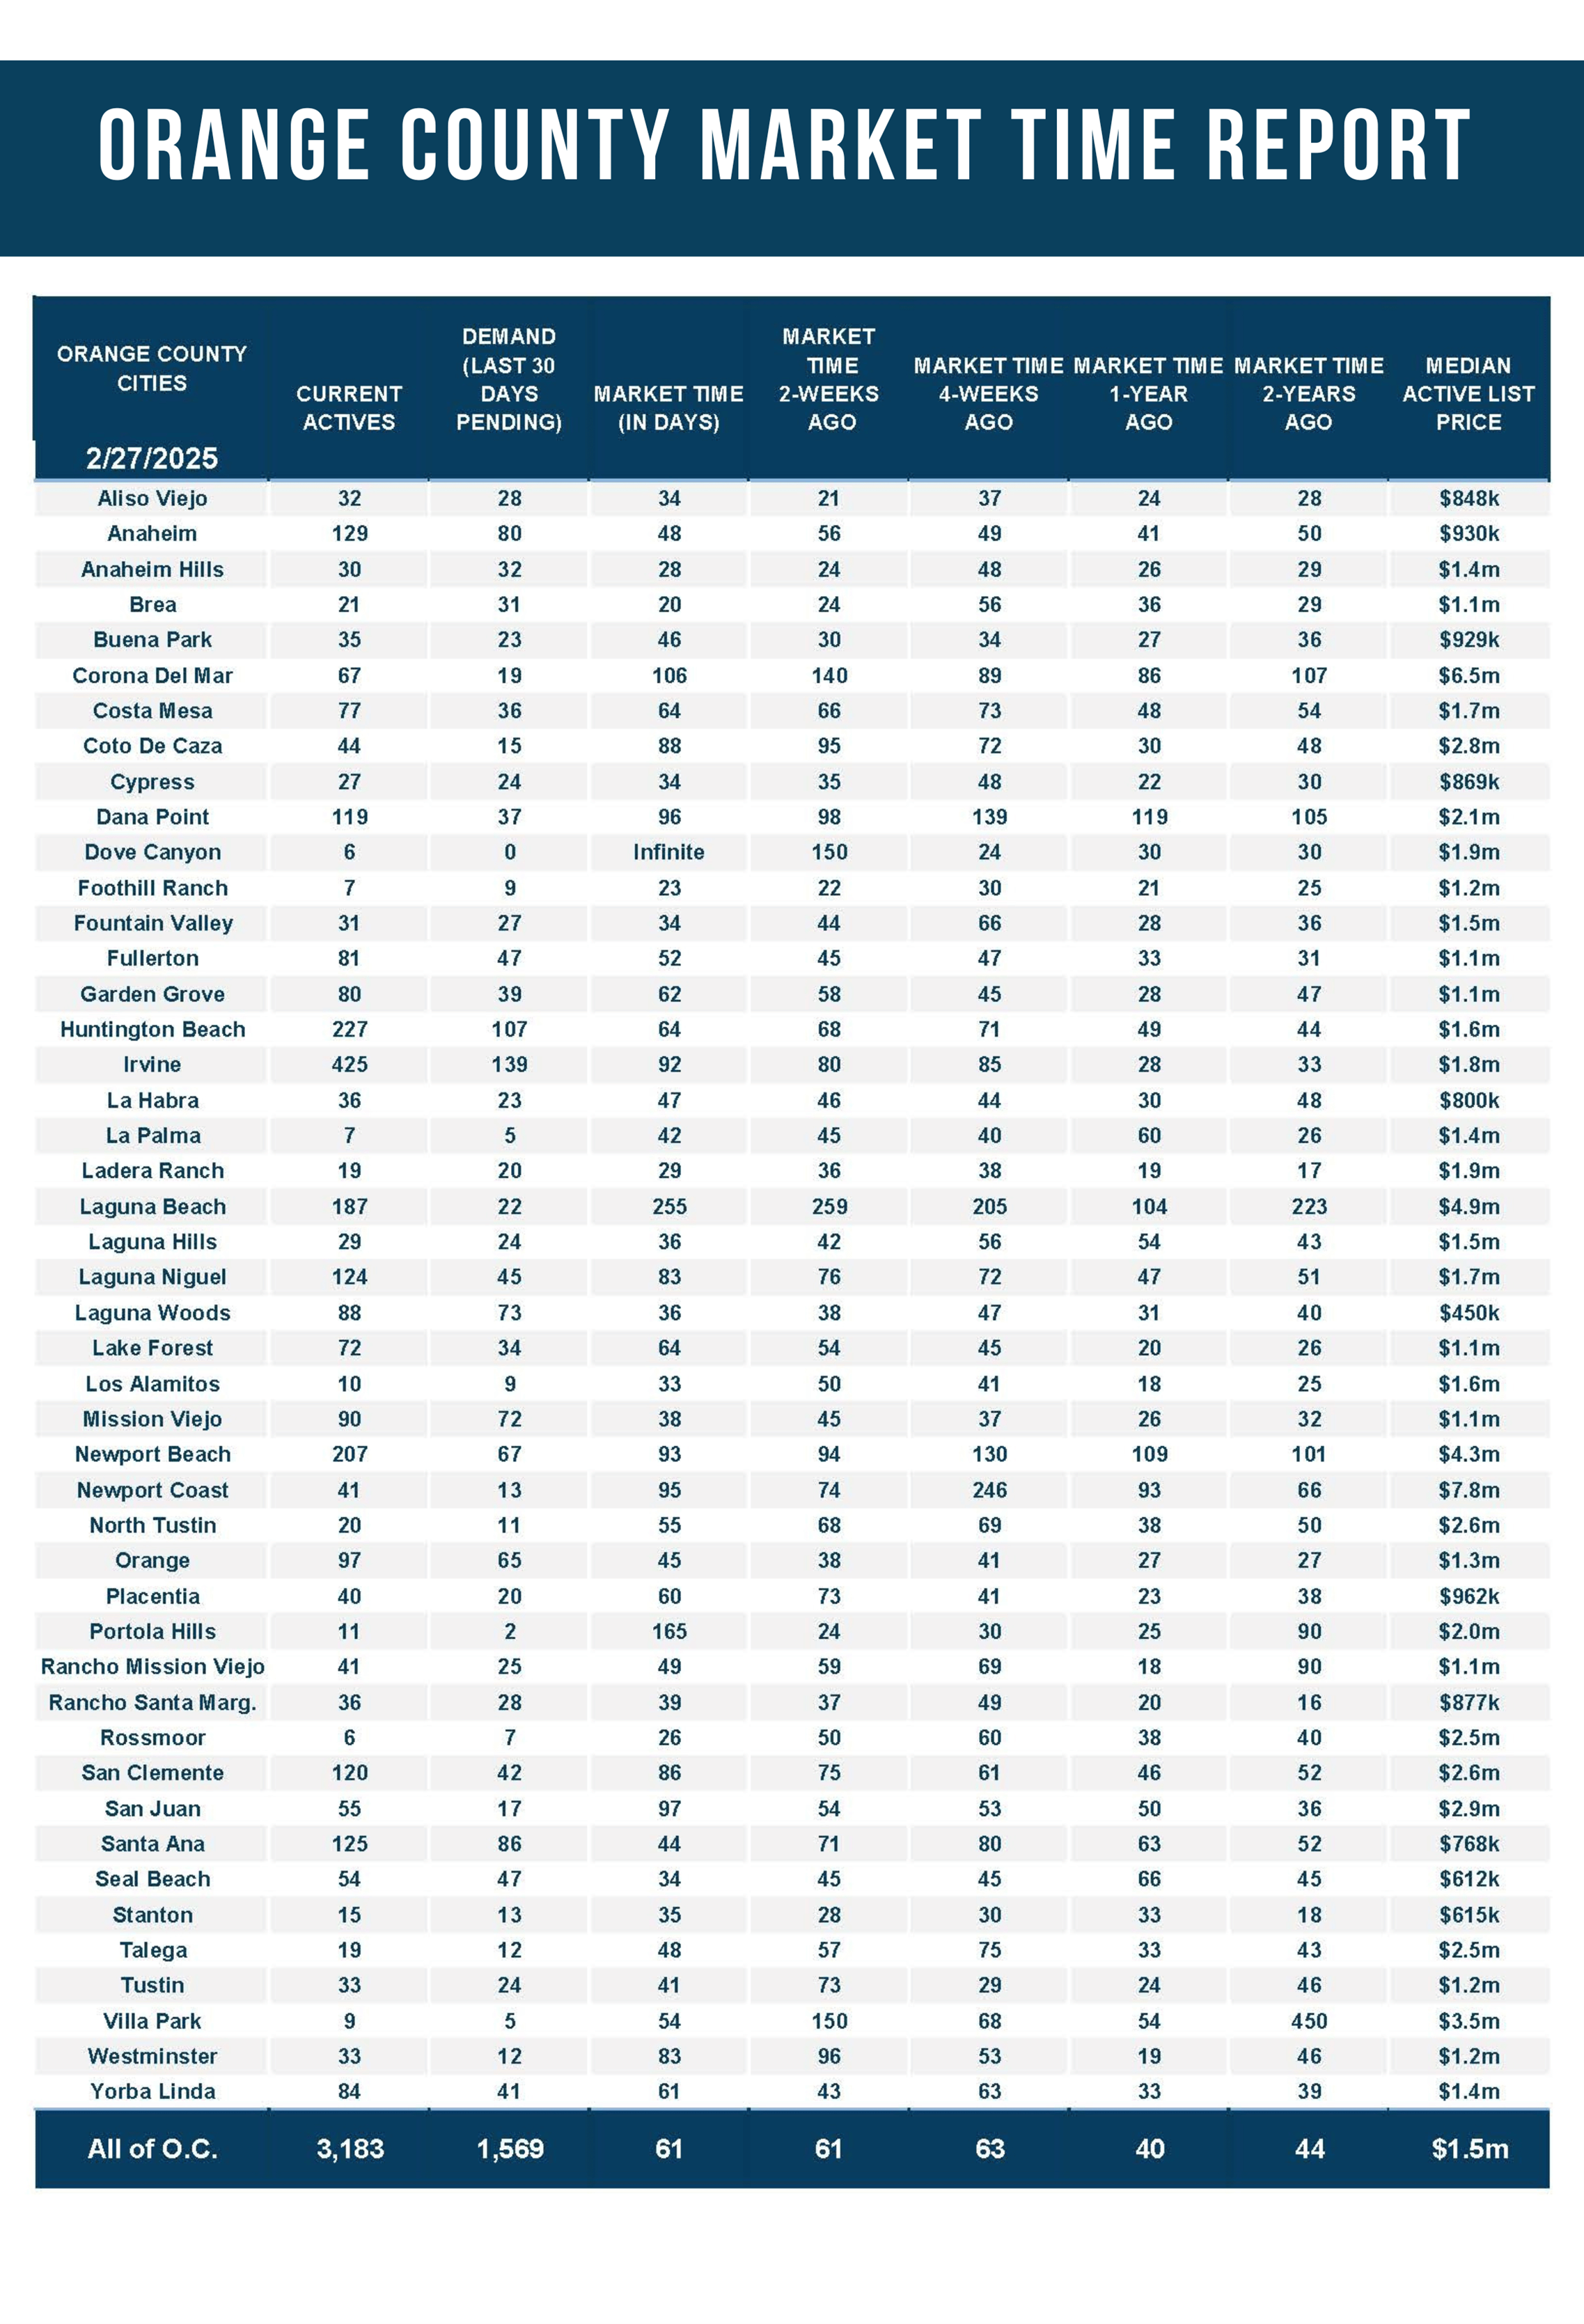
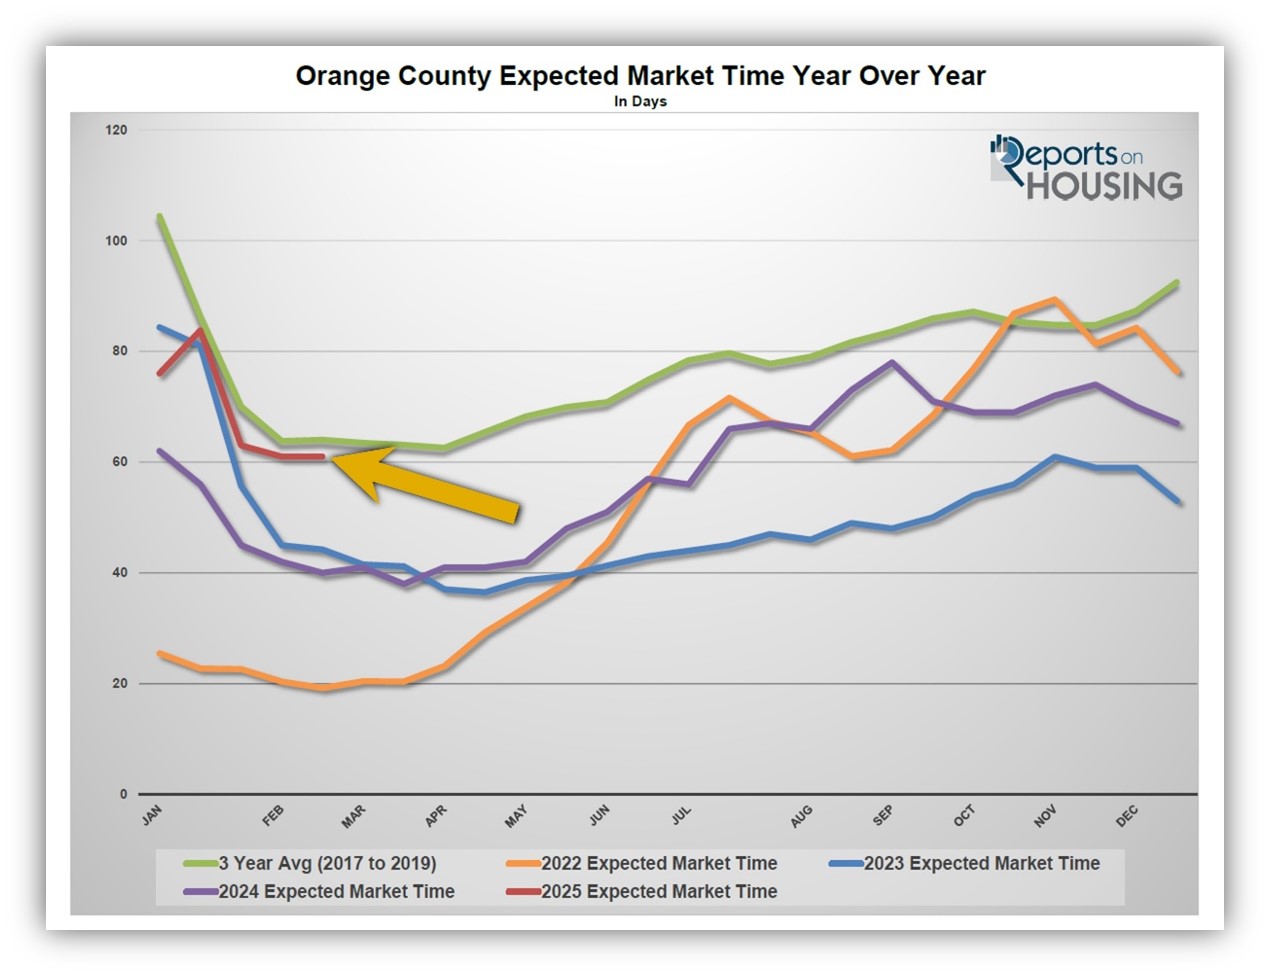
The market is substantially slower in matching the higher inventory with anemic, low demand. The Expected Market Time (the number of days it takes to sell all Orange County listings at the current buying pace) is 61 days, its highest level since 2019’s 84-day reading. Last year, it was 40 days, three weeks faster than today. In 2023, it was 44 days, also significantly quicker. Today’s housing market is far from instant. Since 2017, only 2019 has been slower.
The current trend is for the active listing inventory to continue to grow. It will grow at an even faster velocity during the Spring Market. As spring progresses, the number of homes coming on the market will outpace demand, and the Expected Market Time will rise. The only caveat is if rates continue to fall. Mortgage rates were stuck above 7% from mid-December through mid-February. Yet, with economic growth slowing, according to Mortgage News Daily, rates have dropped to 6.74% to start March, their lowest level since the start of December. If they fall further with duration, demand levels could rise. As a result, the Expected Market Time would not climb at a slower pace.
Nonetheless, today’s housing market is much slower than many have become accustomed to. Orange County housing is far from instant. A traffic jam is forming with a much higher active listing inventory and more sellers coming on the market each month. It is a sound strategy to expect even more brake lights ahead.
Active Listings
The inventory grew by 5% in the past couple of weeks.
The active listing inventory increased by 150 homes in the past two weeks, up 5%, and now sits at 3,183. It is the highest inventory level to start March since 2020. Since the start of the year, the inventory has grown by 33% or 782 homes. That is the most considerable rise in the inventory since 2016, when it grew by 868. To put that in perspective, the inventory grew by 207 homes last year, and in 2023, it dropped by 312. The 3-year average before the pandemic (2017 to 2019) was a rise of 454 homes. The current faster pace is due to more homeowners coming on the market and low demand levels due to the high mortgage rate environment. Rates are starting to ease. If they continue to slide below 6.5%, demand will rise, and the inventory will grow at a slower pace. For now, it will continue to increase at an unprecedented rate.
Last year, the inventory was at 1,992 homes, 37% lower, or 1,191 fewer. The 3-year average before COVID (2017 through 2019) was 5,119, an additional 1,936 homes, or 61% more.
Homeowners continue to “hunker down” in their homes, unwilling to move due to their current underlying, locked-in, low fixed-rate mortgage. It became a crisis once rates skyrocketed higher in 2022. For February, 2,459 new sellers entered the market in Orange County, 673 fewer than the 3-year average before COVID (2017 to 2019), 21% less. Last February, there were 2,065 new sellers, 16% fewer than this year. More sellers are opting to sell compared to the previous couple of years.
Demand
Demand grew by 5% in the past couple of weeks.
Demand, a snapshot of the number of new pending sales over the prior month, increased from 1,497 to 1,569 in the past couple of weeks, up 72 pending sales, or 5%, its highest level since October. Mortgage rates are finally beginning to cooperate and have dropped noticeably since mid-January when they reached 7.26%. They were 6.74% as of March 3rd, dropping by slightly over 0.5%, the lowest since December 9th. The drop is equivalent to about a 5% drop in monthly payments. The housing market has been frozen due to the high mortgage rate environment. As mortgage rates drop, affordability will improve and lead to an increase in demand. If rates drop below 6.5% with duration, expect demand to noticeably improve and the Orange County market to not slow from April through November like it has the last couple of years. Housing is very interest-rate sensitive. The pathway of mortgage rates will determine the path for this year’s housing market.
As the Federal Reserve has indicated, watching all economic releases for signs of slowing is essential. That is the only path to lower mortgage rates right now. These releases can move mortgage rates higher or lower, depending on how they compare to market expectations. This week is jobs week, which includes the number of job openings, wages, and the number of jobs created or lost, one of the month’s most important economic data points. Next week is the release of the Consumer Price Index (CPI), and the Producer Price Index (PPI) and the Consumer Price Index (CPI), two crucial inflation indicators. It is going to be a pivotal two weeks for mortgage rates.
Last year, demand was 1,476, with 93 fewer pending sales or 6% less. The 3-year average before COVID (2017 to 2019) was 2,422 pending sales, 54% more than today, or an additional 853.
With supply and demand rising at a similar pace, the Expected Market Time (the number of days it takes to sell all Orange County listings at the current buying pace) remained unchanged at 61 days in the past couple of weeks. Last year, it was 40 days, noticeably faster than today. The 3-year average before COVID was 64 days, similar to today.
Luxury End
The luxury market improved in the past couple of weeks.
The luxury inventory of homes priced above $2.5 million (the top 10% of the Orange County housing market) increased from 856 to 939 homes, up 54 or 6%. Luxury demand increased by 30 pending sales, up 18%, and now sits at 200. The Expected Market Time for luxury homes priced above $2.5 million decreased from 156 to 141 days, shedding 15 days. Despite Wall Street’s volatility, the luxury housing market in Orange County continued to improve. Expect the luxury market to not change much in March and then slow as more homes come on during the Spring and Summer Markets.
In the past two weeks, the Expected Market Time for homes priced between $2.5 million and $4 million increased from 112 to 113 days. For homes priced between $4 million and $6 million, the Expected Market Time decreased from 166 to 159 days. For homes priced above $6 million, the Expected Market Time decreased from 208 to 197 days. At 197 days, a seller would be looking at placing their home into escrow around September 2025.
Orange County Housing Summary
- The active listing inventory in the past couple of weeks increased by 150 homes, up 6%, and now sits at 3,183. In February, 21% fewer homes came on the market compared to the 3-year average before COVID (2017 to 2019), 673 less. Yet 394 more sellers came on the market this February compared to February 2024. Last year, there were 1,992 homes on the market, 1,191 fewer homes, or 37% less. The 3-year average before COVID (2017 to 2019) was 5,119, or 61% extra.
- Demand, the number of pending sales over the prior month, increased by 72 pending sales in the past two weeks, up 6%, and now totals 1,569, its highest level since October. Last year, there were 1,476 pending sales, 6% less. The 3-year average before COVID (2017 to 2019) was 2,422, or 54% more.
- With supply and demand rising at a similar pace, the Expected Market Time, the number of days to sell all Orange County listings at the current buying pace, remained unchanged at 61 days in the past couple of weeks. Last year, it was 40 days, substantially faster than today. The 3-year average before COVID (2017 to 2019) was 64 days, similar to today.
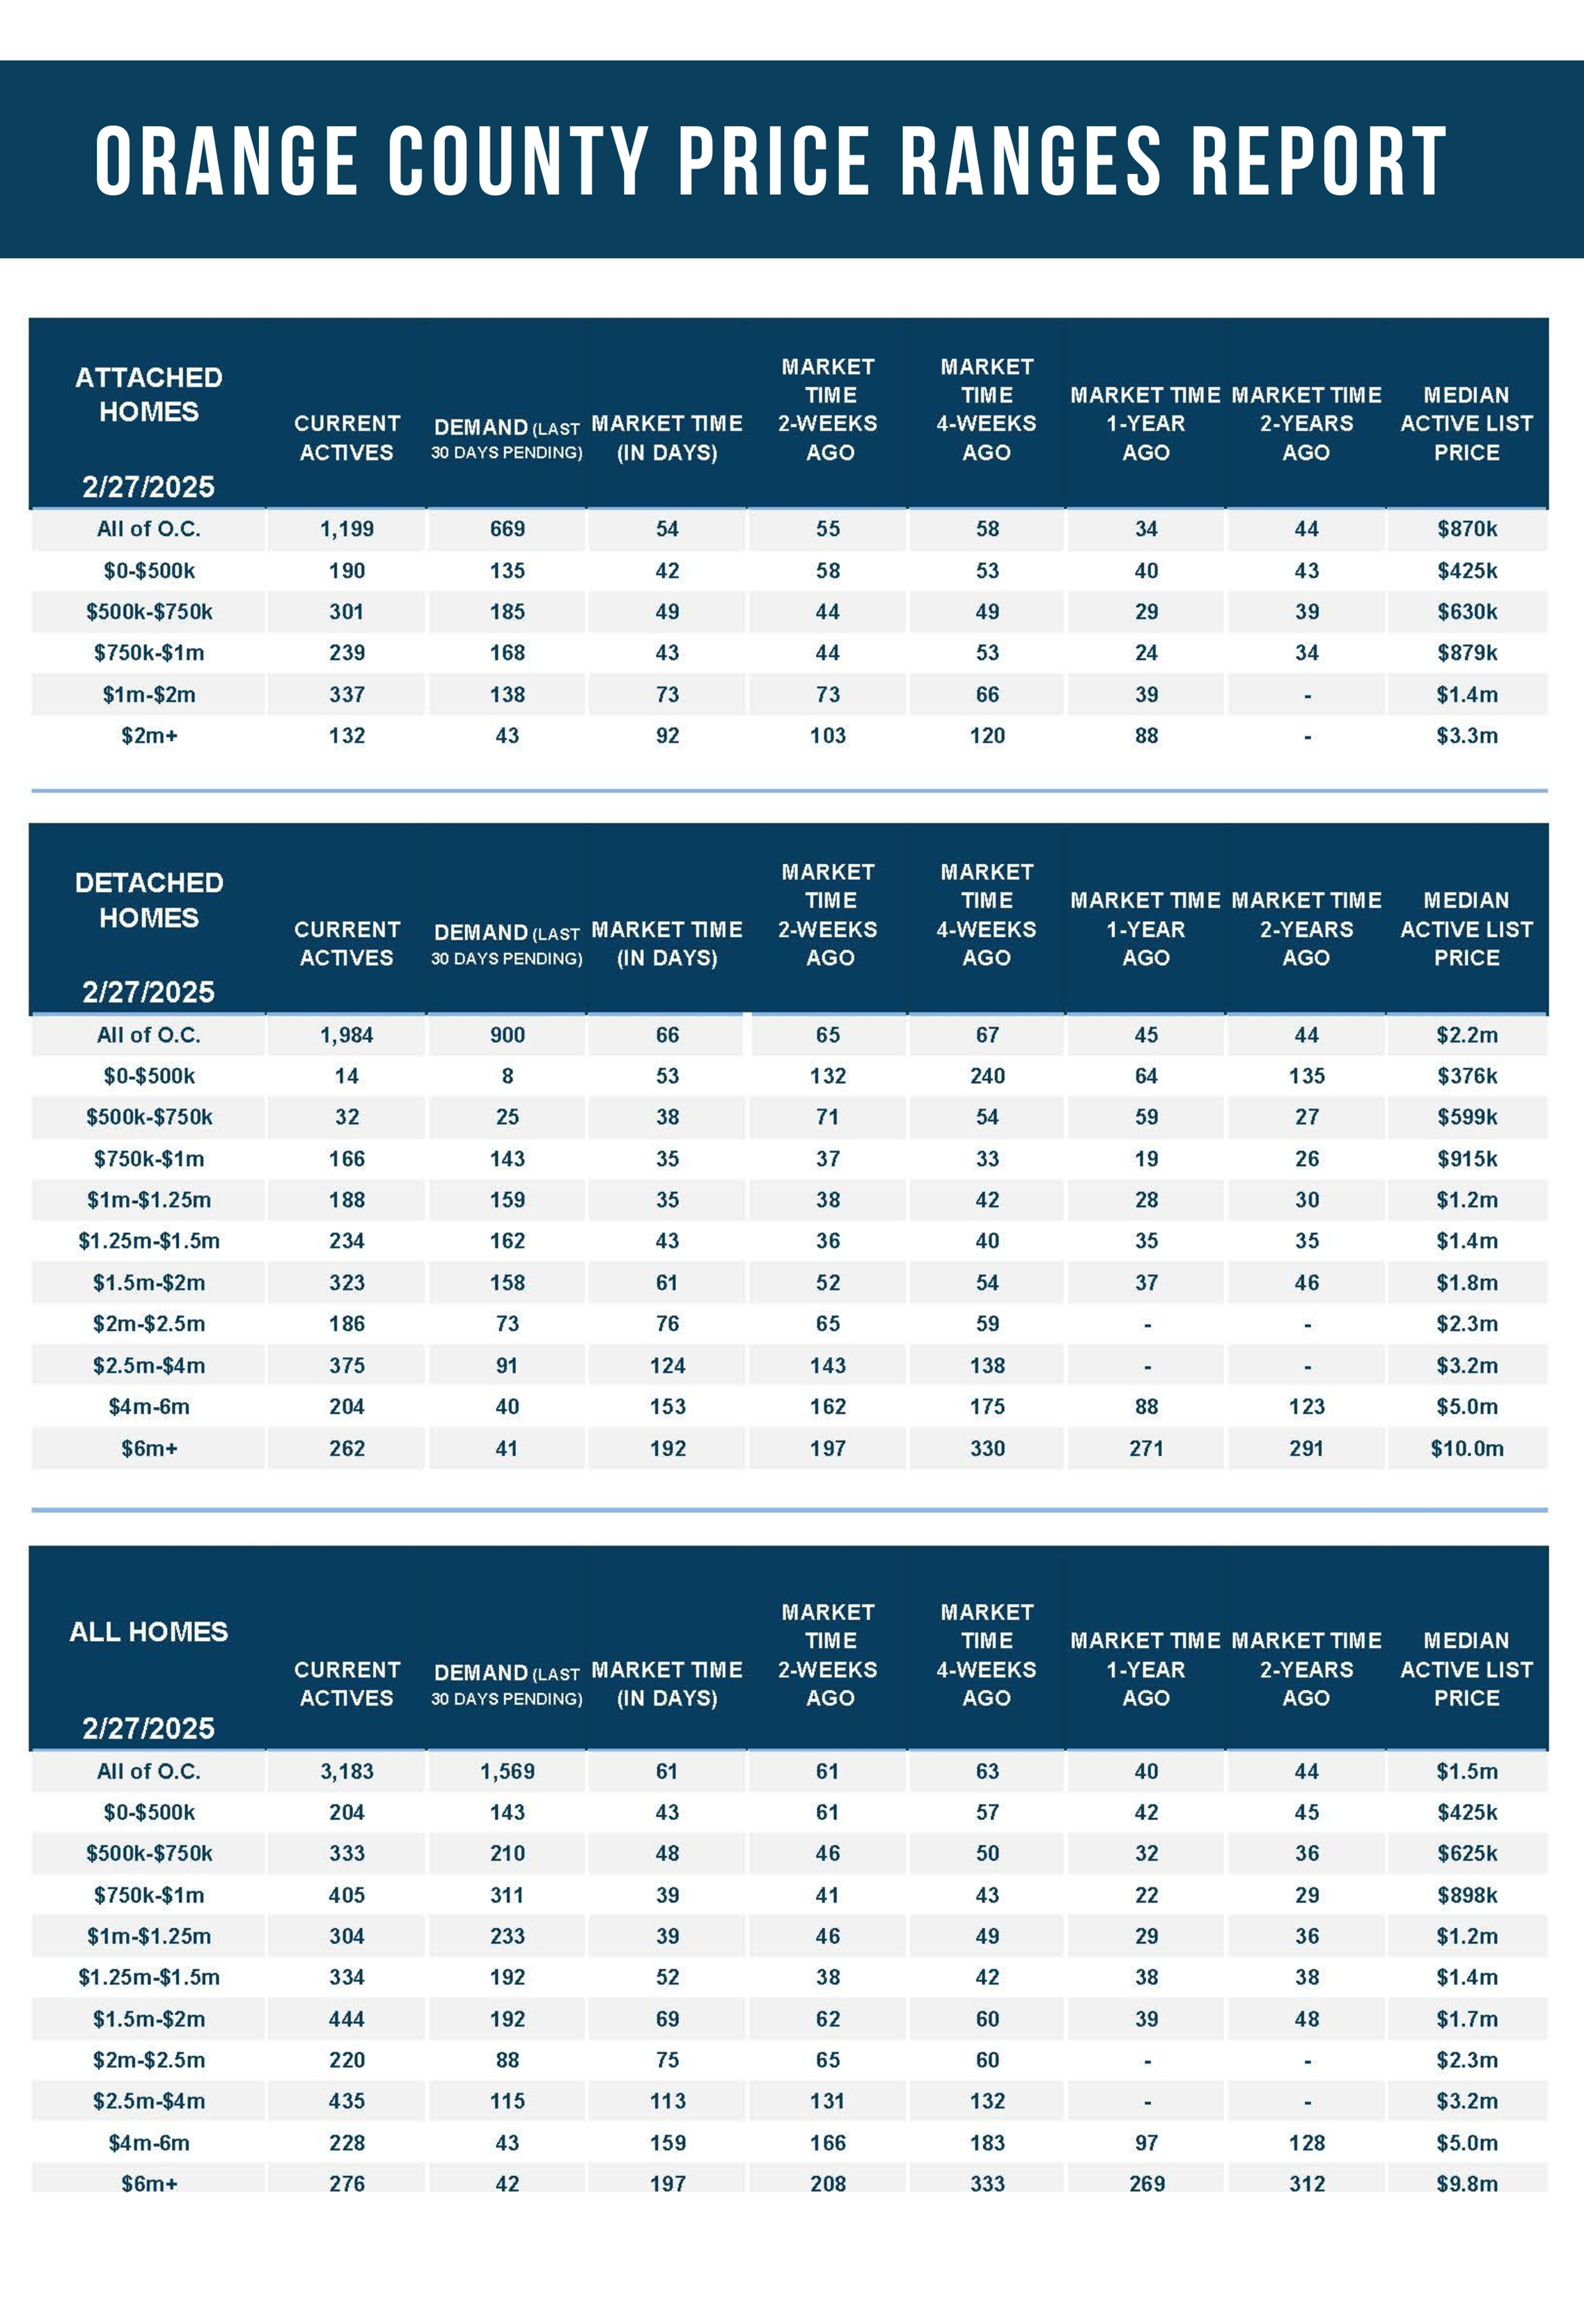
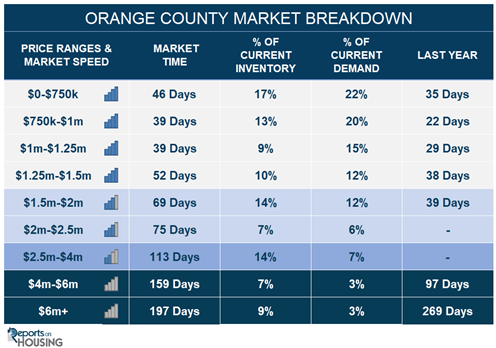
- In the past two weeks, the Expected Market Time for homes priced below $750,000 decreased from 51 to 46 days. This range represents 17% of the active inventory and 22% of demand.
- The Expected Market Time for homes priced between $750,000 and $1 million decreased from 41 to 39 days. This range represents 13% of the active inventory and 20% of demand.
- The Expected Market Time for homes priced between $1 million and $1.25 million decreased from 46 to 39 days. This range represents 9% of the active inventory and 15% of demand.
- The Expected Market Time for homes priced between $1.25 million and $1.5 million increased from 39 to 52 days. This range represents 10% of the active inventory and 12% of demand.
- The Expected Market Time for homes priced between $1.5 million and $2 million increased from 62 to 69 days. This range represents 14% of the active inventory and 12% of demand.
- The Expected Market Time for homes priced between $2 million and $2.5 million remained unchanged at 75 days. This range represents 7% of the active inventory and 6% of demand.
- In the past two weeks, the Expected Market Time for homes priced between $2.5 million and $4 million increased from 112 to 113 days. For homes priced between $4 million and $6 million, the Expected Market Time decreased from 166 to 159 days. For homes priced above $6 million, the Expected Market Time decreased from 208 to 197 days.
- The luxury end, all homes above $2 million, accounts for 30% of the inventory and 13% of demand.
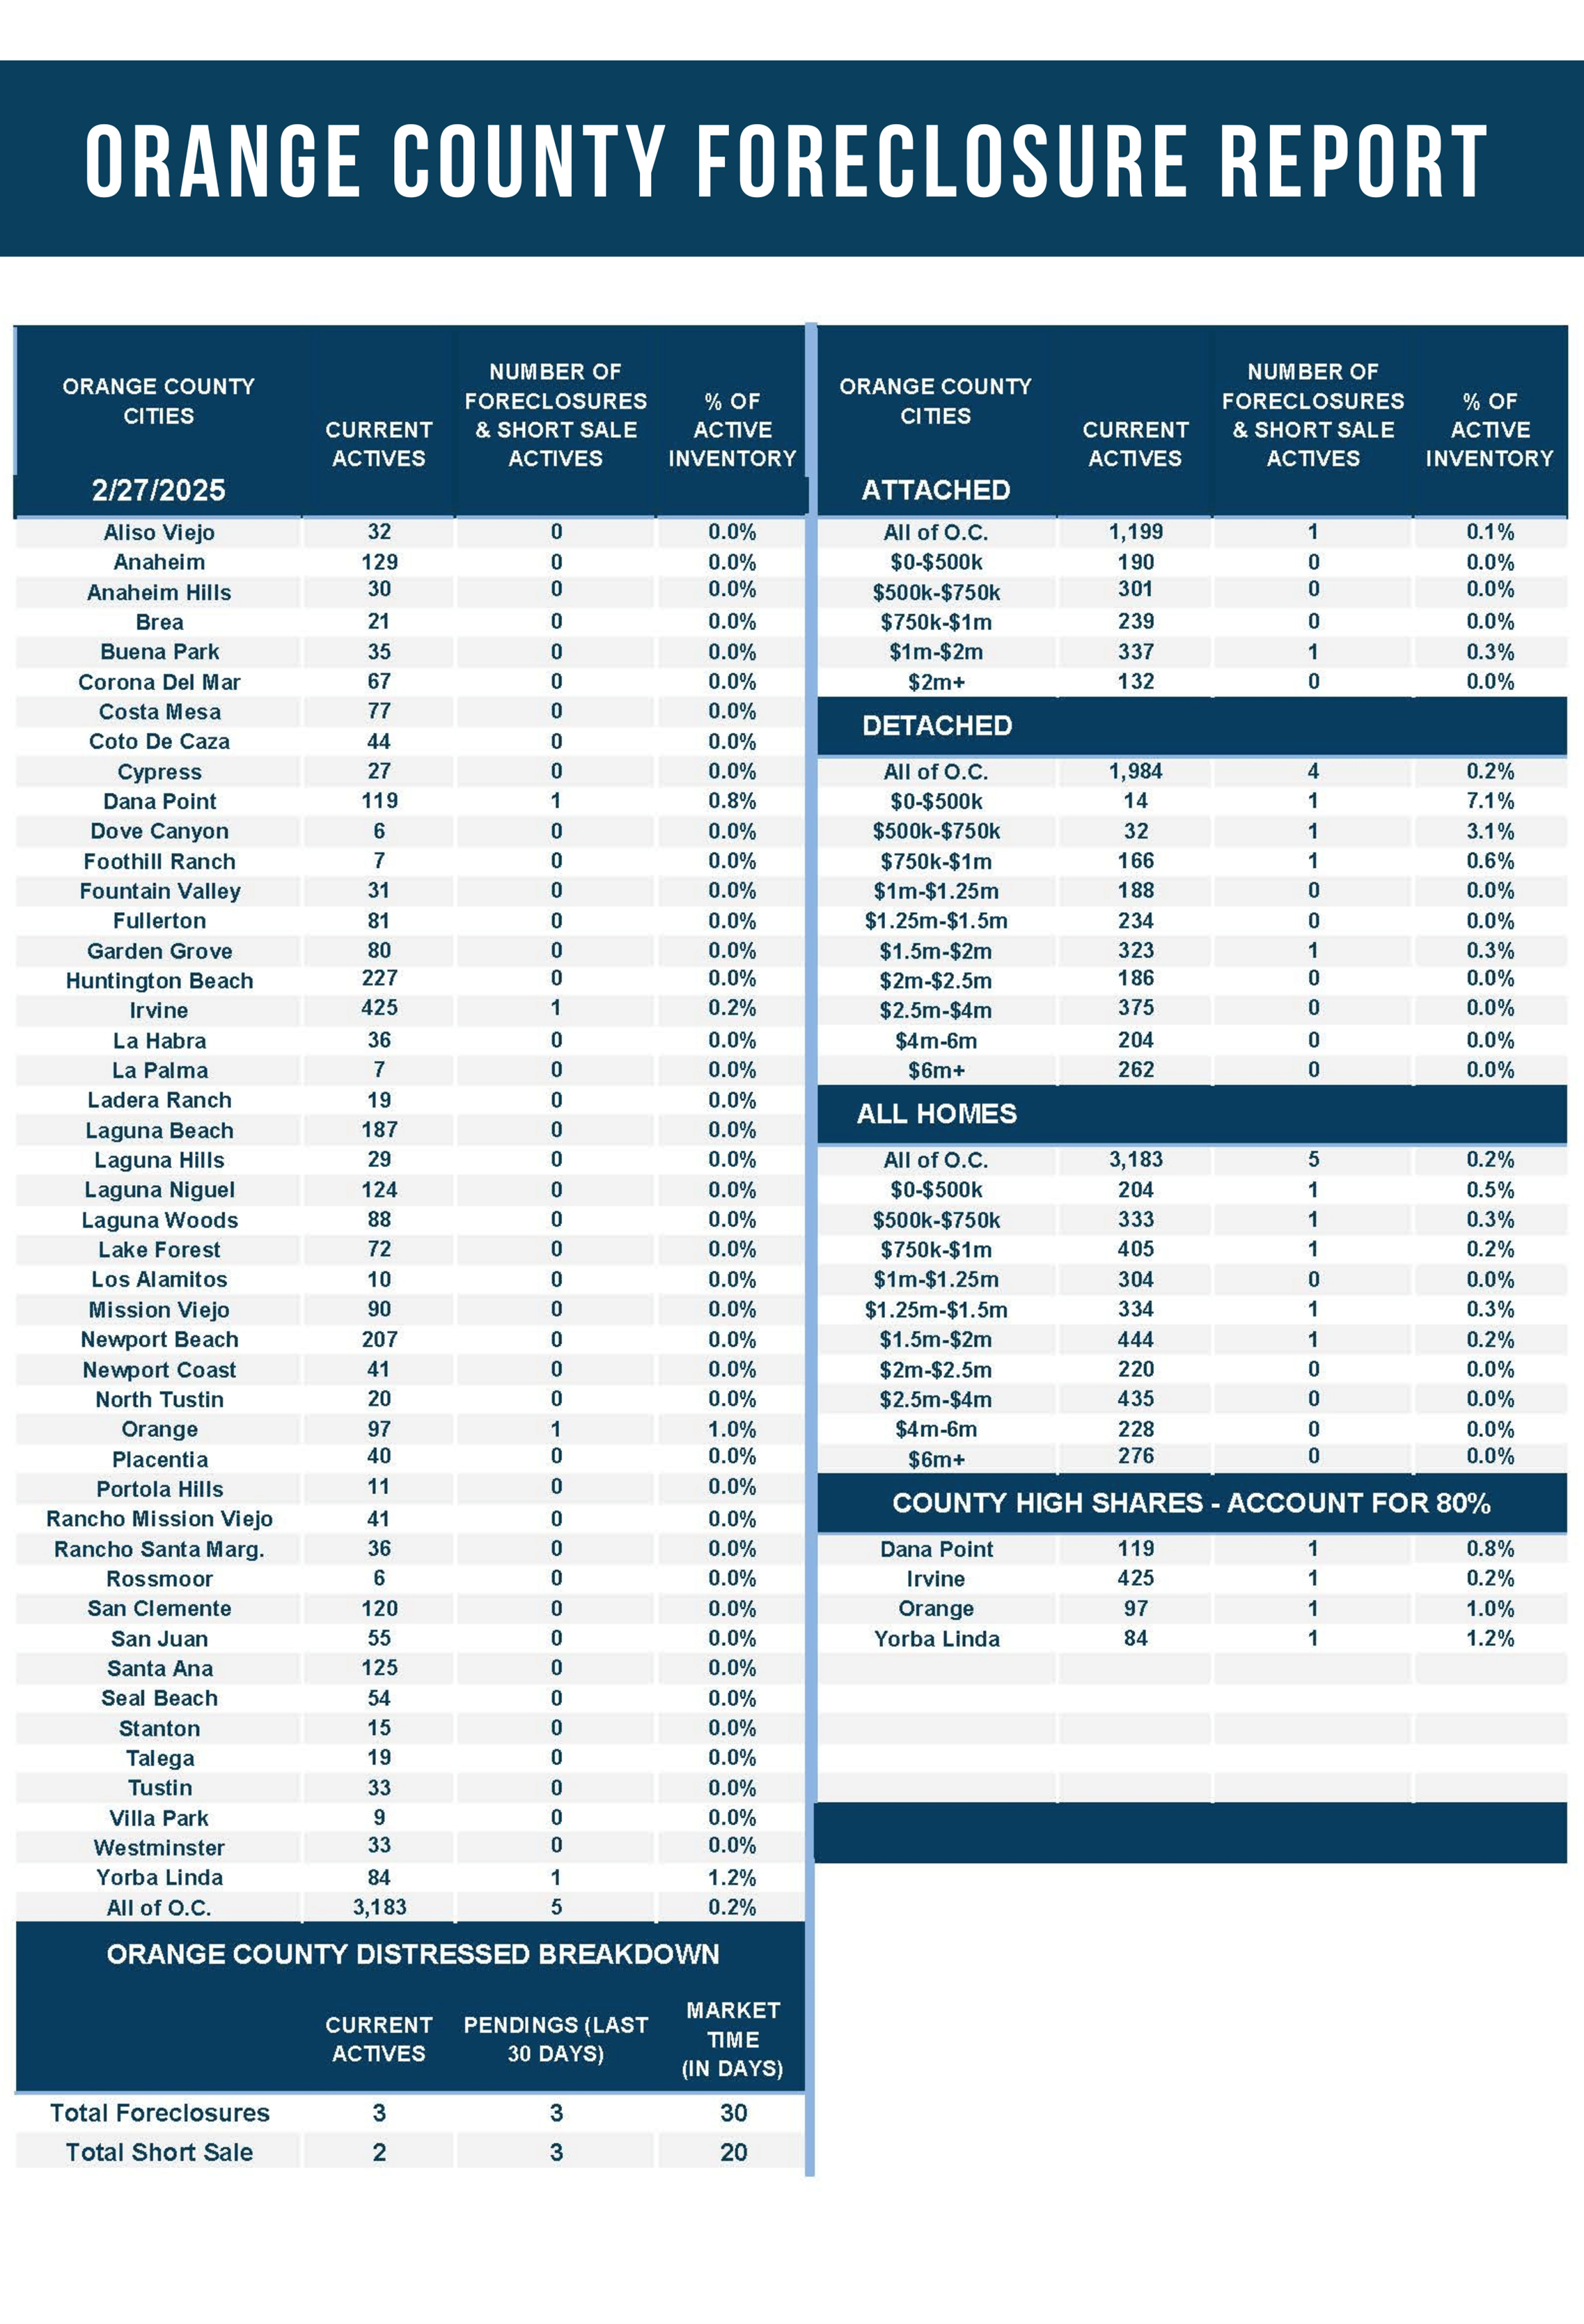
- Distressed homes, both short sales and foreclosures combined, comprised only 0.2% of all listings and 0.4% of demand. Only three foreclosures and two short sales are available today in Orange County, with five total distressed homes on the active market, down one from two weeks ago. Last year, six distressed homes were on the market, similar to today.
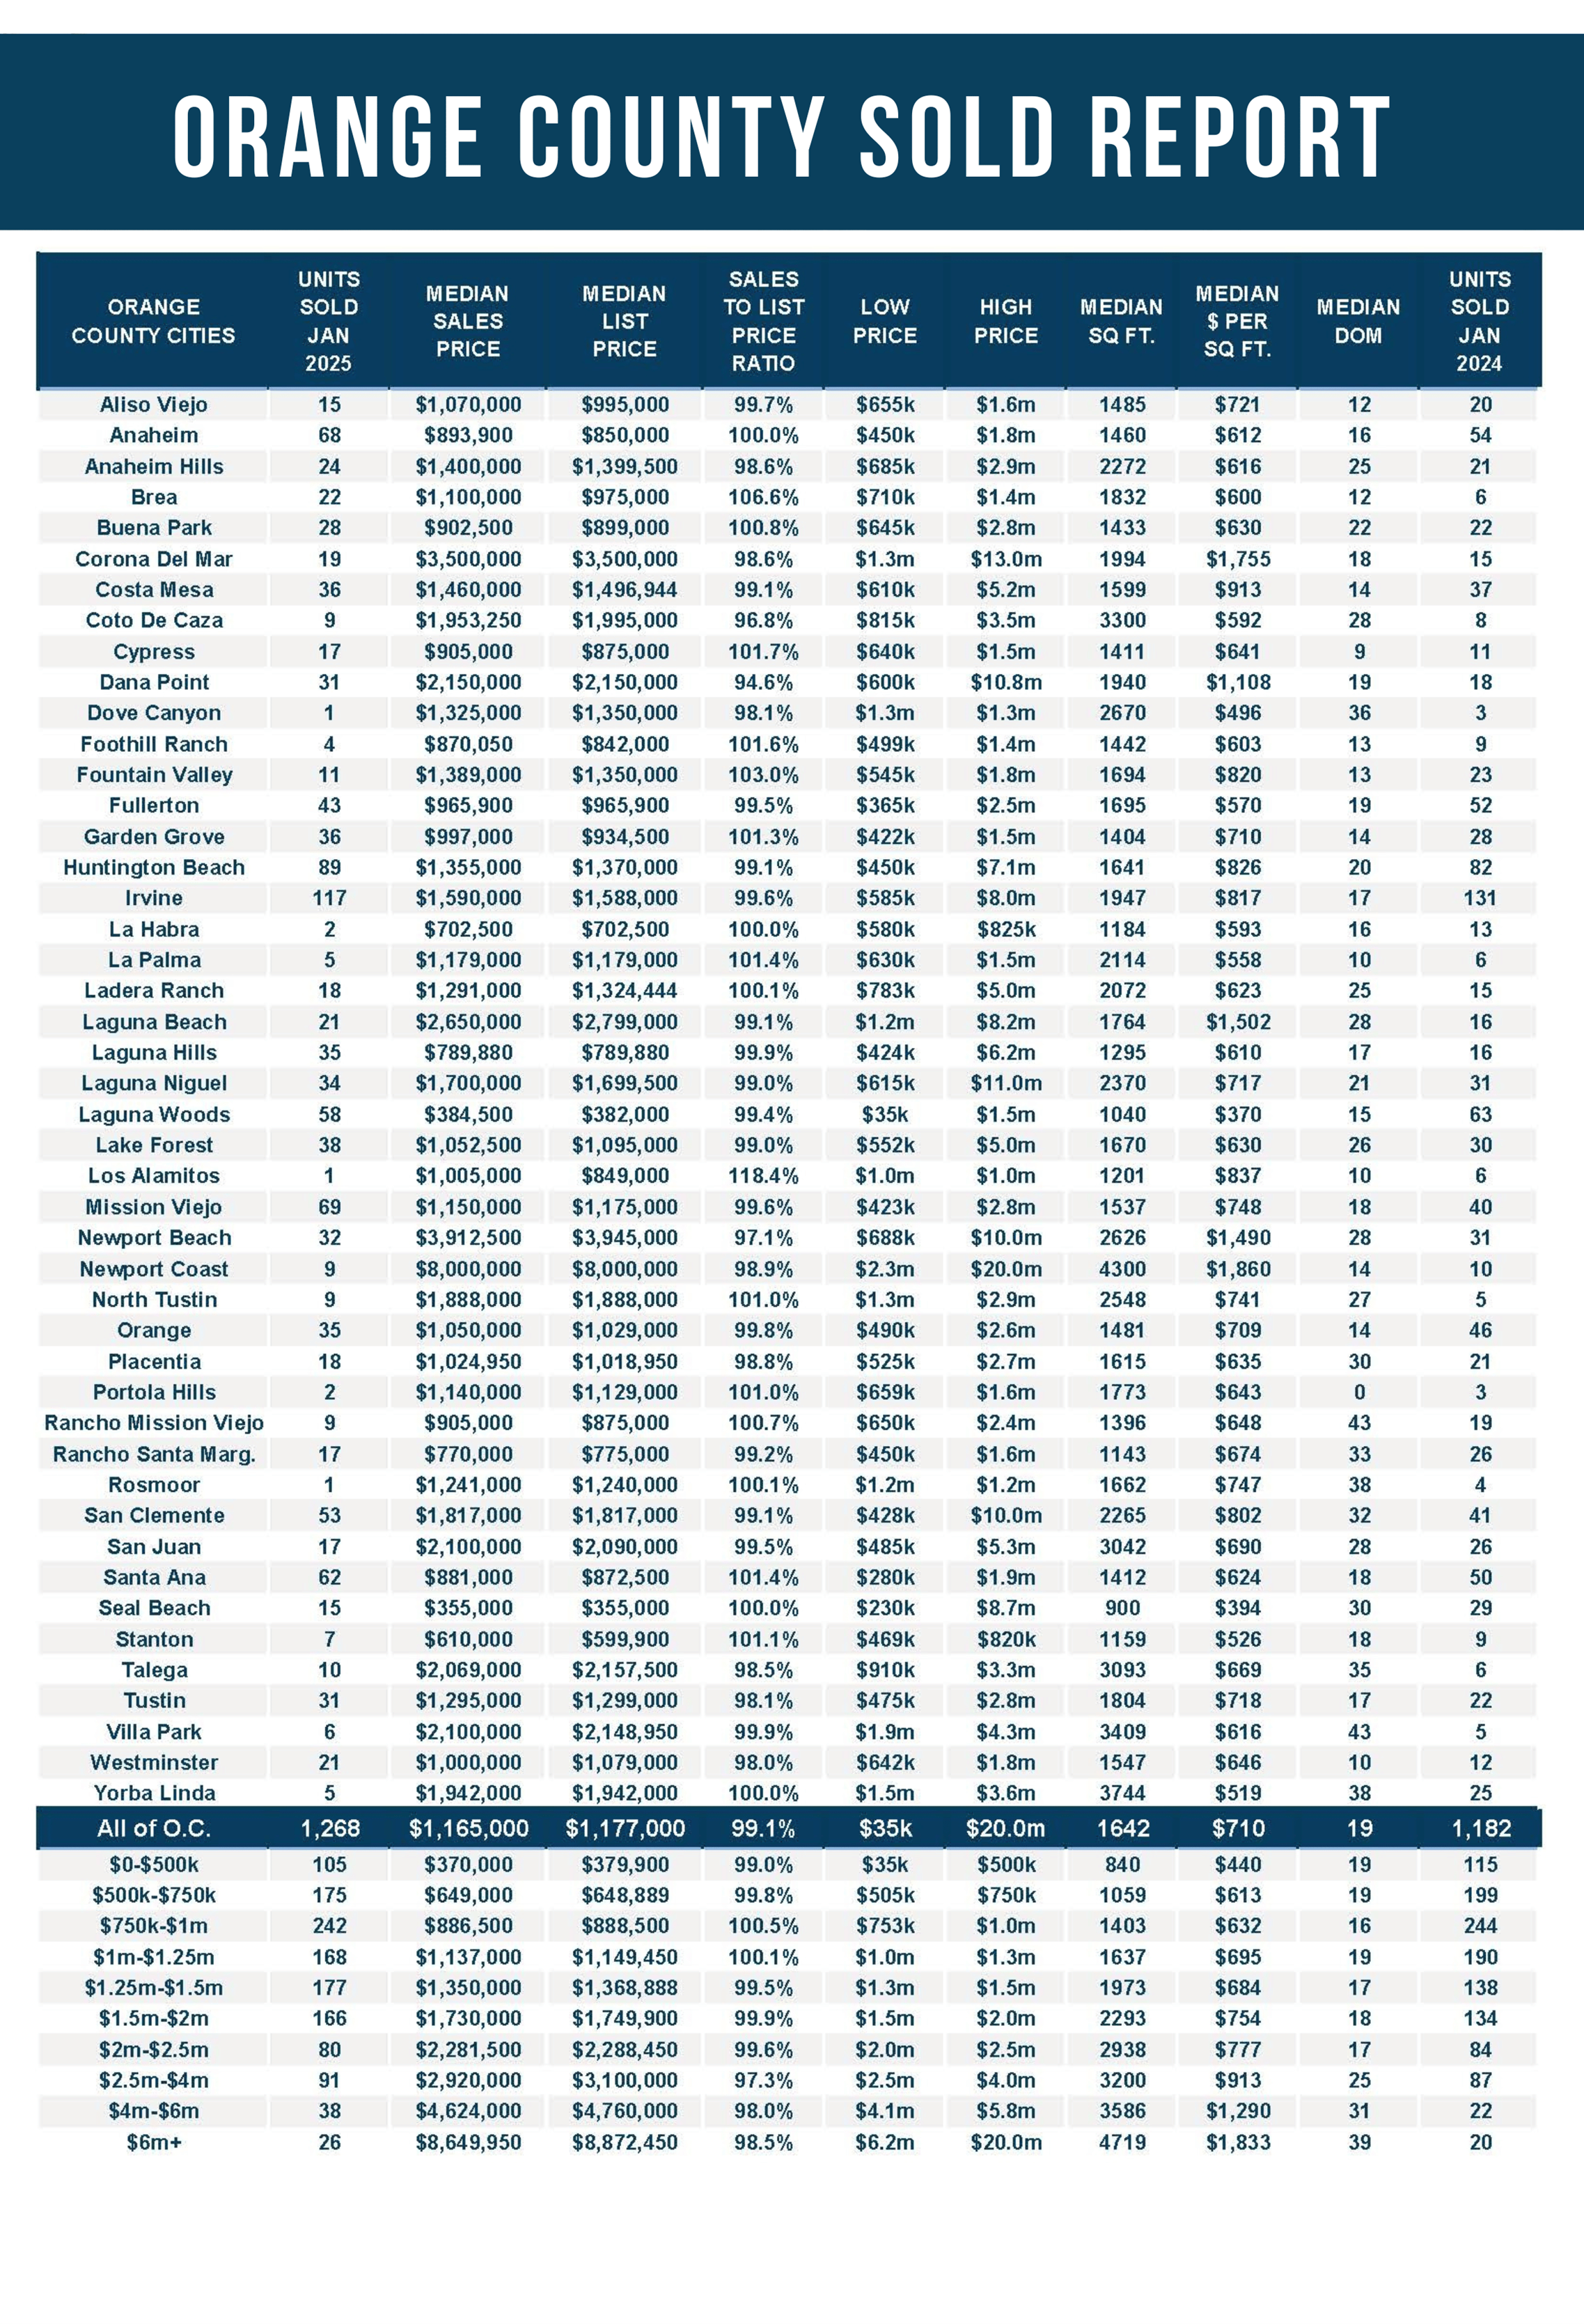
- There were 1,268 closed residential resales in January, up 7% compared to January 2024’s 1,182 and down 22% from December 2024. The sales-to-list price ratio was 99.14% for Orange County. Short sales accounted for 0.1% of all closed sales, and there were no foreclosures. That means that 99.9% of all sales were good ol’ fashioned sellers with equity.
Have a great week.
Sincerely,
Steven Thomas
Quantitative Economics and Decision Sciences
Copyright 2025—Steven Thomas, Reports On Housing—All Rights Reserved. This report may not be reproduced in whole or in part without express written permission from the author.