January 6, 2025
This year’s start is slower than the strong start to 2024 due to an elevated number of available homes, subdued demand, and a higher mortgage rate environment.
The 2025 Start
The supply level may be low, but it is much higher than last year and is matched up against very little demand.
Climbing into the car in January can be extremely challenging. It is so cold! The seats are cold. The steering wheel is cold. After initially turning on the heat, even the air that blows out of the vents is cold. Upon backing out of the driveway and heading down the street, eventually, the air starts to heat up. Slowly but surely, the air gets warmer and warmer. It takes a while for the warmth to return to the hands.
That is precisely how the housing market starts each year. The market is cold and will take a few weeks to heat up. It takes a while for buyers and potential sellers to shake off the holiday fog that consumes everyone. The Holiday Market continues to run through mid-January, when nearly everyone gives up on their New Year’s resolutions. Housing will thaw by the end of January, and the warmth will return.
This year’s start is similar to many prior years. It is not as slow as some, but certainly not as instant as 2021 and 2022. Last year was a much hotter start with a very limited number of available homes. The 2025 kickoff is different because of a buildup in inventory. The buildup is a direct result of the higher mortgage rate environment. Demand was muted due to affordability constraints. Mortgage rates were stuck above 7% for the better part of last year, throughout the entire Spring Market and most of the Summer Market. The 7% mortgage rate is a psychological barrier to the housing market. It prevents many buyers from pulling the trigger on a home.
The Orange County housing market is particularly rate-sensitive. As mortgage rates migrate higher, demand slows, and the market speed slows. When rates fall, demand rises, and the housing market speeds up. In mid-July 2024, mortgage rates did drop below 7% with duration. They even dropped below 6.5% for 42 days from the end of August to the start of October. This resulted in more demand and the housing market heating up. Yet, with stronger economic readings and a change in political parties in the White House, 30-year mortgage rates popped above 7% in late October and November. Today, according to Mortgage News Daily, rates are at 7.1%. They have been stuck above the 7% threshold since December 18th.
In looking at the details, this year’s slower start is due to sky-high mortgage rates. At 7.1%, it is the highest mortgage rate to start a year since 2001, when it was just over 8%. In both 2021 and 2022, mortgage rates experienced back-to-back record low starts to the year at 2.65% and 3.22%. Yet, the Federal Reserve raised the Federal Funds rate 11 times between March 2022 and July 2023. As a result, 2023 through 2025 have all been years with the highest starting mortgage rates in years.
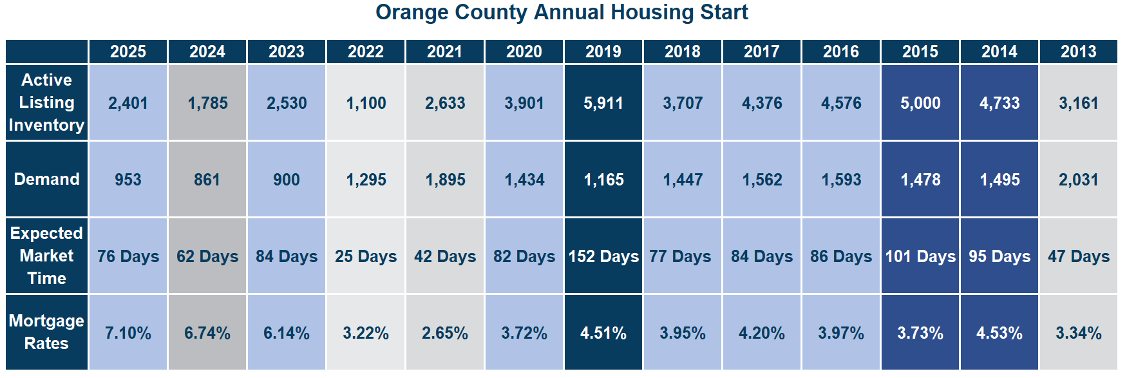
After a late peak in September 2024 at 3,695, a substantial 48% higher than the 2023 peak, the inventory dropped by 35% to where it stands today at 2,401. The active listing inventory is currently at the third lowest level since tracking began in 2004, only behind 2022 and 2024. The average start from 2013 through 2020 was 4,421, an eye-opening 84% more. That is an extra 2,020 available homes. Significantly contributing to today’s supply scarcity is that fewer homeowners will give up their underlying, low, fixed-rate mortgages. An astonishing 81% of all Californians with a mortgage have a fixed rate at or below 5% (Q-3 2024). In 2024, there were 12,383 missing FOR-SALE signs compared to the 3-year average before COVID (2017 to 2019), 32% fewer. That was an improvement from the 16,023 missing signs in 2023, but the unwillingness of homeowners to sell continues to impact the supply of available homes. Mortgage rates have been stuck above 6% since August 2022, and more homeowners are getting impatient in waiting for rates to fall so that they can list their homes for sale, so in 2025, there will be further improvement in the number of FOR-SALE signs.
Demand (a snapshot of the last 30 days of pending sales activity) has dropped to record low levels last seen during the Great Recession. While 2025 is the highest start since 2022, it is nonetheless at a very anemic low level, the third lowest since tracking began in 2004, only behind 2022 and 2023, with only 953 pending sales. The average initial pre-pandemic demand reading from 2013 through 2020 was 1,526, an emphatic 60% higher than today.
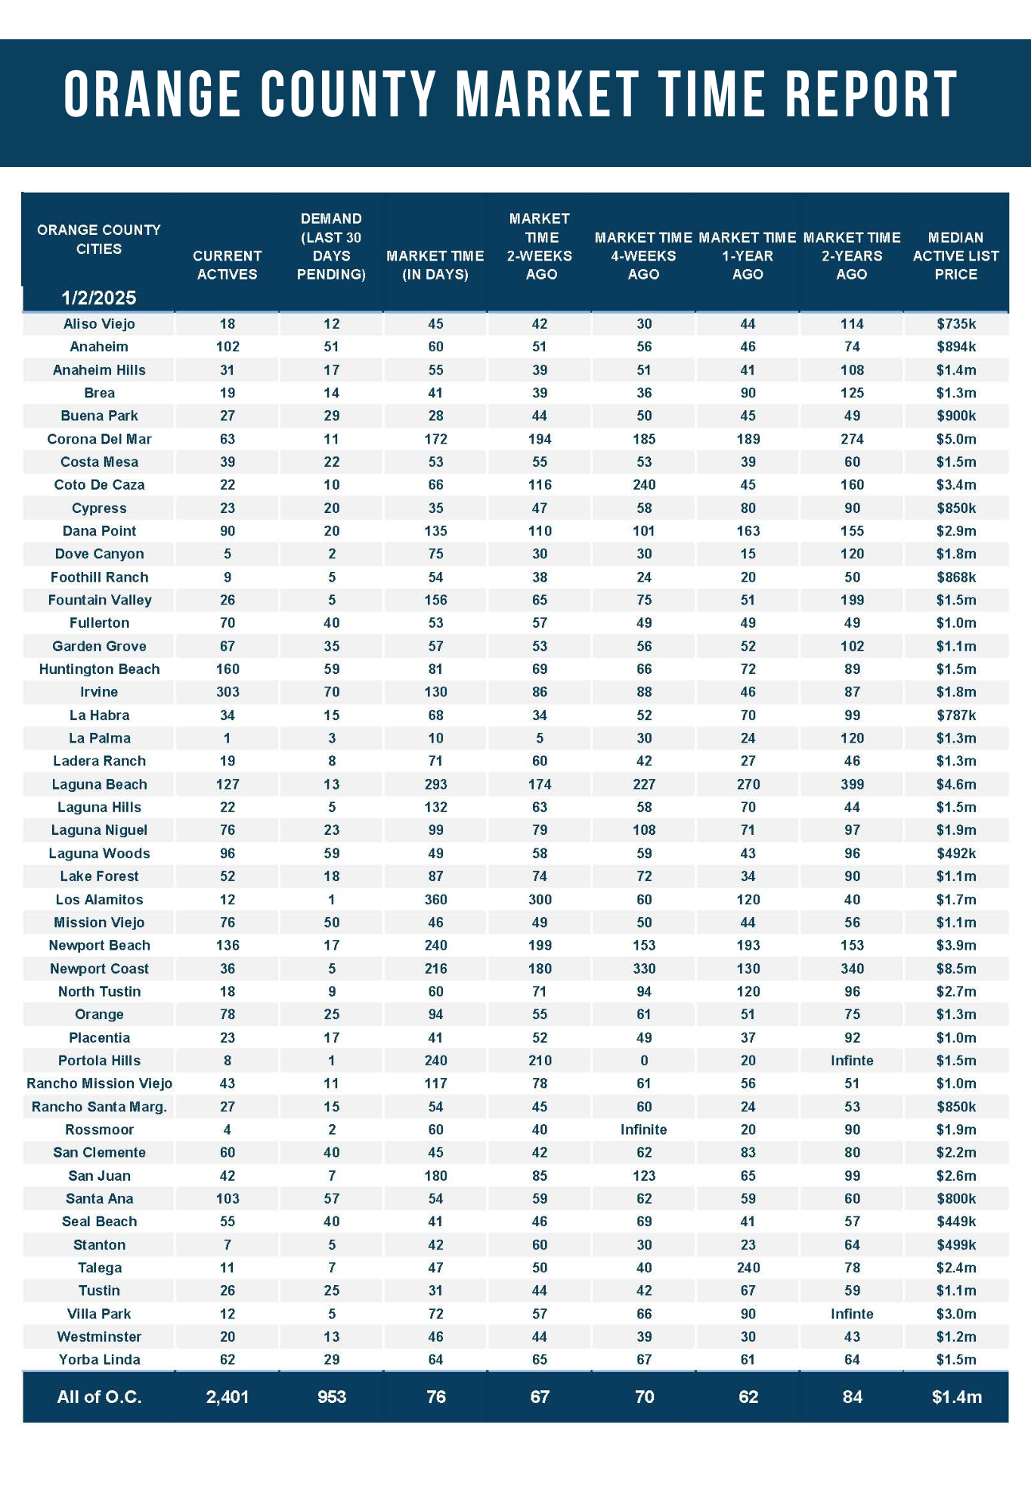
Today’s inventory may be the third lowest to start a year, yet when it is combined with record low demand levels, the Expected Market Time is far from instantaneous like it was in 2021 and 2022. Instead, it is similar to 2016 through 2018, 2020, and 2023, with an Expected Market Time of 76 days, significantly slower than last year’s 62 days. It would be considered “normal” before COVID, even a bit hotter. The average start from 2013 to 2020 was an Expected Market Time of 91 days, an additional 15 days, nearly two weeks longer. Yet, when the general public anticipates faster markets like 2021, 2022, and 2024, it is best to recalibrate everyone’s housing expectations. If rates remain elevated, expect a substantially slower Winter Market, from mid-January through mid-March, than last year.
ATTENTION BUYERS: The market will heat up as housing transitions to the Winter Market. Expect demand to grow substantially from now until the start of spring, while inventory will only slowly rise. Many homeowners wait until the spring to place their homes on the market, with May being the peak month for the number of new FOR-SALE signs. With demand climbing much faster than supply, the Expected Market Time will drop considerably until reaching a bottom in March or April, the hottest time of the year for housing. Keep in mind that most sellers do not have to sell, so they will be reluctant to give up much on price.
ATTENTION SELLERS: Proper pricing is crucial in securing success. As long as rates remain above 7%, buyers will be unwilling to stretch in price and will carefully examine the pros and cons of every home before even taking a look, most notably the asking price. A realistic price will allow a seller to attract immediate interest. Sellers who overprice will result in wasted market time and less activity before ultimately reducing. Sellers should sharpen their pencils and meticulously scrutinize all recent comparable pending and closed sales to arrive at their home’s Fair Market Value.
Active Listings
The inventory plunged by 11% in the past couple of weeks.
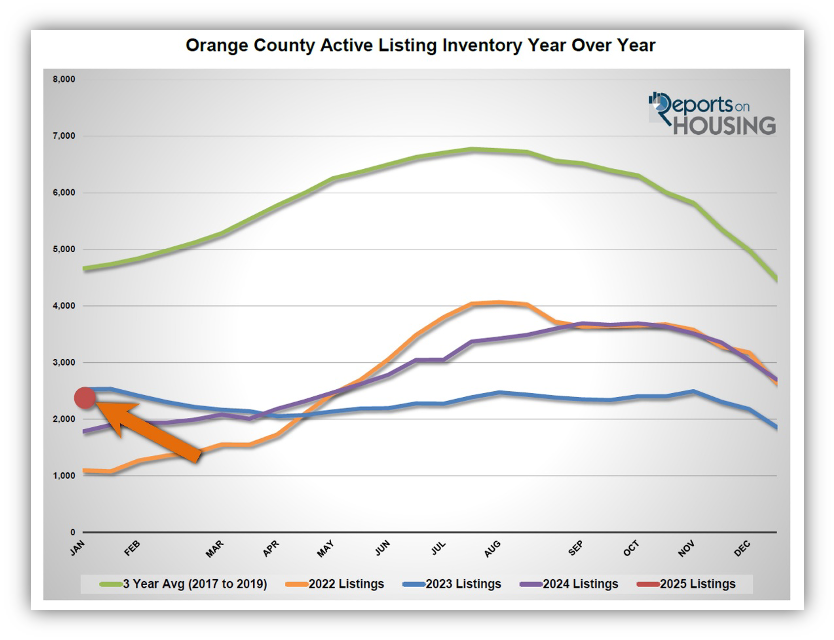
The active listing inventory decreased by 298 homes in the past two weeks, down 11%, and now sits at 2,401, its lowest level since last April. It was the third lowest start to a year since tracking began in 2004, behind 2022’s 1,100 homes and 2024’s 1,785. The inventory cyclically plunges during the Holiday Market through the end of December due to the fewest homes coming on the market in November and December and plenty of unsuccessful sellers who throw in the towel due to a lack of success. In addition, fewer homes are coming on the market as homeowners choose to “hunker down.” Expect the inventory to slowly grow from here and pick up the pace during the spring. In January, the number of homes entering the fray doubles from December. It remains elevated in February and then ramps up from March through July. The most homes come on the market in May. This year will be no different.
Last year, the inventory was at 1,785 homes, 26% lower, or 616 fewer. The 3-year average before COVID (2017 through 2019) was 4,665, an additional 2,264 homes, or 161% more.
Homeowners continue to “hunker down” in their homes, unwilling to move due to their current underlying, locked-in, low fixed-rate mortgage. It became a crisis once rates skyrocketed higher in 2022. For December, 1,198 new sellers entered the market in Orange County, 296 fewer than the 3-year average before COVID (2017 to 2019), 20% less. Last December, there were 1,023 new sellers, 15% fewer than this year. More sellers are opting to sell compared to the previous year.
Demand
Demand plunged by 21% in the past couple of weeks.
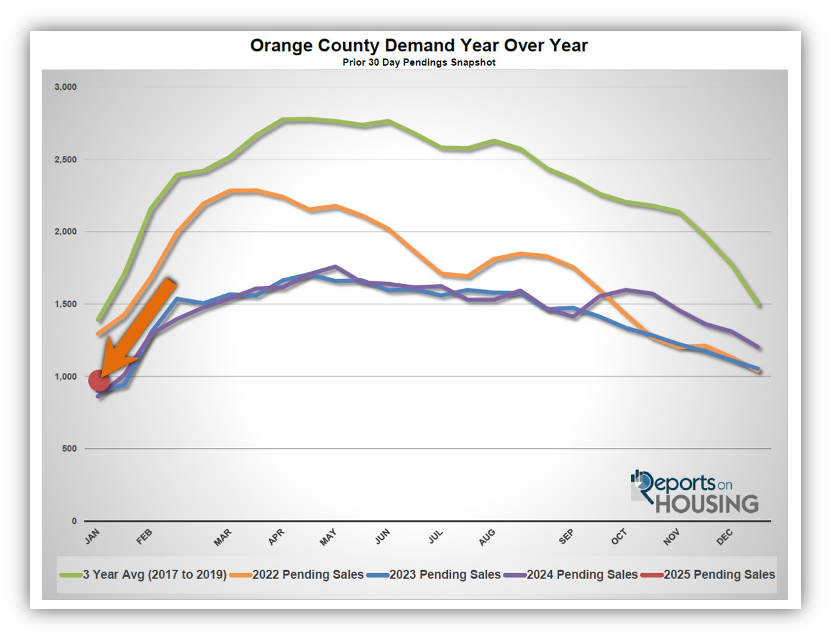
Demand, a snapshot of the number of new pending sales over the prior month, decreased from 1,204 to 953 in the past couple of weeks, down 251 pending sales, or 21%, its third lowest initial January reading since tracking began in 2004 behind 2023 and 2024. Demand typically plunges through the end of December. Today’s reading will be the weakest of the year. Contributing to low demand is the high mortgage rate environment. The market is very interest rate-sensitive. There is plenty of potential for demand to rise substantially higher than last year, but rates need to drop below 7% with duration during the Spring and Summer Markets.
As the Federal Reserve has indicated, watching all economic releases for signs of slowing is essential. That is the only path to lower mortgage rates right now. These releases can potentially move mortgage rates higher or lower, depending on how they compare to market expectations. This week is jobs week, which includes the number of job openings, wages, and the number of jobs created or lost, one of the month’s most important economic data points. Next week is the release of the Producer Price Index (PPI) and the Consumer Price Index (CPI), two crucial inflation indicators. Finally, next Thursday, Retail Sales will be released. It is going to be a pivotal two weeks for mortgage rates.
Last year, demand was 861, with 92 fewer pending sales or 10% less. The 3-year average before COVID (2017 to 2019) was 1,391 pending sales, 62% more than today, or an additional 438.
With demand falling significantly faster than supply, the Expected Market Time (the number of days it takes to sell all Orange County listings at the current buying pace) increased from 67 to 76 days in the past couple of weeks. Last year, it was 62 days, substantially faster than today. The 3-year average before COVID was 104 days, much slower than today.
Luxury End
The luxury market slowed significantly in the past couple of weeks.
In the past couple of weeks, the luxury inventory of homes priced above $2 million (the top 15% of the Orange County housing market) decreased from 897 to 796 homes, down 101 or 11%. Luxury demand plunged by 48 pending sales, down 24%, and now sits at 152, its lowest level since mid-January 2024. With demand falling much faster than supply, the Expected Market Time for luxury homes priced above $2 million increased from 135 to 157 days. The luxury market will improve extensively over the next couple of months.
Year over year, the active luxury inventory is up by 176 homes or 28%, and luxury demand is up by 37 pending sales or 32%. Last year’s Expected Market Time was 162 days, similar to today.
In the past two weeks, the expected market time for homes priced between $2 million and $4 million increased from 96 to 120 days. For homes priced between $4 million and $6 million, the Expected Market Time increased from 204 to 216 days. For homes priced above $6 million, the Expected Market Time decreased from 314 to 294 days. At 294 days, a seller would be looking at placing their home into escrow around October 2025.
Orange County Housing Summary
- The active listing inventory in the past couple of weeks plunged by 298 homes, down 11%, and now sits at 2,401, its lowest level since last April. It was the third lowest start to a year since tracking began in 2004, behind 2022 and 2024. In December, 20% fewer homes came on the market compared to the 3-year average before COVID (2017 to 2019), 296 less. Yet, 175 more sellers came on the market this December compared to December 2023. Last year, there were 1,785 homes on the market, 616 fewer homes, or 26% less. The 3-year average before COVID (2017 to 2019) was 4,665, or 161% extra.
- Demand, the number of pending sales over the prior month, plunged by 251 pending sales in the past two weeks, down 21%, and now totals 953, its third lowest start to the year since tracking began in 2004 behind 2023 and 2024. Last year, there were 861 pending sales, 10% fewer. The 3-year average before COVID (2017 to 2019) was 1,391, or 62% more.
- With demand falling much faster than supply, the Expected Market Time, the number of days to sell all Orange County listings at the current buying pace, increased from 67 to 76 days in the past couple of weeks. The 3-year average before COVID (2017 to 2019) was 104 days, slower than today.
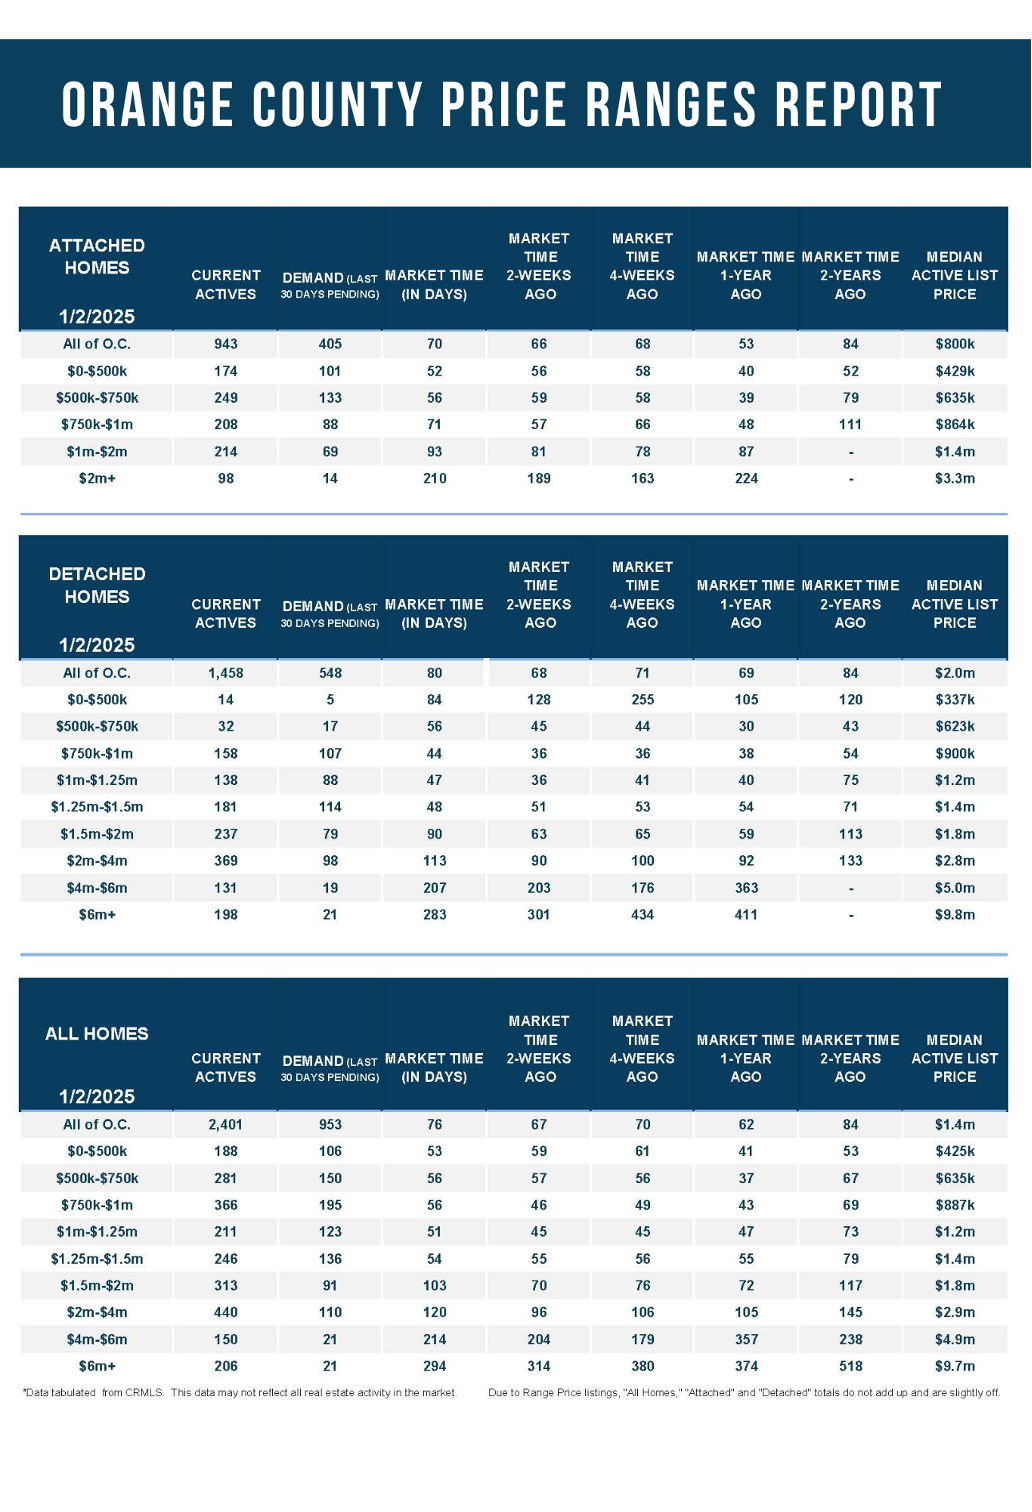
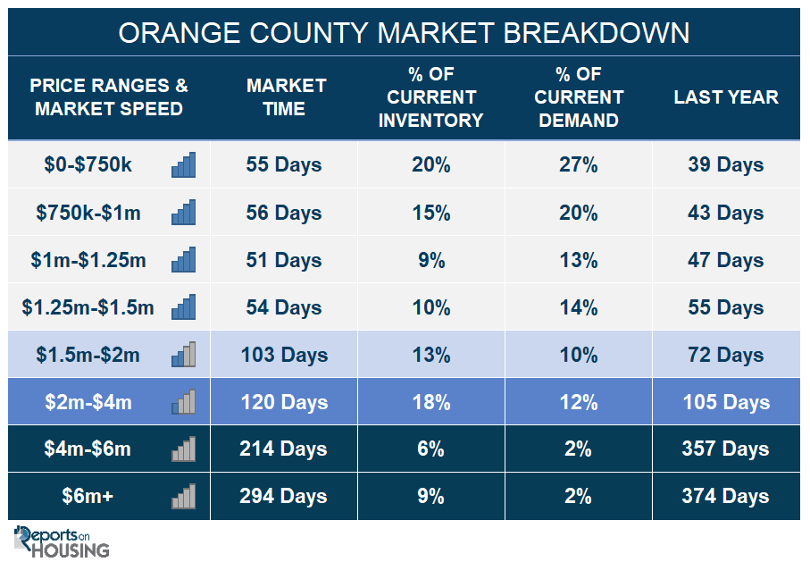
- In the past two weeks, the Expected Market Time for homes priced below $750,000 decreased from 58 to 55 days. This range represents 20% of the active inventory and 27% of demand.
- The Expected Market Time for homes priced between $750,000 and $1 million increased from 46 to 56 days. This range represents 15% of the active inventory and 20% of demand.
- The Expected Market Time for homes priced between $1 million and $1.25 million increased from 45 to 51 days. This range represents 9% of the active inventory and 13% of demand.
- The Expected Market Time for homes priced between $1.25 million and $1.5 million decreased from 55 to 54 days. This range represents 10% of the active inventory and 14% of demand.
- The Expected Market Time for homes priced between $1.5 million and $2 million increased from 70 to 103 days. This range represents 13% of the active inventory and 10% of demand.
- In the past two weeks, the expected market time for homes priced between $2 million and $4 million increased from 96 to 120 days. For homes priced between $4 million and $6 million, the Expected Market Time increased from 204 to 216 days. For homes priced above $6 million, the Expected Market Time decreased from 314 to 294 days.
- The luxury end, all homes above $2 million, account for 33% of the inventory and 16% of demand.
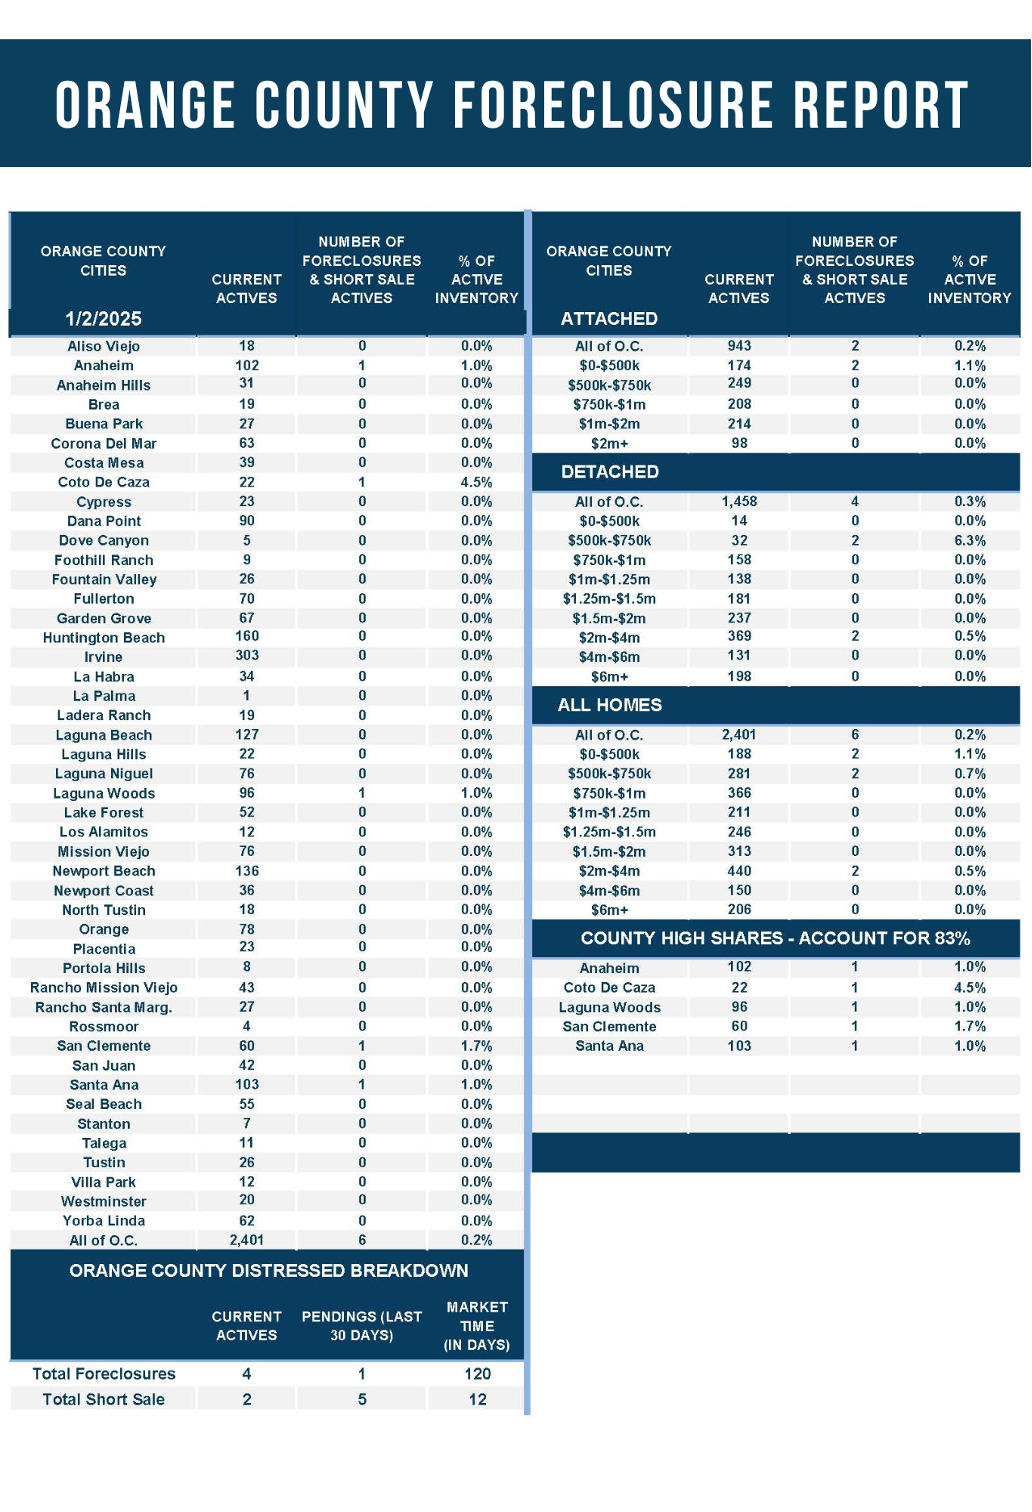
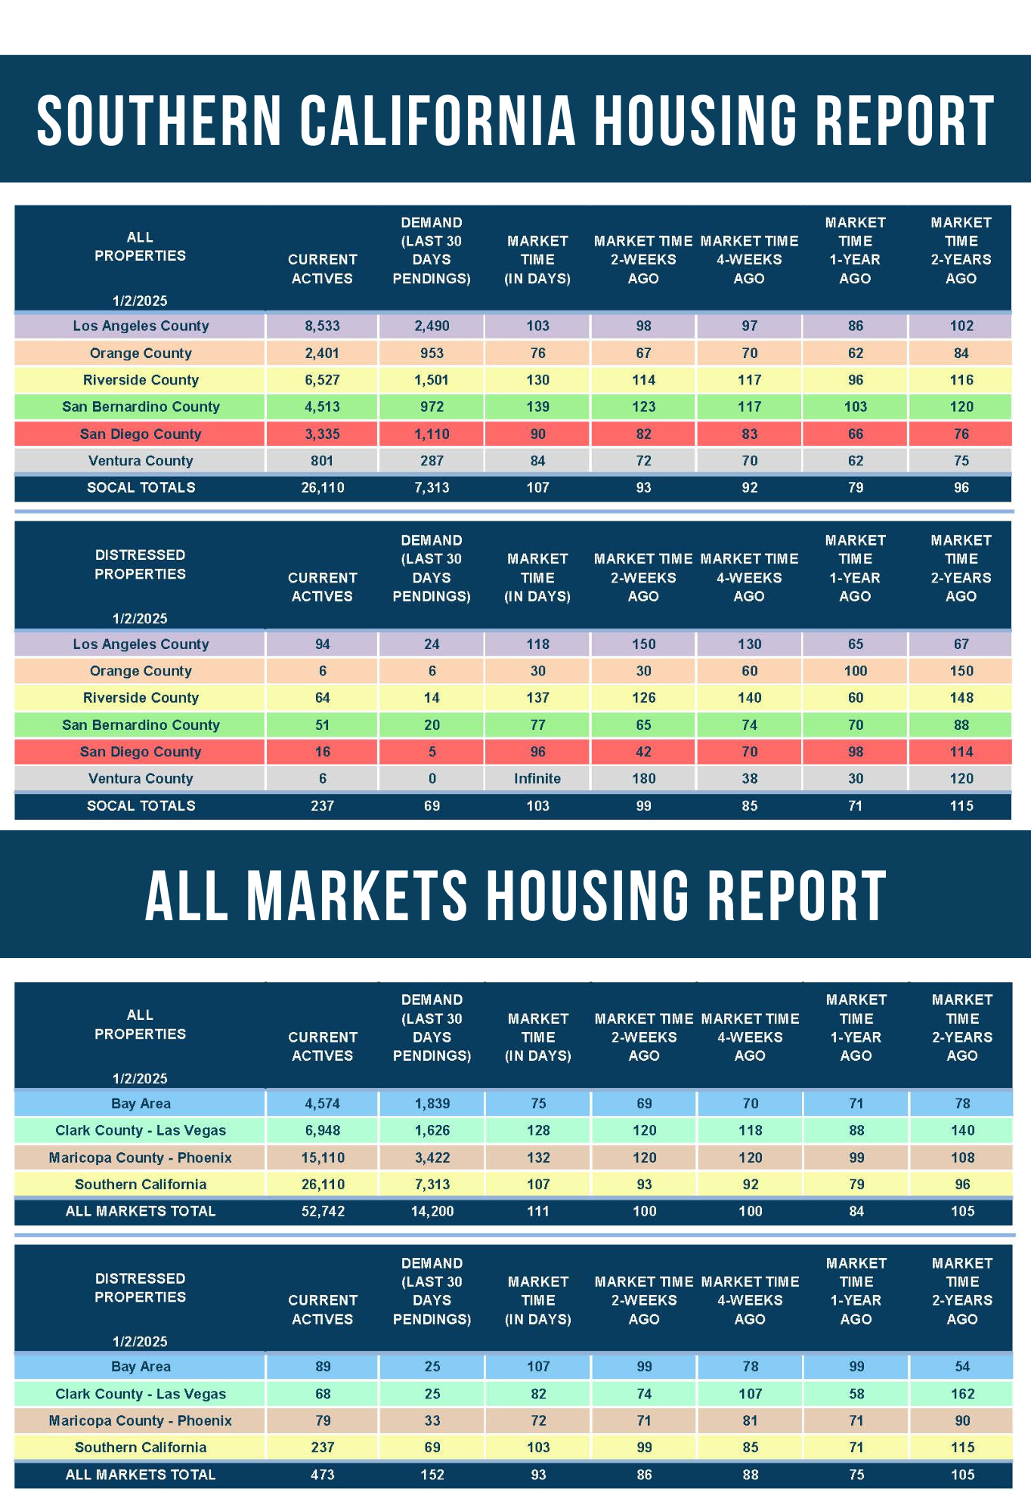
- Distressed homes, both short sales and foreclosures combined, comprised only 0.2% of all listings and 0.6% of demand. Only four foreclosures and two short sales are available today in Orange County, with six total distressed homes on the active market, unchanged from two weeks ago. Last year, ten distressed homes were on the market, similar to today.
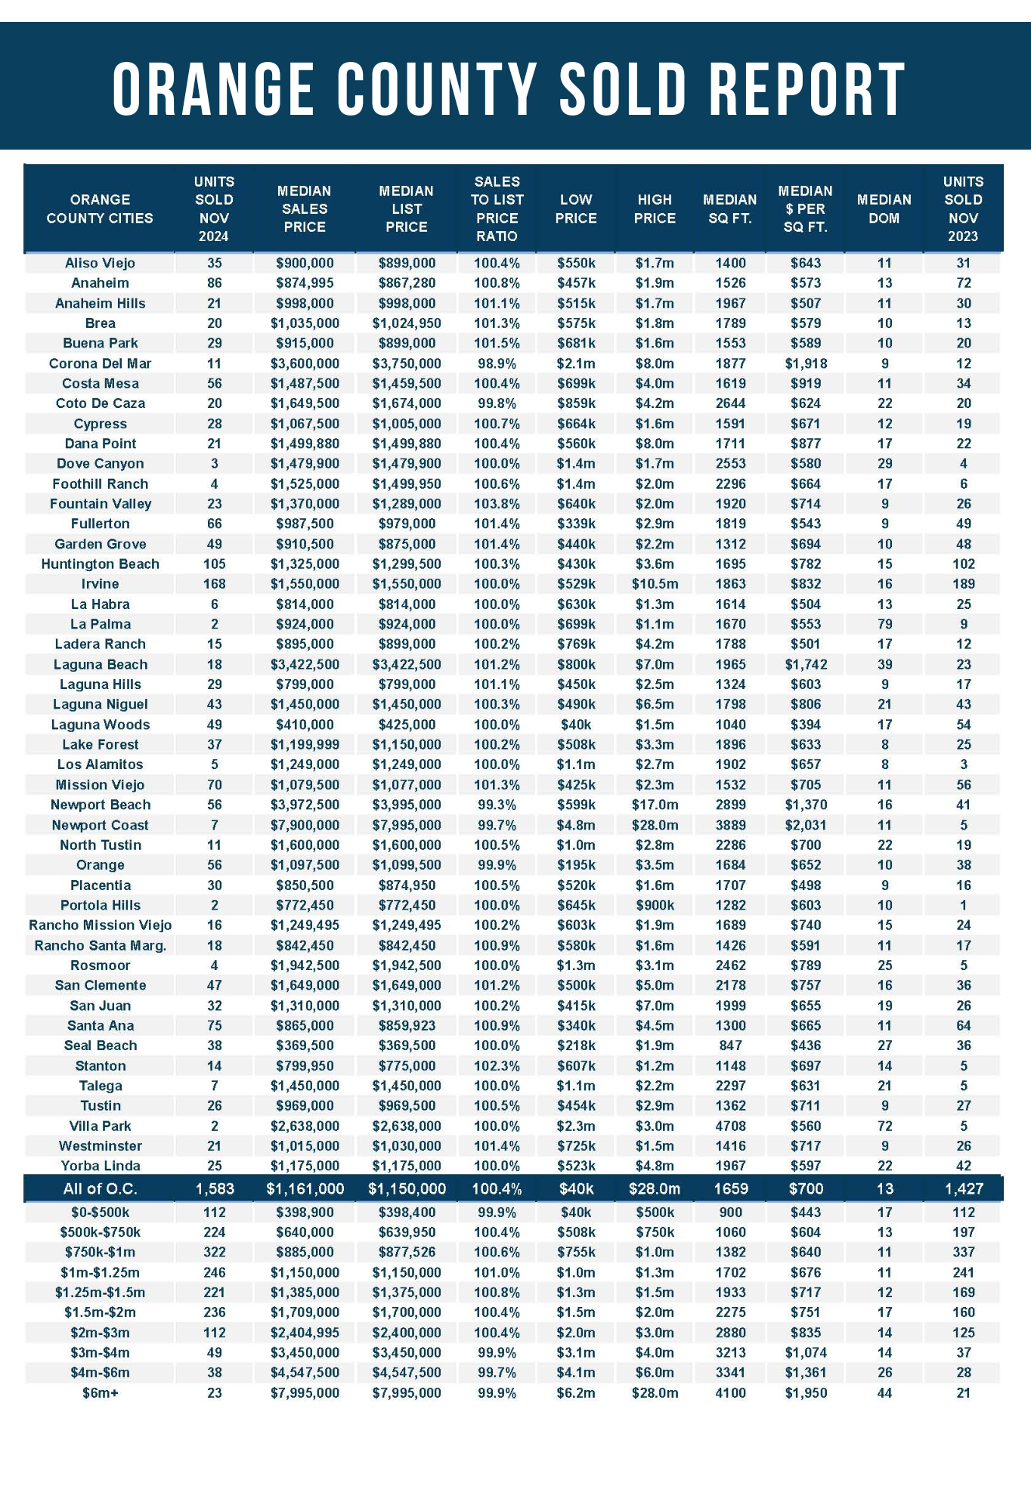
- There were 1,583 closed residential resales in November, up 11% compared to November 2023’s 1,427 and down 4% from October 2024. The sales-to-list price ratio was 100.4% for Orange County. Foreclosures accounted for 0.1% of all closed sales, and short sales accounted for 0.1%. That means that 99.8% of all sales were good ol’ fashioned sellers with equity.
Sincerely,
Steven Thomas
Quantitative Economics and Decision Sciences
Copyright 2025—Steven Thomas, Reports On Housing—All Rights Reserved. This report may not be reproduced in whole or in part without express written permission from the author.