October 14, 2024
As the inventory continues to rise, more sellers are reducing their asking prices or pulling their homes off the market altogether, indicative that far too many homes are overpriced.
Stretching the Asking Price
The number of homes pulled off the market this year compared to last year is up 21%, and 34% of the active listing inventory has reduced the asking price at least once.
Garage sales are a great way to get rid of the constant accumulation of “stuff” that is no longer used. A successful sale opens up more room and space in the garage, especially when it is a large item like a bike or furniture. Unfortunately, for many, the initial asking price is stretched to a point where nobody is interested. As the morning wears on, it is time to make a decision: lug that large piece of furniture back into the garage, unwilling to part because of price, or lower the price to a point where someone will finally buy it. There is not as much interest because the potential buyer traffic fades as the day grows longer. The price gets slashed further until someone finally agrees to the lowered price.
Similarly, many sellers jump into the housing arena and stretch the asking price for a variety of reasons, only to sit on the market with no offers and no success. They, too, must decide whether to reduce the asking price to the Fair Market Value or pull their home off the market altogether.
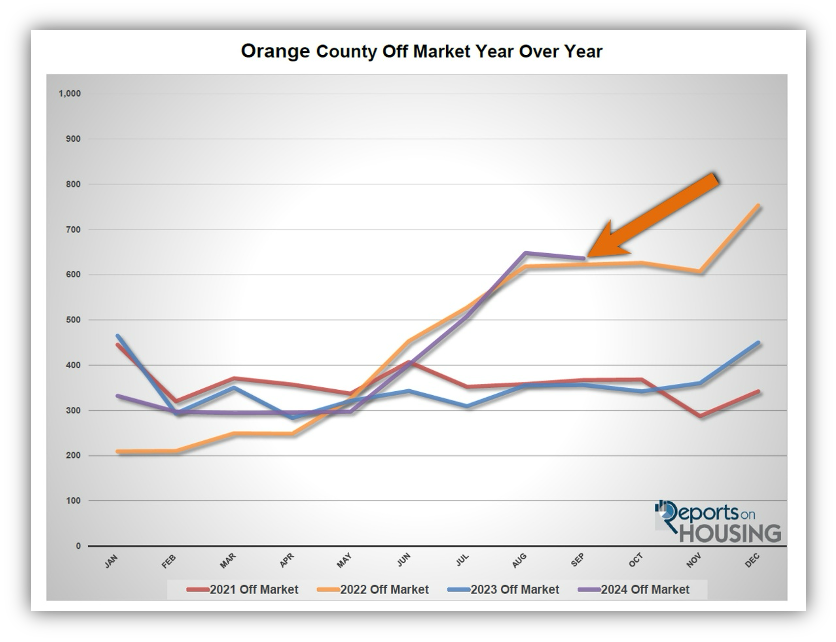
Many sellers in Orange County have thrown in the proverbial towel. Through September, 21% more homes have been pulled off the market than last year, 3,708 compared to 3,075. It was up 79% year over year in September, 636 versus 356. After a lack of success in the Spring and Summer Markets, now that the kids are back in school, sellers have realized that it is no longer the most favorable time of the year to sell.
Another telling sign that sellers have been setting unrealistic expectations is the high number of sellers adjusting their asking price. A surprising 34% of the current listing inventory has reduced the asking price at least once.
Proper pricing is essential for a seller to secure success. Many homeowners come on the market feeling that their home is the absolute best in the neighborhood and, therefore, should fetch the highest sales price, more than the most recent comparable sale. This leads to stretching the price too high and deters buyers from writing an offer.
Others increase their asking price, thinking they need to leave a little extra “cushion” for negotiations. Yet, today’s buyers are highly dialed into home values and know their specific market very well. These educated buyers look to their apps and are immediately notified of any homes that just hit the market. They quickly scour the data (bedrooms, baths, square footage, and lot size), then examine every photo and look for amenities, upgrades, location, view, condition, deferred maintenance, and curb appeal. Finally, they look at the price and determine whether the sellers are priced well or unrealistic. It is the difference between scheduling a showing or skipping over it and waiting for the next home to come on the market. Today’s sophisticated buyers do not see the higher asking price as extra “cushion” for negotiations. Instead, they see it as the price a seller desires to obtain.
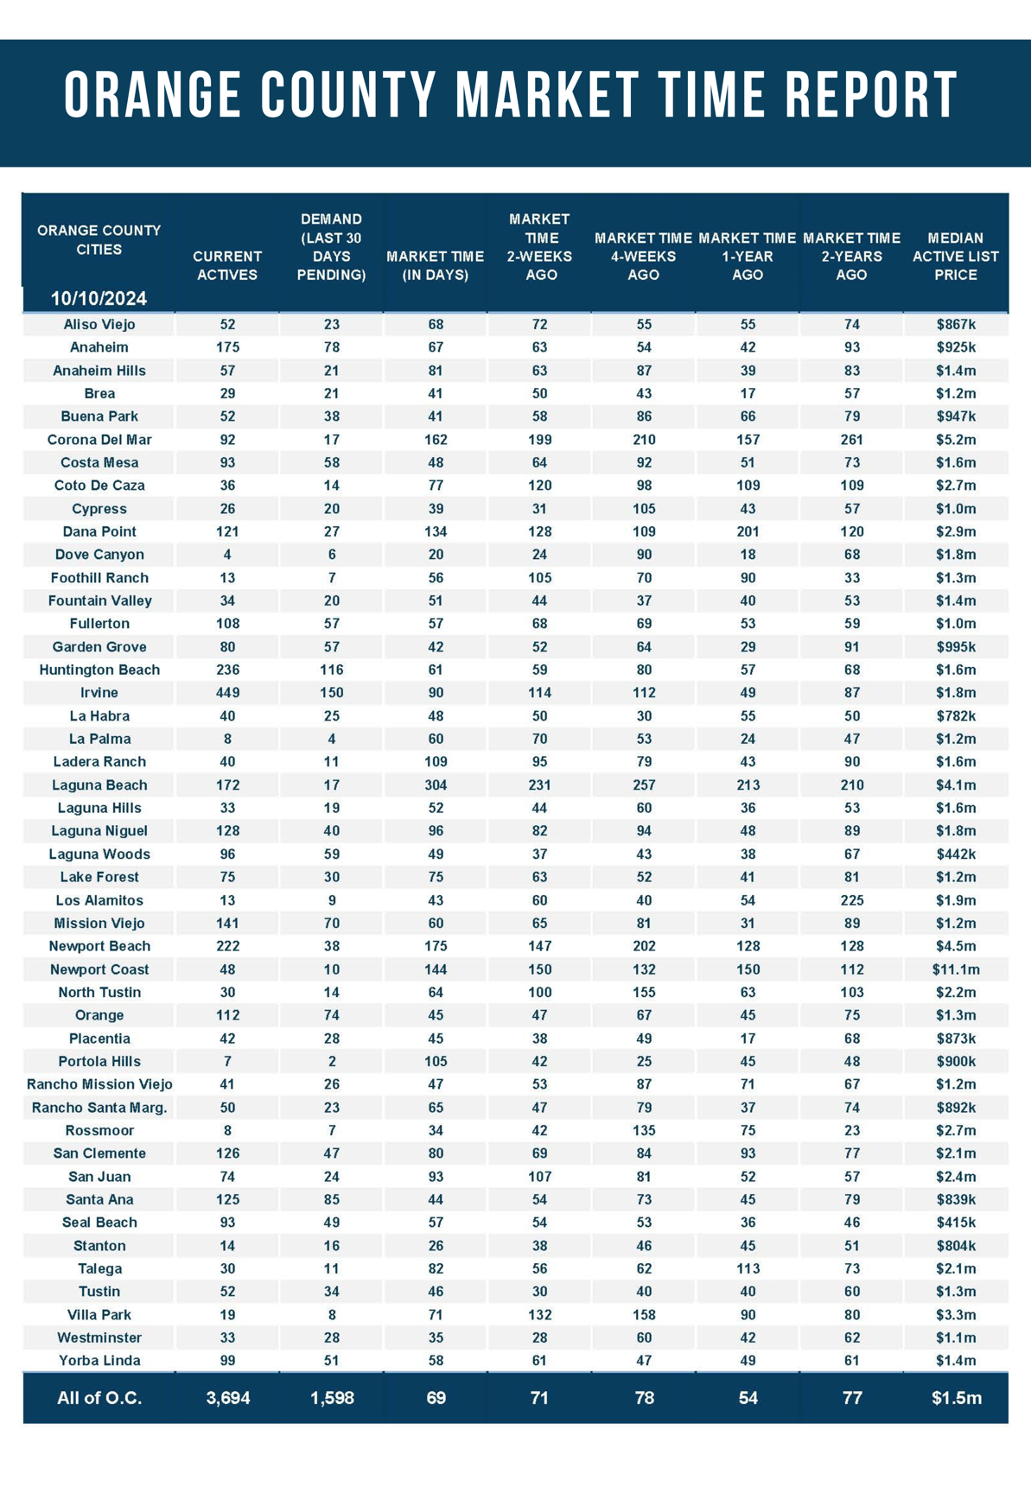
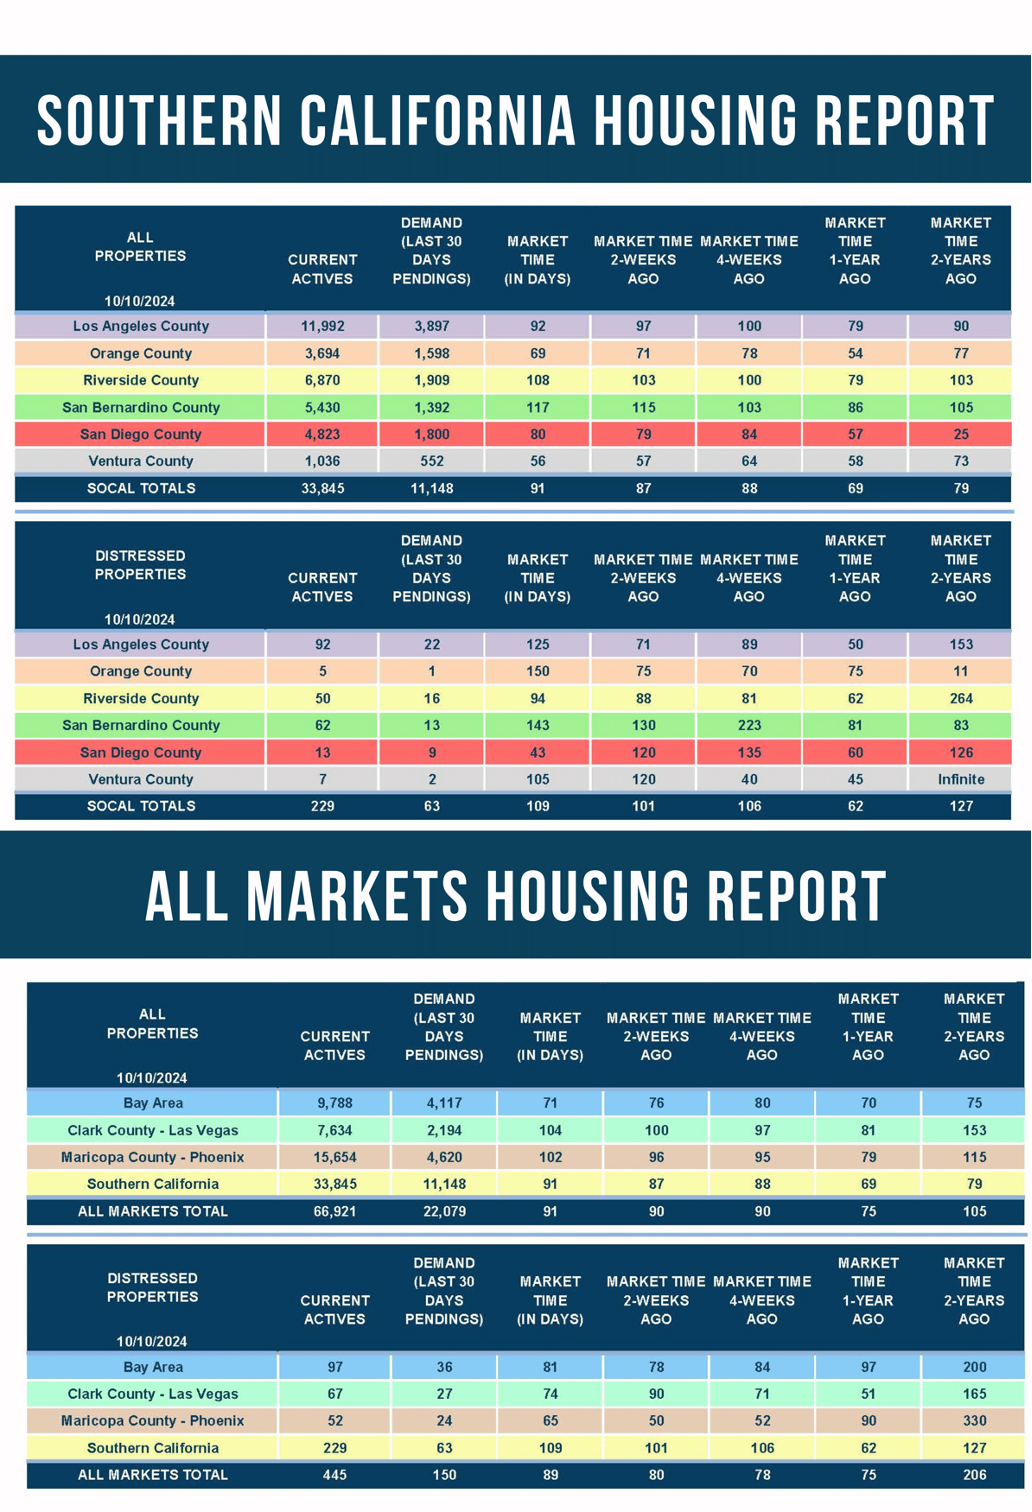
Today’s market is not instantaneous, far from it. There is a lot more seller competition. There are 3,694 homes available today compared to 2,408 last year, up an additional 53% or 1,286 extra FOR-SALE signs. The Expected Market Time (the number of days it takes to sell all Orange County listings at the current buying pace), the true speed of the market, is 69 days today compared to 54 last year. For perspective, in October 2021, when home values were soaring higher and homes were flying off the market, the Expected Market Time was 24 days, substantially faster than today.
Overpricing a home is not the answer to secure a successful outcome. The best strategy is carefully and deliberately pricing a home according to its Fair Market Value immediately upon coming on the market. The Fair Market Value is what a buyer is willing to pay for a home given its location, amenities, upgrades, and condition, considering the most recent comparable pending and closed sales.
Active Listings
The active inventory increased by 1% in the past couple of weeks.
The active listing inventory increased by 28 homes in the past two weeks, up 1%, and now sits at 3,665, almost identical to the height of the year, 3,666 homes, from four weeks ago. Typically, the active inventory peaks during the Summer Market in Orange County between July and August. Yet, a peak has yet to be reached, and the active inventory continues to climb into October. This is because more homes are coming on the market this year than in 2023. There are more FOR-SALE signs matched up against similar year-over-year demand. Interest rates had dropped to 6.1% four weeks ago but have reversed course since. If they had remained close to 6% with duration, or even dropped into the 5s for the first time since August 2022, demand would have picked up further and allowed the active listing inventory to slowly fall like it usually does during the Autumn Market. As soon as a peak is finally reached, the inventory will drop for the remainder of the year. It will plunge from mid-November through New Year’s Day.
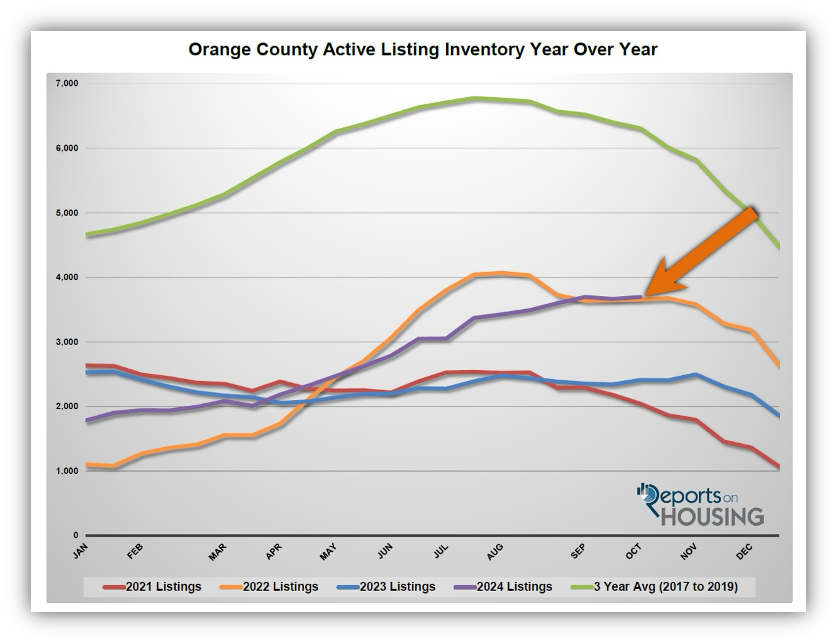
Last year, the inventory was 2,408 homes, 35% lower, or 1,286 fewer. The 3-year average before COVID (2017 through 2019) was 6,306, an additional 2,612 homes, or 71% more.
Homeowners continue to “hunker down” in their homes, unwilling to move due to their current underlying, locked-in, low fixed-rate mortgage. It became a crisis once rates skyrocketed higher in 2022. For September, 2,286 new sellers entered the market in Orange County, 743 fewer than the 3-year average before COVID (2017 to 2019), 25% less. Last September, there were 1,963 new sellers, 14% fewer than this year. More sellers are opting to sell compared to the previous year.
Demand
Demand increased by 3% in the past couple of weeks.
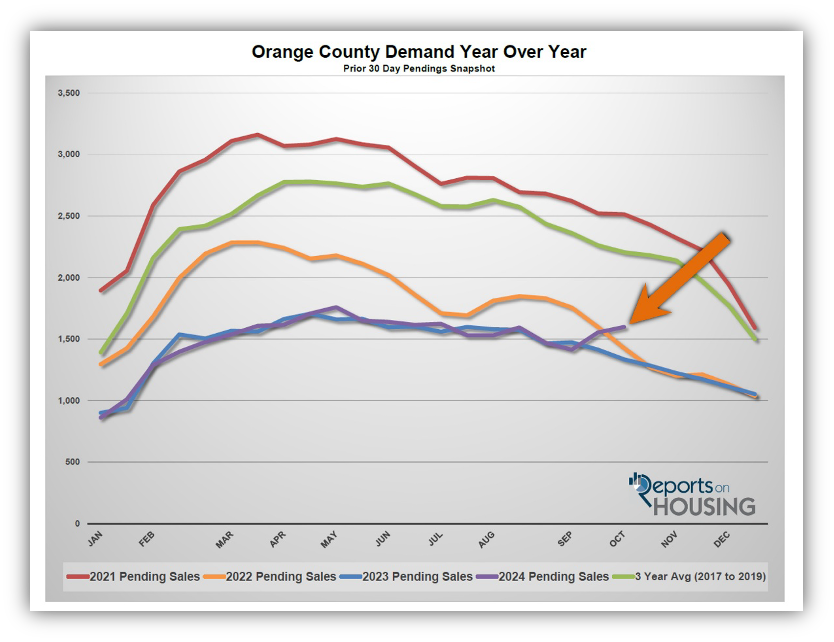
Demand, a snapshot of the number of new pending sales over the prior month, increased from 1,554 to 1,598 in the past couple of weeks, up 44 pending sales, or 3%, its highest level since July. Rates have reversed fortunes ever since the Federal Reserve cut the short-term federal funds rate by half a percent a month ago. Had rates remained at their lowest level of the year and not jumped by half a percentage point, demand would have continued to rise, and the market would have grown hotter, even during the Autumn and Holiday Markets. Buyer demand is extremely sensitive to changes in mortgage rates.
Buyers need to understand that future Federal Reservice cuts in the Federal Funds Rate (short-term rates) are already baked into today’s 30-year mortgage rates (long-term rates). The Federal Reserve did not change the Fed Funds Rate from July last year until the half-of-a-point cut in September. During that period, mortgage rates moved all over the place: from a high of 8% last October to 6.6% in December, back up to 7.5% in May, and then down to 6.1% in September just before the initial cut. The Fed is projected to cut by a quarter-of-a-percent in November, but don’t expect much of a change in mortgage rates that day.
As the Federal Reserve has indicated, it is essential to watch all economic releases for signs of slowing. These releases can potentially move mortgage rates higher or lower, depending on how they compare to market expectations. Retail sales will be released on Thursday this week.
Last year, demand was 1,335, down 263 pending sales or 16%. The 3-year average before COVID (2017 to 2019) was 2,206 pending sales, 38% more than today, or an additional 608.
With demand rising faster than supply, the Expected Market Time (the number of days it takes to sell all Orange County listings at the current buying pace) decreased from 71 to 69 days in the past couple of weeks. Last year, it was 54 days, faster than today. The 3-year average before COVID was 87 days, slower than today.
Luxury End
The luxury market improved slightly in the past couple of weeks.
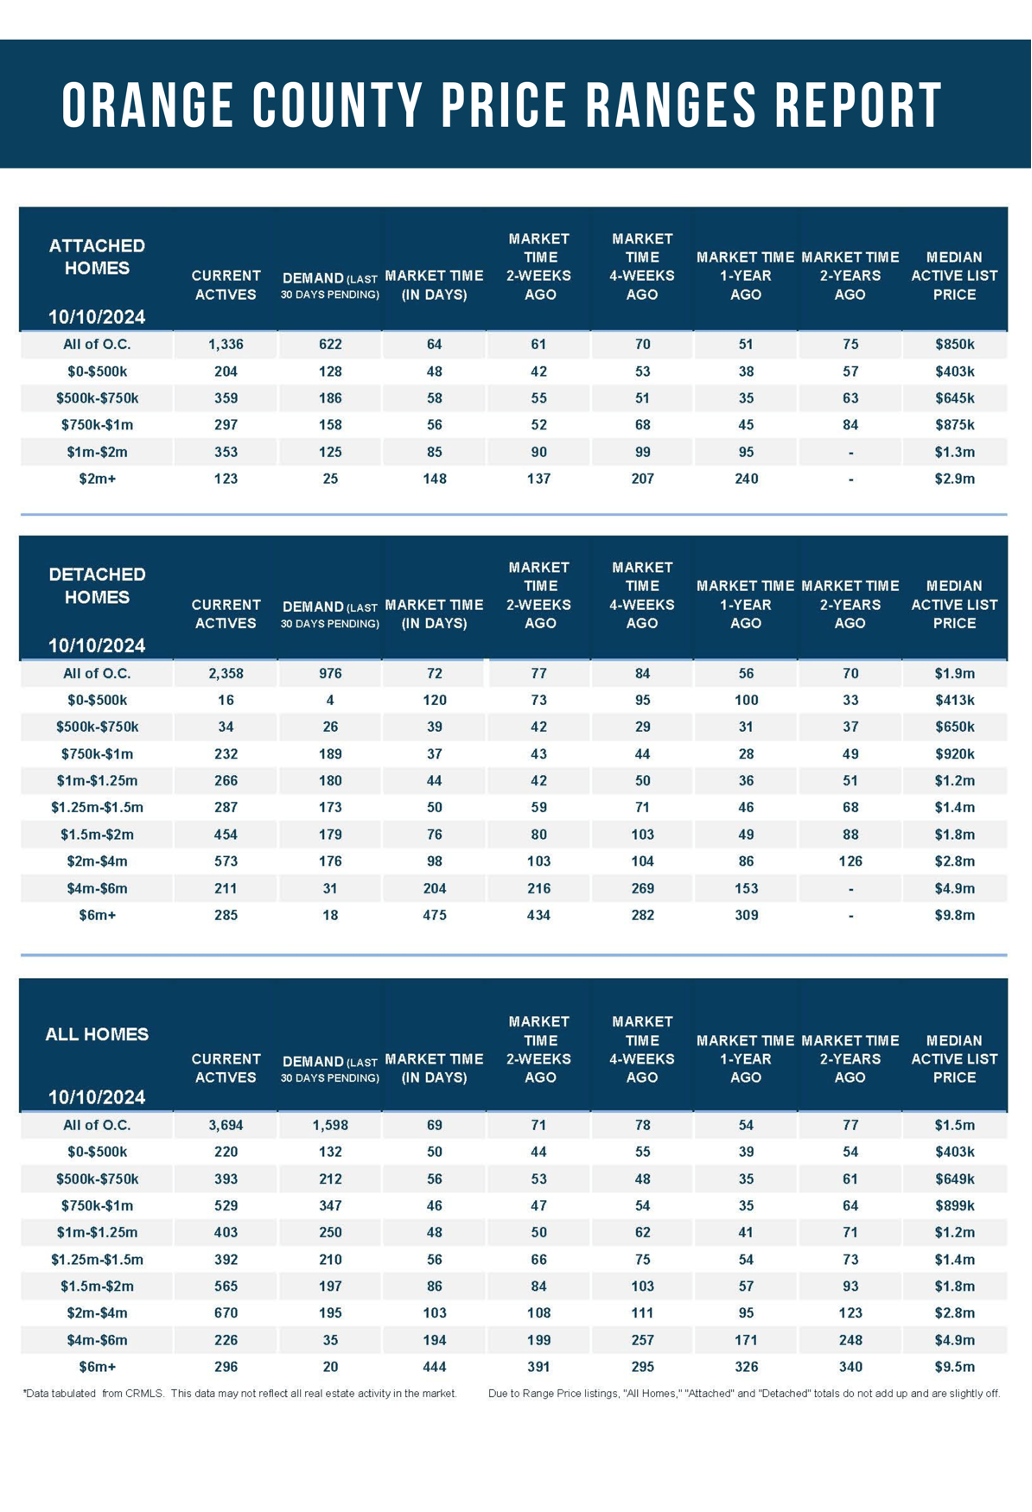
In the past couple of weeks, the luxury inventory of homes priced above $2 million (the top 10% of the Orange County housing market) decreased from 1,207 to 1,192 homes, down 15 or 1%. Luxury demand increased by three pending sales, up 1%, and now sits at 250. With supply falling and demand rising, the Expected Market Time for luxury homes priced above $2 million decreased from 147 to 143 days, its strongest reading since the start of June. Nonetheless, at 143 days, the luxury market is not instantaneous. It is not instantaneous in the lower ranges, either. For perspective, for homes priced below $2 million, the Expected Market Time is 56 days, much faster than luxury.
Year over year, the active luxury inventory is up by 382 homes or 47%, and luxury demand is up by 65 pending sales or 35%. Last year’s Expected Market Time was 131 days, a bit faster than today.
In the past two weeks, the expected market time for homes priced between $2 million and $4 million decreased from 108 to 103 days. For homes priced between $4 million and $6 million, the Expected Market Time decreased from 199 to 194 days. For homes priced above $6 million, the Expected Market Time increased from 391 to 444 days. At 444 days, a seller would be looking at placing their home into escrow around January 2026.
Orange County Housing Summary
- The active listing inventory in the past couple of weeks increased by 28 homes, up 1%, and now sits at 3,694. In September, 25% fewer homes came on the market compared to the 3-year average before COVID (2017 to 2019), 743 less. Yet, 323 more sellers came on the market this September compared to September 2023. Last year, there were 2,408 homes on the market, 1,286 fewer homes, or 35% less. The 3-year average before COVID (2017 to 2019) was 6,306, or 71% extra.
- Demand, the number of pending sales over the prior month, increased by 44 pending sales in the past two weeks, up 3%, and now totals 1,598, its highest level since the beginning of July. Last year, there were 1,335 pending sales, 16% fewer. The 3-year average before COVID (2017 to 2019) was 2,206, or 38% more.
- With demand rising faster than supply, the Expected Market Time, the number of days to sell all Orange County listings at the current buying pace, decreased from 71 to 69 days in the past couple of weeks. The 3-year average before COVID (2017 to 2019) was 87 days, slower than today.
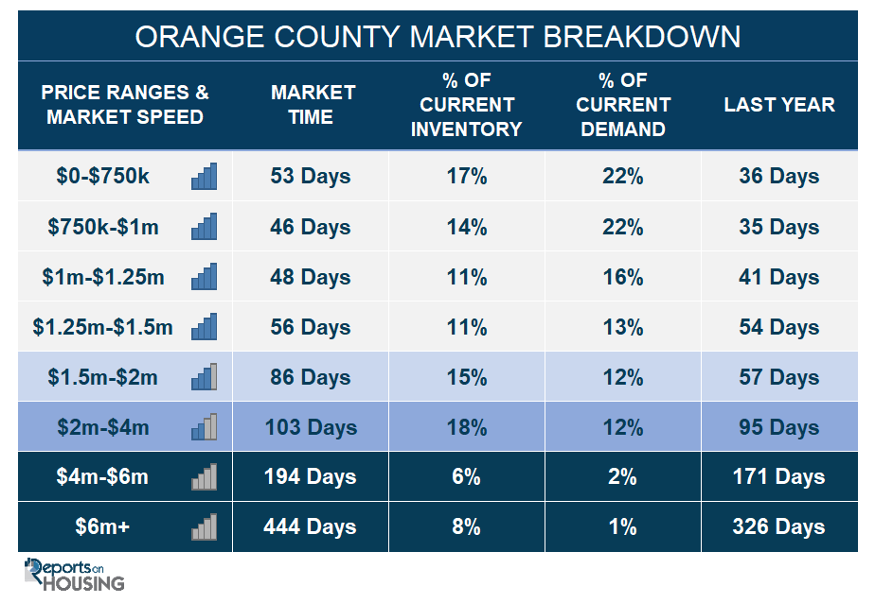
- In the past two weeks, the Expected Market Time for homes priced below $750,000 increased from 49 to 53 days. This range represents 17% of the active inventory and 22% of demand.
- The Expected Market Time for homes priced between $750,000 and $1 million decreased from 47 to 46 days. This range represents 14% of the active inventory and 22% of demand.
- The Expected Market Time for homes priced between $1 million and $1.25 million decreased from 50 to 48 days. This range represents 11% of the active inventory and 16% of demand.
- The Expected Market Time for homes priced between $1.25 million and $1.5 million decreased from 66 to 56 days. This range represents 11% of the active inventory and 13% of demand.
- The Expected Market Time for homes priced between $1.5 million and $2 million increased from 84 to 86 days. This range represents 15% of the active inventory and 12% of demand.
- In the past two weeks, the expected market time for homes priced between $2 million and $4 million decreased from 108 to 103 days. For homes priced between $4 million and $6 million, the Expected Market Time decreased from 199 to 194 days. For homes priced above $6 million, the Expected Market Time increased from 391 to 444 days.
- The luxury end, all homes above $2 million, account for 32% of the inventory and 15% of demand.
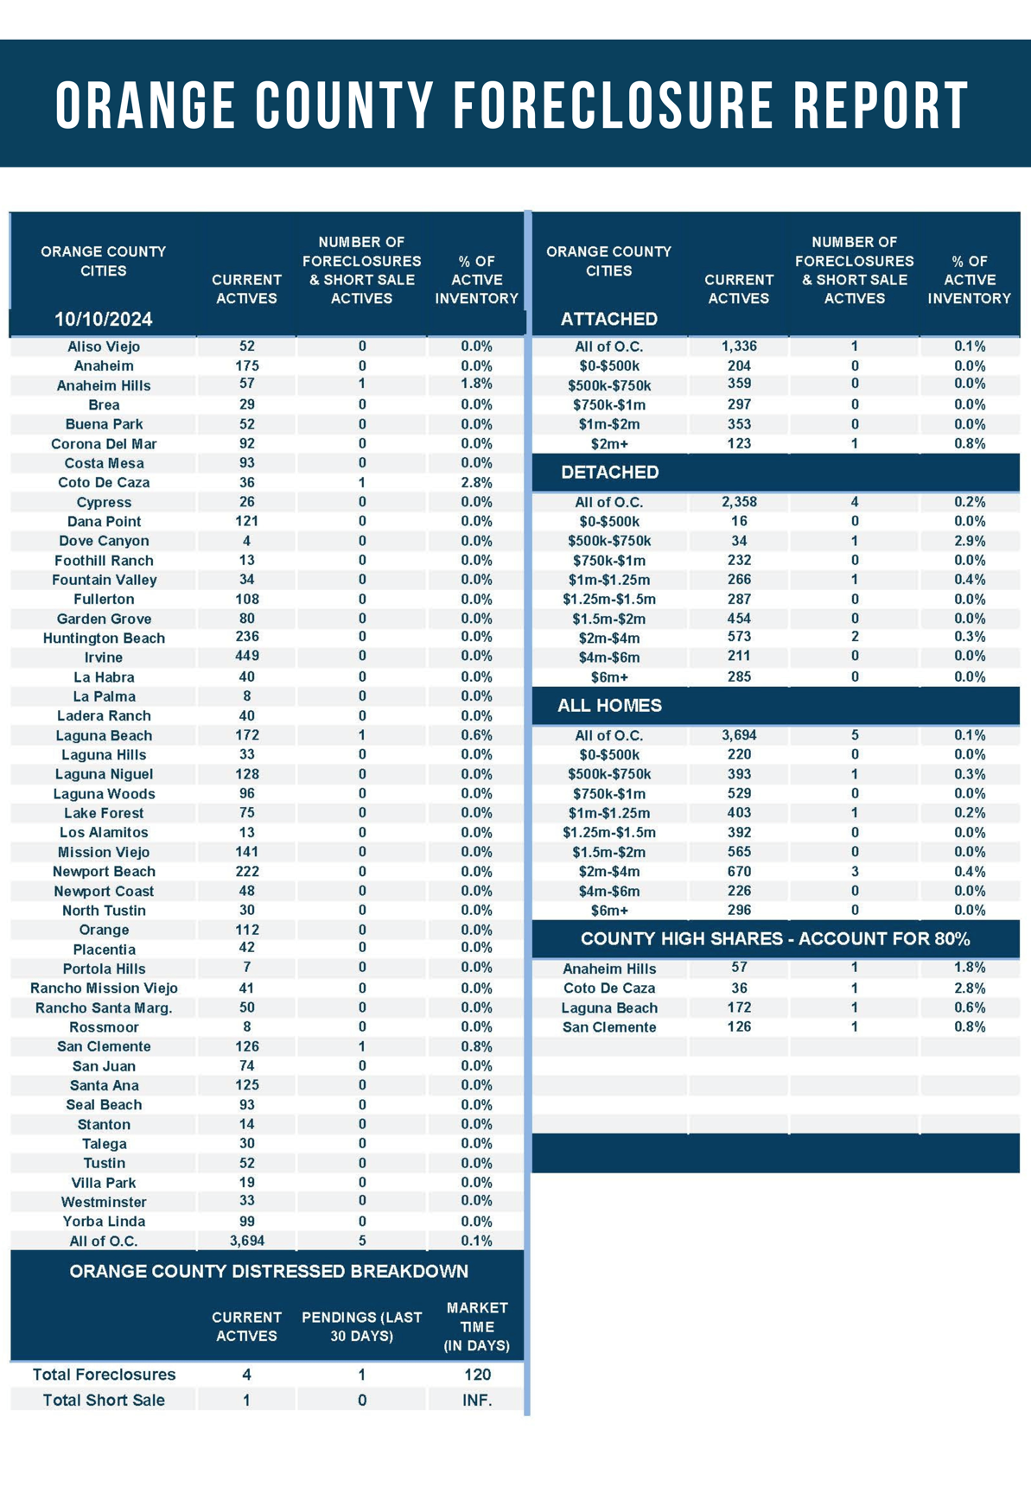
- Distressed homes, both short sales and foreclosures combined, comprised only 0.1% of all listings and 0.1% of demand. Only four foreclosures and one short sale are available today in Orange County, with five total distressed homes on the active market, unchanged from two weeks ago. Last year, five distressed homes were on the market, identical to today.
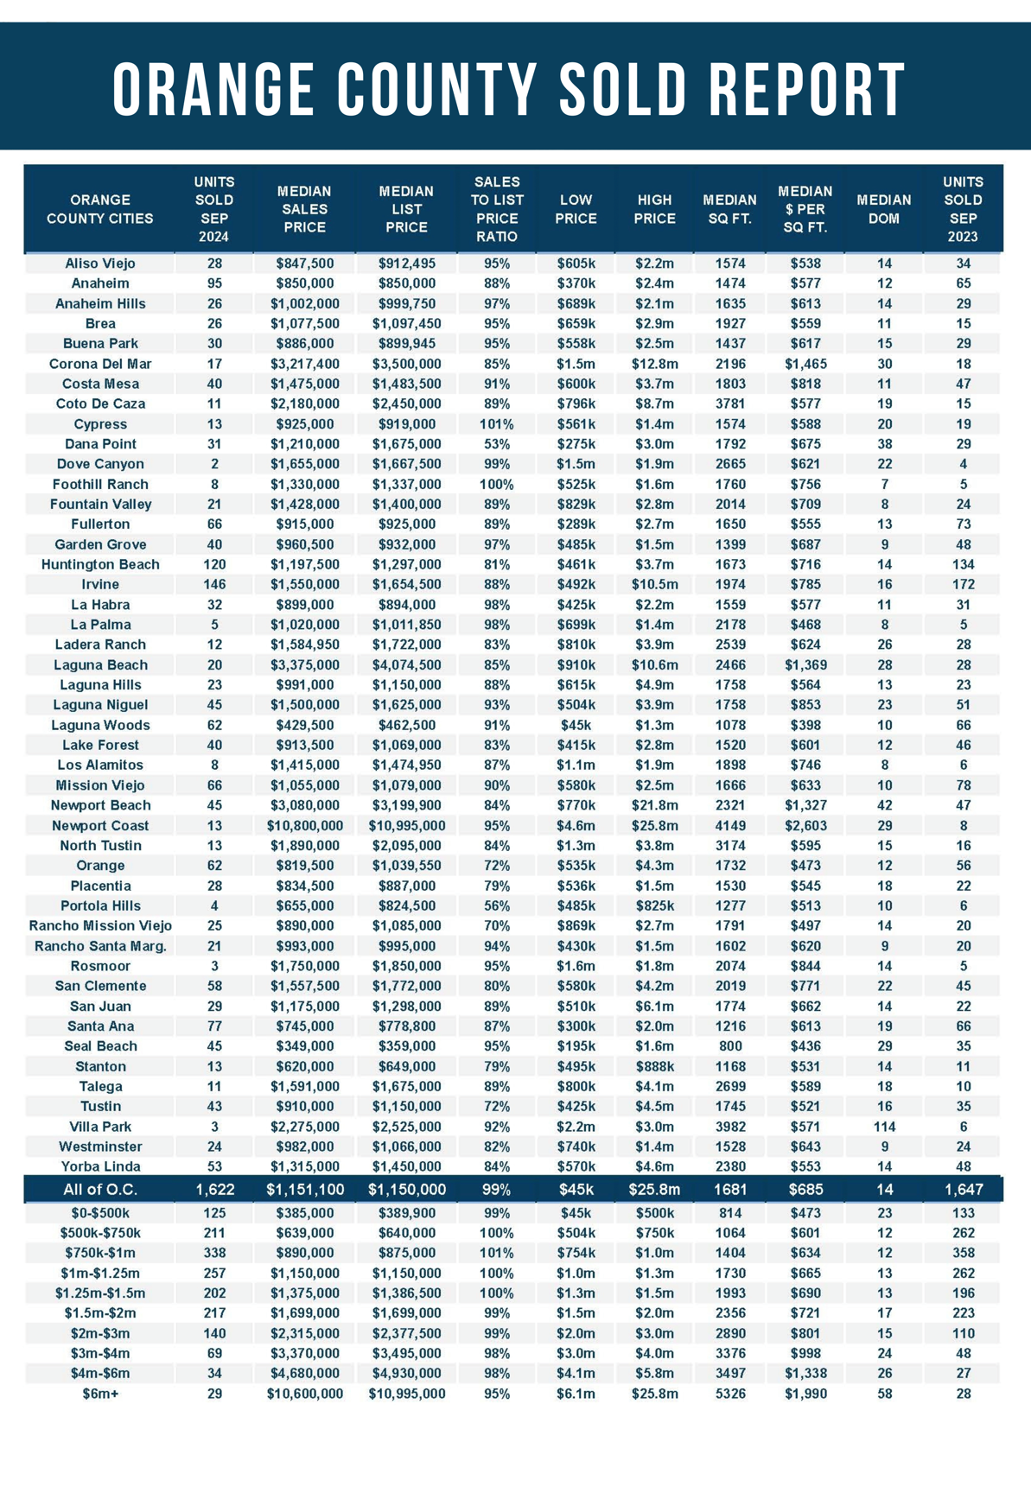
- There were 1,622 closed residential resales in September, down 2% compared to September 2023’s 1,647 and down 14% from August 2024. The sales-to-list price ratio was 98.9% for Orange County. Foreclosures accounted for 0.1% of all closed sales, and there were no short sales. That means that 99.9% of all sales were good ol’ fashioned sellers with equity.
Have a great week.
Sincerely,
Steven Thomas
Quantitative Economics and Decision Sciences
Copyright 2024—Steven Thomas, Reports On Housing—All Rights Reserved. This report may not be reproduced in whole or in part without express written permission from the author.