July 12, 2021
Potential buyers are being fooled into thinking it is not a good
time to purchase and are delaying their plans,
ignoring economic facts.
Housing’s Strength
The housing boom has everything to do with supply and demand, and those fundamental features are not going to change anytime soon.
Doctors, dentists, lawyers, investors, neighbors, family, friends, it seems everybody has an opinion on the direction of housing. Unbelievably, only 19% of consumers believe that now is a good time to buy a home. That means that 81% think it is not a good time to buy. There are TikTok videos proclaiming the inevitable crash in housing. No longer than 3-minutes in length, the clips offer Chicken Little titles with no economic backing whatsoever. From YouTube to Facebook, social media has a big opinion when it comes to real estate. All of the noise, the “Gossip Factory,” feeds on everybody’s collective fears and prevents far too many consumers from making the sound decision to participate in this crazy housing market.
When housing is surging with seemingly no end in sight, society cannot help but flashback to 2001 through 2006. In 2004 and 2005, the Case-Shiller U.S. Home Price Index showed red-hot home price appreciation between 10% and 14.5%. Everybody knows what happened next, the housing bubble eventually popped and led to double digit home price depreciation in 2008 and 2009. In May of this year, U.S. home price appreciation reached 14.6%, its highest level since tracking began in 1988. Yet, today’s housing market is glaringly different than the runup to the Great Recession. That housing stock was built on the backs of easy credit, pick-a-payment plan, subprime lending, zero-down loans, easy qualifying, and fraudulent lending. Prior to the bubble deflating, there were obvious signs of a pending housing collapse: way too much supply of available homes to purchase and diminished year over year demand. The simple Econ 101 principle of supply and demand painted the inevitable housing plunge.
Today, it is completely different. There is no credit bubble like before. It is not easy credit that is the catalyst to the highest appreciation on record. Buyers cannot merely fog a mirror to obtain financing. Instead, they must qualify for loans, prove that they can afford the monthly payment. The process is intentionally cumbersome to prevent a repeat of 2007 to 2011. The current housing boom is quite simply due to supply and demand. Everyone is acutely aware of the current plight of
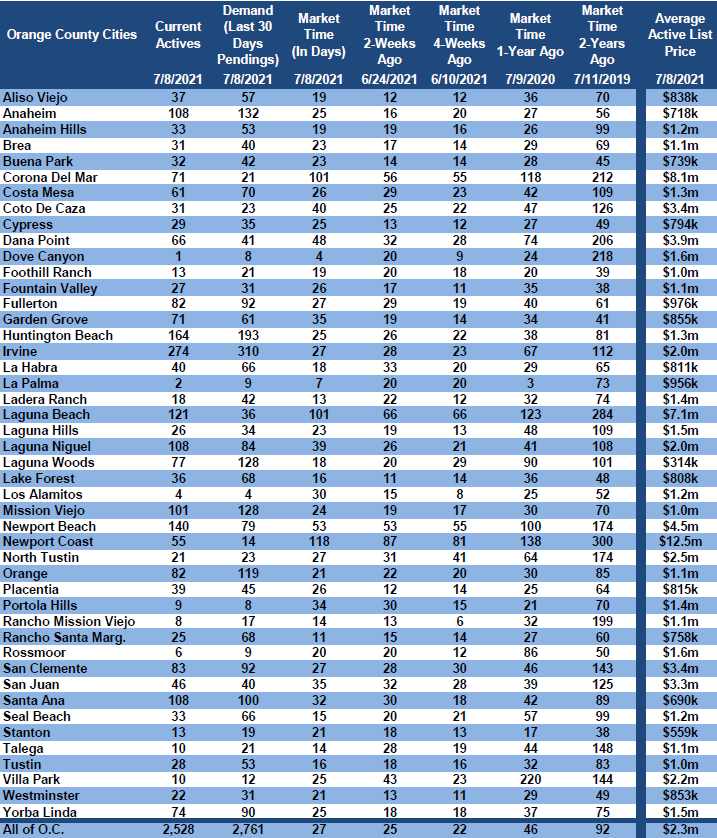
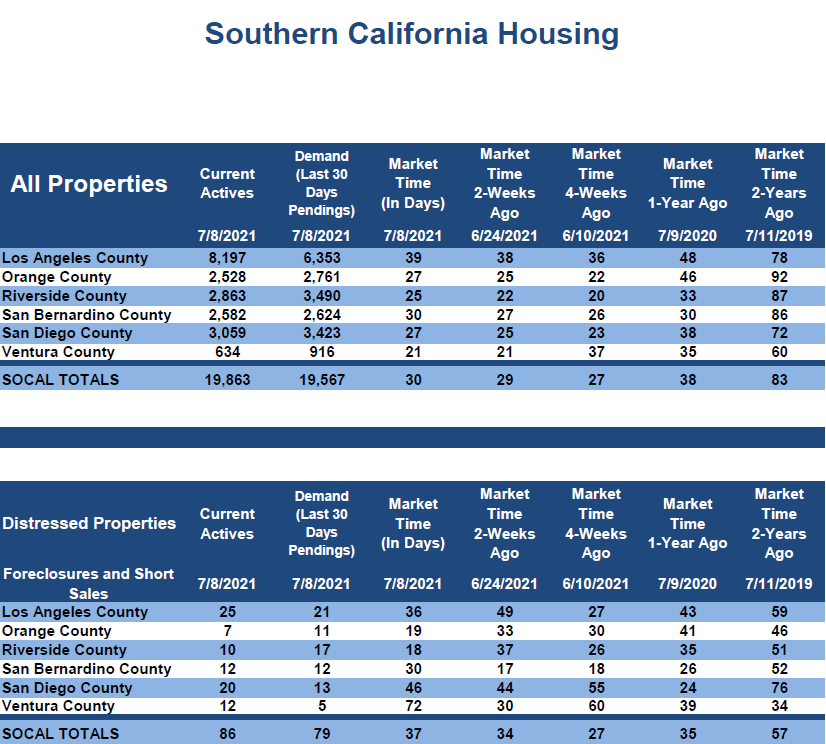
the housing market: there just are not enough available homes to purchase. Supply is low. Recently the supply has been rising, up 14% in the past 4 weeks, but still at historical lows. At 2,528 homes, it is 46% less than last year’s level of 4,645, which was muted due to COVID-19. In comparing it to the 5-year average from 2015 to 2019 of 6,820 homes, it is 63% less. There are just not enough homes to satisfy the immense buying demand. That is the real issue, the supply side of the equation. For comparison purposes, in 2008 there were 18,000 available homes in Orange County. In 2006, a year before the start of the Great Recession, there were 16,000.
How about the demand side of the equation? It is elevated due to the historically low mortgage rate environment. After COVID-19 hit, mortgage rates achieved 17 record lows, starting with 3.29% in March 2020. It dropped to 2.65% during the first week of January this year. The record prior to last year was achieved in November 2012 at 3.31%. Last Thursday, July 8th, according to Freddie Mac’s Primary Mortgage Market Survey®, rates dropped to 2.9%. Prior to COVID, rates were hovering around 3.75%. Combine today’s low rates with a strongest demographic patch of First-Time home buyers in decades, and it is easy to see where all the demand is coming from. Even as values rise, homes are still affordable when factoring in rates and incomes.
Recently, demand has been dropping, shedding 10% in the past 4-weeks, but it remains elevated compared to prior years. Demand, the last 30-days of new pending sale activity, is at 2,761. It is 9% less than last year’s 3,050 pending sales, but last year’s numbers were skewed because of COVID. In comparing it to the 5-year average from 2015 to 2019 of 2,699 homes, it is 2% more. And, today’s level is being achieved with a muted supply and a lot fewer homeowners placing their homes on the market. There are 1,910 fewer FOR-SALE signs this year compared to the 5-year average between 2015 to 2019, 8% less. More homes would have translated to higher demand readings.
It is important to also mention that there is not going to be a wave of foreclosures that will hit the market as soon as Forbearance comes to an end for a variety of sound economic reasons. Many doomsayers point to Forbearance and simply state that there will be a flood of foreclosures, and values will plunge like the Great Recession. The facts do not support this claim. There have been 7.2 million homeowners who have taken advantage of Forbearance. Of the 5.2 million homeowners who have exited Forbearance, 90% either are currently paying on time or paid off their loan. Of the 2 million homeowners with an active Forbearance, 90% have at least 10% equity, enough to sell their homes if they remain in a financial pickle.
ATTENTION BUYERS: now is a great time to buy due to historically low mortgage rates. Housing is going to remain strong due to low inventory levels and strong demand fueled by low rates. It is simple Econ 101. This is not going to change anytime soon with no anticipated flood of homeowners coming to market to change the supply side of the equation. It will be more of the same. Follow an economic model and stop watching TikTok, YouTube, and Facebook videos that are not rooted in a laundry list of economic principles, charts, and irrefutable data.
Active Listings
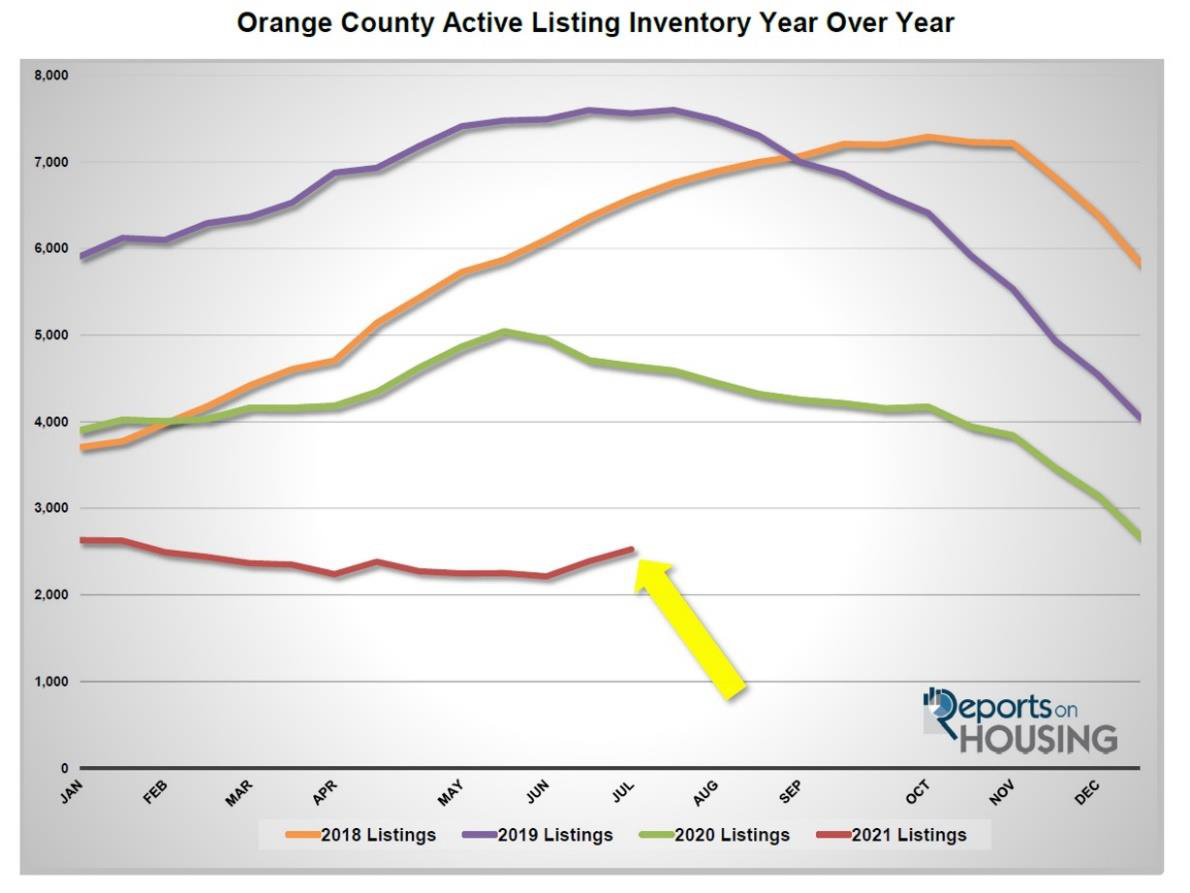
The current active inventory grew by 6% in the past couple of weeks.
The active listing inventory added 140 homes in the past couple of weeks, up 6%, and now sits at 2,528 homes, its highest level since January. In the past four weeks, it has grown by 14%, a very healthy trend and a welcome relief to the countless buyers waiting for more homes to hit the market. This is par for the course, a rising inventory during the summer months. As demand diminishes due to summer distractions, the inventory is finally able to grow, which is still occurring despite fewer homeowners opting to sell. Normally, housing peaks between July and August, but this year may peak a bit later if mortgage rates rise a bit by summer’s end.
Last year at the beginning of July, there were 4,645 homes on the market, 2,117 additional homes, or 84% more. The 5-year average from 2015 to 2019 (intentionally omitting 2020 due to COVID skewing the data) is 6,820, an extra 4,292 homes, or 170% more. There were a lot more choices for buyers compared to today.
Demand
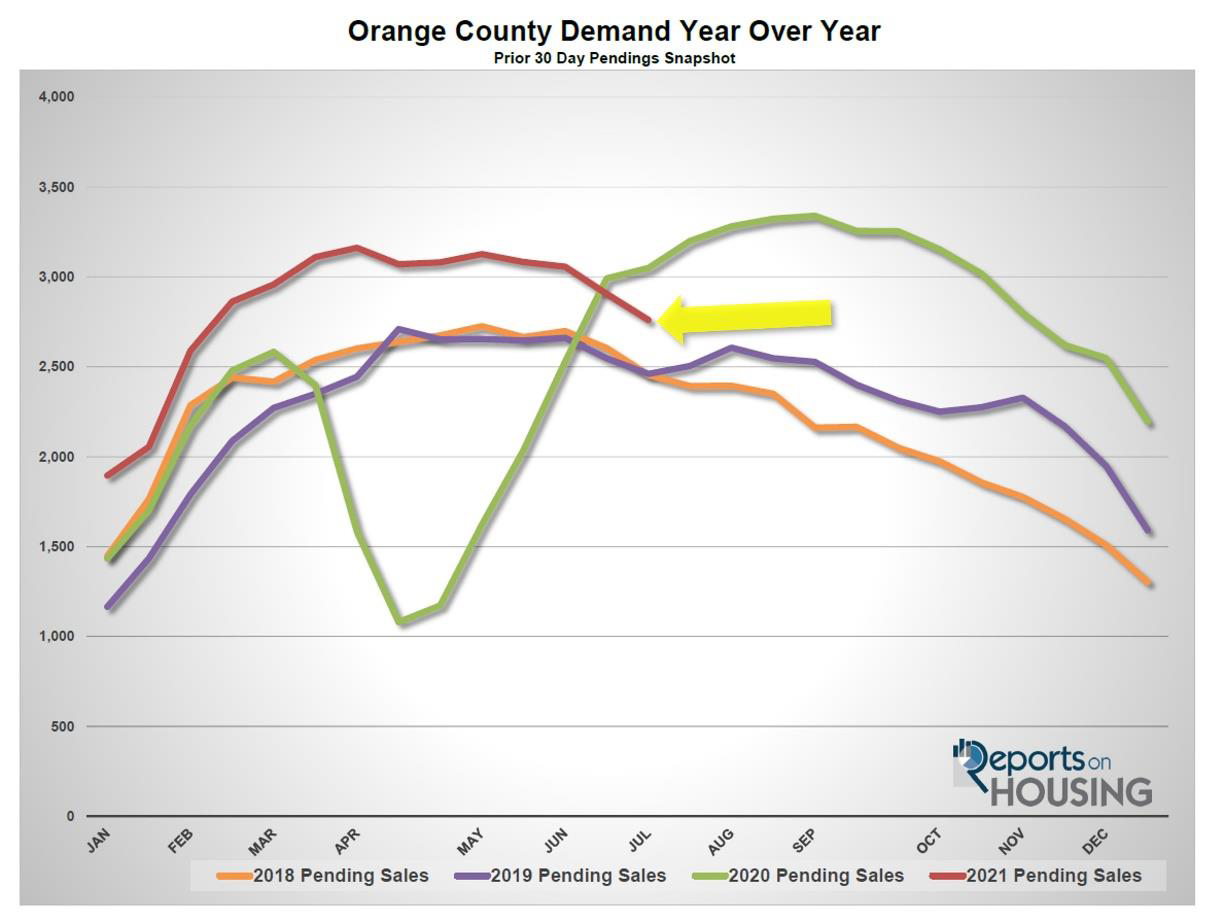
Demand decreased by 5% in the past couple of weeks.
Demand, a snapshot of the number of new pending sales over the prior month, decreased from 2,906 to 2,761 in the past couple of weeks, shedding 145 pending sales, down 5%. In the past four weeks, demand has dropped by 10%, or 296 pending sales. Demand is at its lowest level since February. Many buyers are placing their home search on hold and enjoying a bit of summer. It has been very challenging to be a buyer in today’s market with way too much competition. Multiple offer situations mean that buyers must go back to the drawing board over and over. Couple the frustrations of buying with missing out on summer activities last year due to COVID and enough buyers are taking a break which is impacting demand. Expect demand to further downshift at the end of August when the kids go back to school, schooling that will no longer be virtual.
Last year, demand was at 3,050, 10% more than today, with the arrival of a very late Spring Market due to COVID. It is better to compare today’s market to the 5-year average for demand from 2015 through 2019, which was at 2,699 pending sales, 62 fewer pending sales, or 2% less than today.
With both the inventory rising and demand falling, in the past two-weeks the Expected Market Time (the number of days to sell all Orange County listings at the current buying pace) increased from 25 days to 27 days, its highest level since the start of February. At 27 days, it is still an extremely insane, Hot Seller’s Market (less than 60 days) where there are a ton of showings, sellers get to call the shots during the negotiating process, multiple offers are the norm, and home values are rising rapidly. Last year the Expected Market Time was at 46 days and falling. The 5-year average from 2015 through 2019 was at 76 days, much slower than today, but still a Slight Seller’s Market.
Luxury End
The luxury market slowed a bit with bit of a rise in the supply.
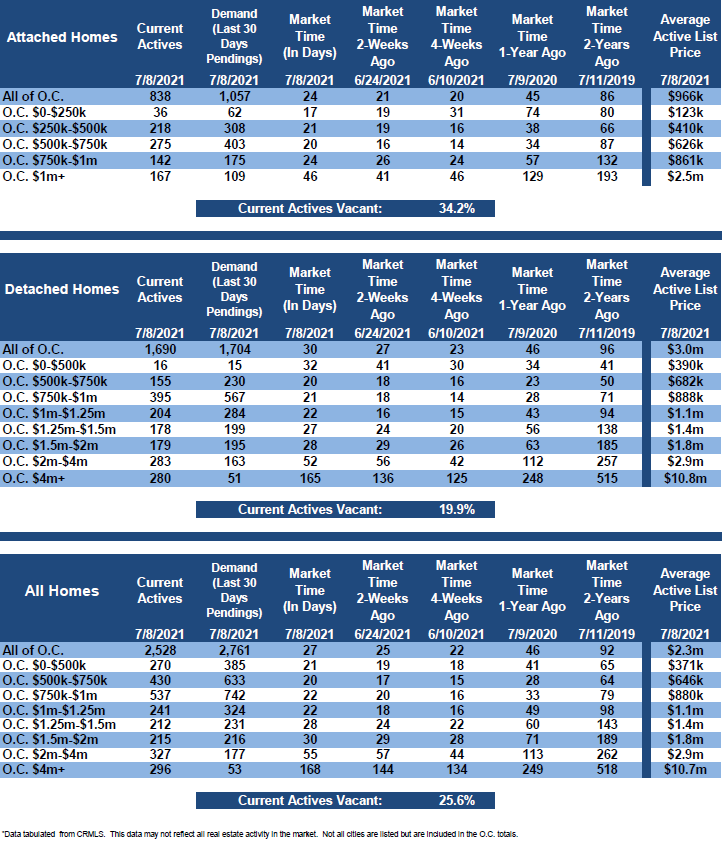
In the past two weeks the luxury inventory of homes priced above $1.5 million increased by 22 homes, up 3%, and now sits at 838, its highest level since April. At the same time, luxury demand increased by 4 pending sales, up 1%, and now sits at 446. With a larger increase in the supply of luxury homes compared to the small rise in demand, the overall Expected Market Time for luxury homes priced above $1.5 million increased from 55 to 56 days. At 56 days, it remains a very Hot Seller’s Market for luxury.
Expect the luxury market to continue to slightly cool with all the distractions of summer.
Year over year, luxury demand is up by 73 pending sales, or 20%, and the active luxury listing inventory is down by 556 homes, or 40%. The Expected Market Time last year was at 112 days and plunging fast due to the delay in the Spring Market due to COVID. Year over year statistics for luxury are a lot more comparable today than they have been for a while.
For homes priced between $1.5 million and $2 million, the Expected Market Time increased from 29 to 30 days. For homes priced between $2 million and $4 million, the Expected Market Time decreased from 57 to 55 days. For homes priced above $4 million, the Expected Market Time increased from 144 to 168 days. At 168 days, a seller would be looking at placing their home into escrow around December 2021.
Orange County Housing Summary
• The active listing inventory increased by 140 homes in the past two-weeks, up 6%, and now totals 2,528, its highest level since January. In June, there were 14% fewer homes that came on the market compared to 5-year average between 2015 to 2019 (2020 was skewed do to COVID-19), 557 less. Last year, there were 4,645 homes on the market, 2,117 additional homes, or 84% more.
• Demand, the number of pending sales over the prior month, decreased by 145 pending sales in the past two-weeks, down 5%, and now totals 2,761, its lowest level since February. Last year, there were 3,050 pending sales, 10% more than today, due to a delayed Spring Market.
• With an increase in the supply and a drop in demand, the Expected Market Time, the number of days to sell all Orange County listings at the current buying pace, increased from 25 to 27 days in the past couple of weeks, its highest level since February, but still an extremely Hot Seller’s Market (less than 60 days). It was at 46 days last year and getting hotter.
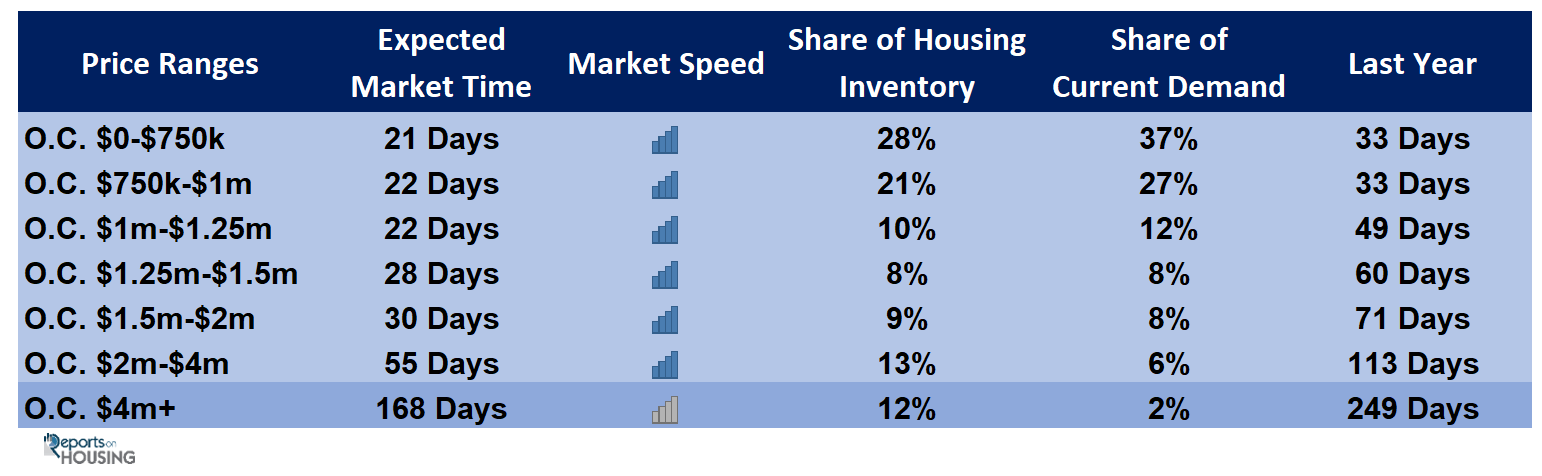
• For homes priced below $750,000, the market is a Hot Seller’s Market (less than 60 days) with an Expected Market Time of 21 days. This range represents 28% of the active inventory and 37% of demand.
• For homes priced between $750,000 and $1 million, the Expected Market Time is 22 days, a Hot Seller’s Market. This range represents 21% of the active inventory and 27% of demand.
• For homes priced between $1 million to $1.25 million, the Expected Market Time is 22 days, a Hot Seller’s Market.
• For homes priced between $1.25 million to $1.5 million, the Expected Market Time is 28 days, a Hot Seller’s Market.
• For homes priced between $1.5 million and $2 million, the Expected Market Time increased from 29 to 30 days. For homes priced between $2 million and $4 million, the Expected Market Time decreased from 57 to 55 days. For homes priced above $4 million, the Expected Market Time increased from 144 to 168 days.
• The luxury end, all homes above $1.5 million, accounts for 34% of the inventory and 16% of demand.
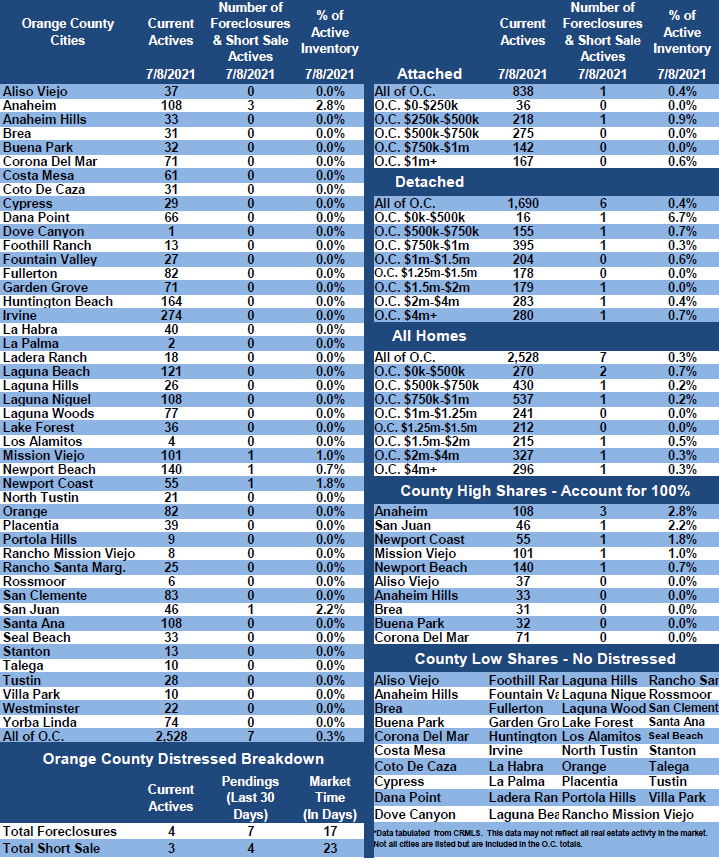
• Distressed homes, both short sales and foreclosures combined, made up only 0.3% of all listings and 0.4% of demand. There are only 4 foreclosures and 3 short sales available to purchase today in all of Orange County, 7 total distressed homes on the active market, down 3 from two-weeks ago. Last year there were 29 total distressed homes on the market, slightly more than today.
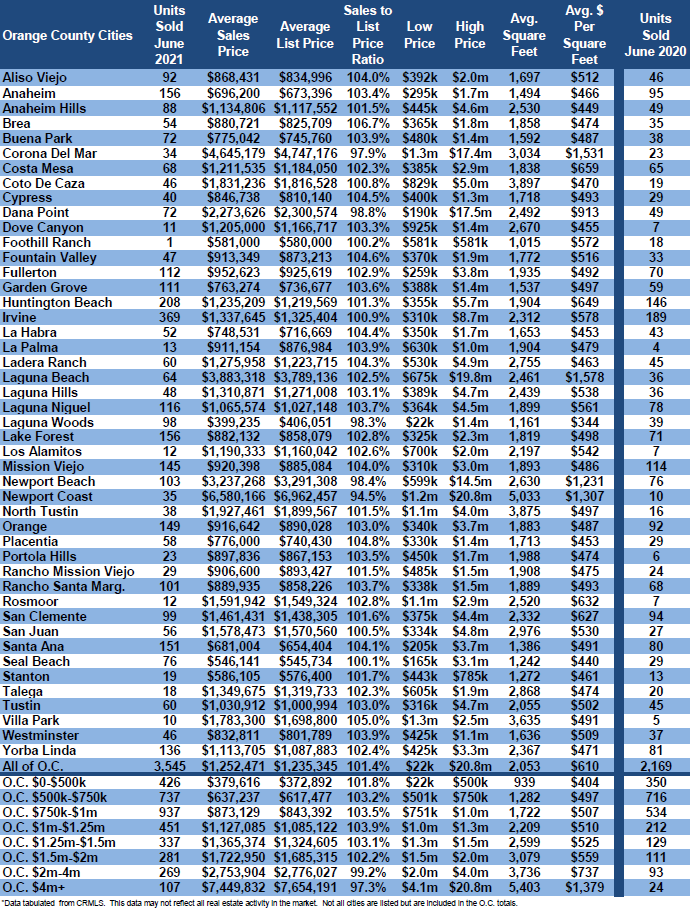
• There were 3,545 closed residential resales in June, 63% more than June 2020’s 2,169 closed sales. June marked a 10% increase compared to May 2021. The sales to list price ratio was 101.4% for all of Orange County. Foreclosures accounted for just 0.1% of all closed sales, and short sales accounted for 0.1%. That means that 99.8% of all sales were good ol’ fashioned sellers with equity.
Have a great week.
Sincerely,
Steven Thomas
Quantitative Economics and Decision Sciences
Cell 949.874.8221
Copyright 2021- Steven Thomas, Reports On Housing – All Rights Reserved. This report may not be reproduced in whole or part without express written permission by author.