May 30, 2023
The Orange County housing market is not the same for every price range; some are hot, while others are not.
Price Range Differences
The market is extremely hot in many price ranges, but the luxury end is the biggest exception.
The FOR-SALE sign is pounded into the front yard of a detached home listed at $1 million. It is in mint condition, nicely upgraded, on a beautifully landscaped, small lot. During the initial weekend, the Saturday open house is a success, with buyer after buyer bumping into each other to see the home. By Tuesday morning, the listing agent is sorting through ten offers to purchase the home. By the week’s end, the seller comes to an agreement and accepts an offer at $1,025,000 that closes in 30 days, $25,000 above the list price.
An extensively upgraded luxury home is placed on the market with an entertainer’s yard and panoramic canyon views and is listed at $2.5 million. Seven different buyers tour the home in the initial week. Quite a few people come through the weekend open house. The first week’s activity is solid, yet no offers are generated. It is not until after surpassing the two-month mark that the sellers entertain their first offer. There had been some interest prior, but nobody was ready to step up and write an offer to purchase. A few days later, after back-and-forth negotiations, the seller comes to an agreement and accepts an offer at $2,325,000 that closed in 60 days, $175,000 less than the list price.
These two scenarios are both taking place right here in Orange County and are typical for their specific price ranges. Yes, the market is HOT, but the higher the range, the longer it takes to sell a home. The “FLAVOR” of the market depends upon a home’s price point.
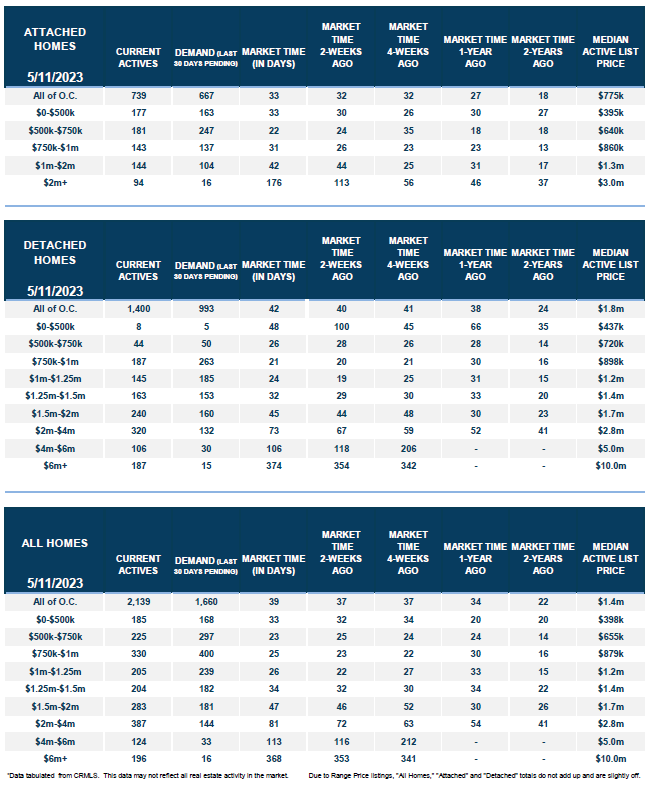
The market is scorching hot for detached homes priced below $1.5 million, with Expected Market Times below 40 days. The hottest price range is homes priced between $750,000 to $1 million with an Expected Market Time of only 20 days. It is still extremely hot, between $1.5 million to $2 million, just not as instant. It is insanely hot for everything below $1 million for condominiums and townhomes. It is very hot, just not instant, from $1 million to $2 million. For Orange County, everything below $2 million is considered the bread-and-butter of the market, the vast majority of buyer activity and home sales. When you hear about multiple offers within days and lines of people touring open houses, chances are it is a home within this range. The lion’s share of all closed sales in 2023, 89%, occurred below $2 million. It is an overwhelming majority of today’s market, yet there are not enough on the market today. It currently accounts for only 56% of the active listing inventory.
Above $2 million, the market decelerates quite a bit. The Expected Market Time is still less than 90 days for detached homes priced between $2 million to $4 million, but they are not flying off the market with buyers tripping over themselves to purchase. Above $4 million, it’s a totally different ballgame, ranging from an expected market time of 4 months to nearly a year. There simply are not enough luxury buyers but plenty of competing sellers. Similarly, it takes more than six months to sell condominiums or townhomes priced above $2 million.
Overall, the Orange County housing market is incredibly hot in all price ranges compared to pre-pandemic years. It is not that there is insatiable demand, with a record number of buyers looking to purchase. That is hardly the case in the current high mortgage rate environment, with rates surpassing 7% for the first time since the start of March. Housing is hot due to a lack of homeowners selling their homes. Through April, there have been 45% fewer sellers or 6,551 missing FOR-SALE signs. Yet, regardless of the price range, from now through August, there still will be more homes coming on the market, but at a similar muted pace. The inventory will slowly grow until it peaks sometime this summer. As the supply of homes grows and demand stays relatively the same or even drops slightly, the Expected Market Time will grow as well. More homes coming on the market means more competition. To find success at ALL price points, it is imperative that sellers carefully price their homes according to their Fair Market Values. Stretching the asking price results in wasted market time and sitting on the market with no success, even in the hottest price ranges. Many sellers will fall victim to overpricing and will not achieve their objective until they correct their asking price with a reduction more aligned with their true Fair Market Value.
The Bottom Line: The Orange County housing market varies by price point, especially for luxury. Regardless of the range, meticulously approaching the asking price is fundamental to successfully selling.
Active Listings
The active inventory increased by 2% in the past couple of weeks.
The active listing inventory increased by 51 homes in the past two weeks, up 2%, and now sits at 2,190 homes, its lowest level for the end of May since tracking began in 2004. Since bottoming out in mid-April, the inventory has added 137 homes, up 7%. The 3-year average rise before COVID (2017 to 2019) for the same six-week period was 590 homes. Last year, it surged higher by 56%, adding 965. The inventory is growing exceptionally slowly and will most likely peak in about eight weeks, the end of July. It will likely peak at just under 2,500 homes, a bit less than 2021, the lowest peak since tracking began in 2004 by a landslide. The 3-year average peak before COVID was 6,958. That is a jaw-dropping 4,458 more than this year’s projected height. The lack of available homes to purchase is a sticky trend that will not change this year or in 2024.
Last year, the inventory was 2,697, 23% higher, or 507 more. The 3-year average before COVID (2017 through 2019) is 6,370, an additional 4,180 homes, or 191% extra, nearly triple where it stands today.
Homeowners continue to “hunker down” in their homes, unwilling to move due to their current underlying, locked-in, low fixed-rate mortgage. The difference between their underlying rate and today’s prevailing rate is significant and precludes many homeowners from listing their homes for sale and moving to another house. This will continue until mortgage rates drop. For April, 2,037 new sellers entered the market in Orange County, 1,983 fewer than the 3-year average before COVID (2017 to 2019), 49% less. These missing signs counter any potential rise in the inventory.
Demand
Demand did not change much in the past couple of weeks.
Demand, a snapshot of the number of new escrows over the prior month, increased from 1,660 to 1,665 in the past couple of weeks, up five pending sales, nearly unchanged. Today’s level is the lowest end-of-May reading since tracking began in 2004. Demand did not change much recently despite rates reaching their highest level this year on May 26th at 7.14%, according to Mortgage News Daily. The recent run-up in rates is due to the dispute over the debt ceiling extension, along with recent economic releases that illustrate the stickiness of higher inflation. Rates will ease once Washington, DC, comes to an agreement. They will fall further as the U.S. economy cools. When that occurs, expect demand to pick up slightly. Since demand is based on pending sales, it will remain muted as long as substantially fewer homeowners are willing to sell.
Last year, demand was at 2,113, 27% more than today, or an extra 448. The 3-year average before COVID (2017 to 2019) was 2,738 pending sales, 64% more than today, or an additional 1,073.
With little change in supply and demand, the Expected Market Time (the number of days to sell all Orange County listings at the current buying pace) remained unchanged at 39 days in the past couple of weeks. Last year the Expected Market Time was 38 days, very similar to today, yet it was cooling rapidly along with soaring rates. The 3-year average before COVID was 70 days, slower than today.
Luxury End
The luxury market did not change much in the past couple of weeks.
In the past couple of weeks, the luxury inventory of homes priced above $2 million increased from 707 to 725 homes, up 18 homes, or 3%, its highest level since November 2022. Luxury demand increased by seven pending sales, up 4%, and now sits at 200. With demand rising faster than supply, the Expected Market Time for luxury homes priced above $2 million decreased from 110 to 109 days. Luxury is not selling as quickly as the lower ranges, and sellers should approach pricing carefully to find success. The higher the luxury price, the more intentional sellers need to be.
Year over year, luxury demand is down by 33 pending sales or 14%, and the active luxury listing inventory is up by 64 homes or 10%. Last year’s Expected Market Time was 85 days, slightly better than today. The year-over-year difference is diminishing rapidly and will soon reflect a better market than in 2022.
For homes priced between $2 million and $4 million, the Expected Market Time in the past two weeks decreased from 81 to 79 days. For homes priced between $4 million and $6 million, the Expected Market Time increased from 113 to 149 days. For homes priced above $6 million, the Expected Market Time decreased from 368 to 267 days. At 368 days, a seller would be looking at placing their home into escrow around February 2024.
Orange County Housing Summary
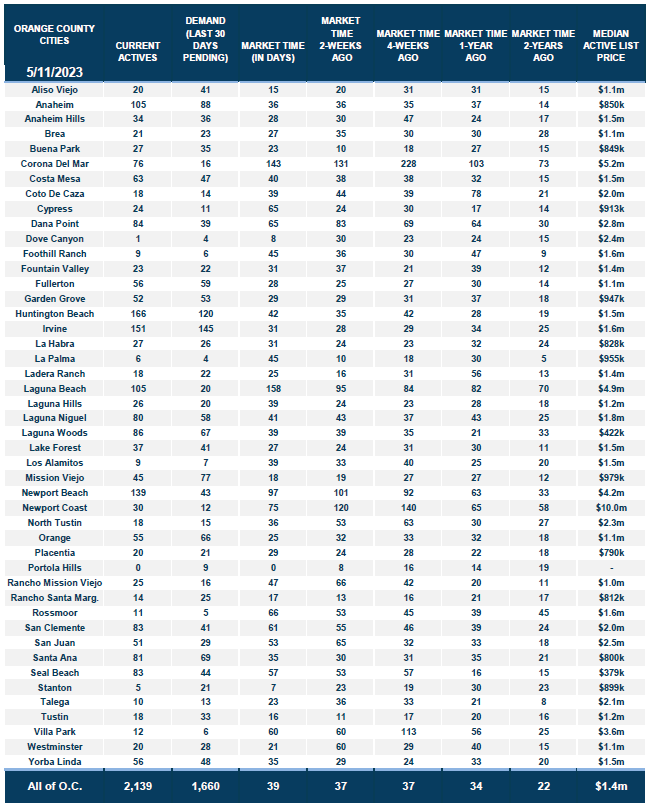
- The active listing inventory in the past couple of weeks increased by 51 homes, up 2%, and now sits at 2,190. It is the lowest level for the end of May since tracking began in 2004. In April, 49% fewer homes came on the market compared to the 3-year average before COVID (2017 to 2019), 1,983 less. Last year, there were 2,697 homes on the market, 507 more homes, or 23% higher. The 3-year average before COVID (2017 to 2019) was 6,370, or 191% more, nearly triple.
- Demand, the number of pending sales over the prior month, increased by five pending sales in the past two weeks, nearly unchanged, and now totals 1,665, the lowest level for the end of May since tracking began in 2004. Last year, there were 2,113 pending sales, 27% more than today. The 3-year average before COVID (2017 to 2019) was 2,738, or 64% more.
- With supply and demand not changing much, the Expected Market Time, the number of days to sell all Orange County listings at the current buying pace, remained unchanged at 39 days in the past couple of weeks. It was 38 days last year, similar to today, but was rapidly cooling with skyrocketing rates.
- For homes priced below $750,000, the Expected Market Time increased from 26 to 27 days. This range represents 19% of the active inventory and 28% of demand.
- For homes priced between $750,000 and $1 million, the Expected Market Time remained unchanged at 25 days. This range represents 15% of the active inventory and 24% of demand.
- For homes priced between $1 million to $1.25 million, the Expected Market Time increased from 26 to 28 days. This range represents 10% of the active inventory and 13% of demand.
- For homes priced between $1.25 million to $1.5 million, the Expected Market Time decreased from 34 to 33 days. This range represents 10% of the active inventory and 12% of demand.
- For homes priced between $1.5 million to $2 million, the Expected Market Time decreased from 47 to 46 days. This range represents 13% of the active inventory and 11% of demand.
- For homes priced between $2 million and $4 million, the Expected Market Time in the past two weeks decreased from 81 to 79 days. For homes priced between $4 million and $6 million, the Expected Market Time increased from 113 to 149 days. For homes priced above $6 million, the Expected Market Time decreased from 368 to 267 days.
- The luxury end, all homes above $2 million, account for 33% of the inventory and 12% of demand.
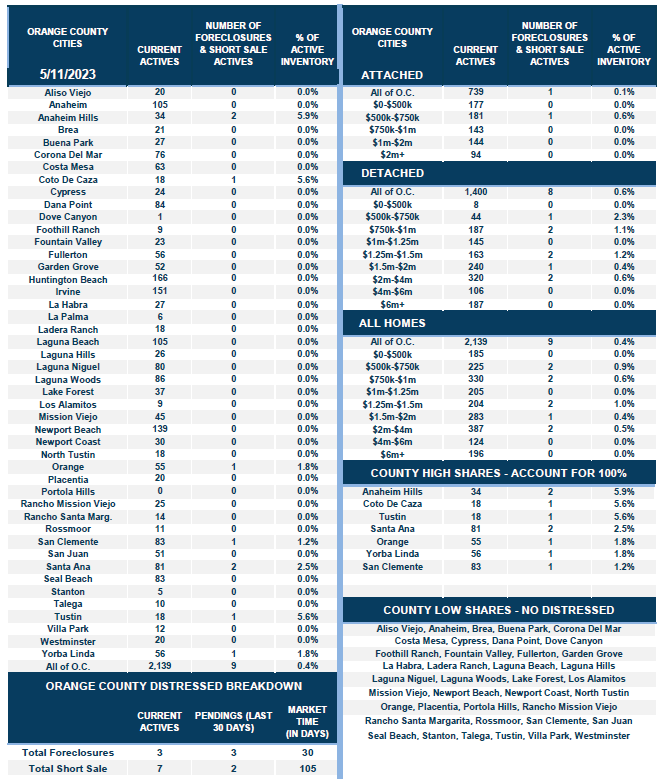
- Distressed homes, both short sales and foreclosures combined, comprised only 0.6% of all listings and 0.1% of demand. Only five foreclosures and nine short sales are available today in Orange County, with 14 total distressed homes on the active market, up four from two weeks ago. Last year there were four distressed homes on the market, similar to today.
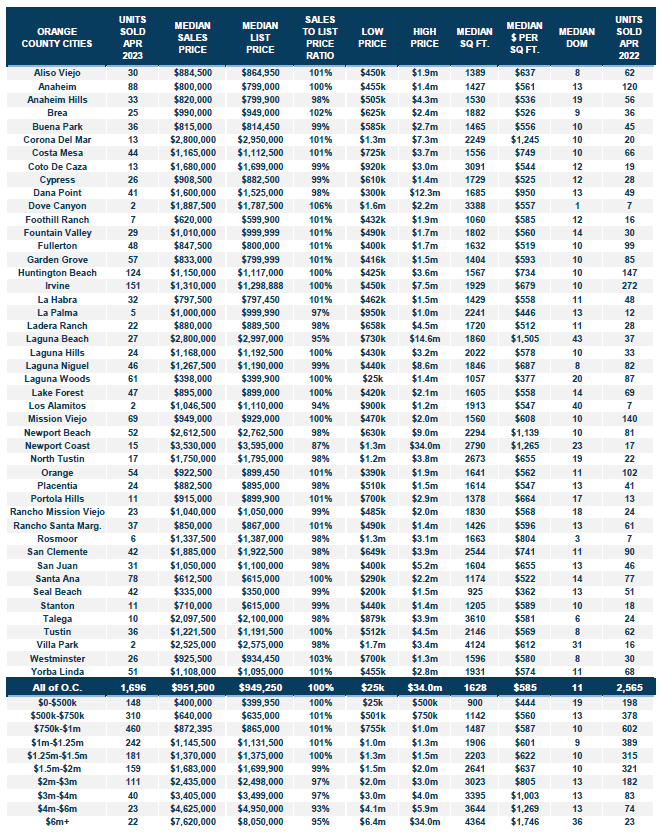
- There were 1,696 closed residential resales in April, 34% less than April 2022’s 2,565 closed sales. April marked a 5% drop compared to March 2023. The sales-to-list price ratio was 100.2% for all of Orange County. Foreclosures accounted for 0.1% of all closed sales, and there were no closed short sales. That means that 99.9% of all sales were good ol’ fashioned sellers with equity.
Have a great week.
Sincerely,
Steven Thomas
Quantitative Economics and Decision Sciences
Copyright 2023- Steven Thomas, Reports On Housing – All Rights Reserved. This report may not be reproduced in whole or part without express written permission from the author.