May 31, 2022
When escalating home prices are matched with much higher
mortgage rates, home affordability dramatically weakens
and results in fewer buyers able to make a purchase.
Demand is Dropping Due to Affordability
Lower rates had propped up affordability, yet today’s higher interest rate environment is impacting demand as many home buyers struggle to afford the monthly payment.
In May of 2021, a gallon of gas cost $4.07. In January of this year, it had increased to $4.59, a rise of 52 cents in 8 months. It climbed to $5.66 a gallon in April, and then to $6.17 in May. That is a $1.58 jump in 4 months. Everyone is acutely aware of soaring prices at the pump. As consumers feel the strain in their monthly budgets, the rising fuel cost will begin to impact discretionary spending.
Mortgage rates have experienced a similar fate, climbing from 2.78% last August to 3.25% by the start of this year. They then jumped to 4.95% in April and sit at 5.25% today. This two-point rise since ringing in the New Year sidelined many potential buyers as home affordability has impacted the ability for many to qualify and purchase a home.
In looking at home affordability it is critical to look at home prices, household incomes, and the prevailing mortgage rate. Home values have risen sharply since the start of the pandemic. In fact, the national Case-Shiller Home Price Index increased by 20.6% year-over-year in March, a record rise. Higher prices were not a problem when rates were in the two’s and three’s and buyer demand was through the roof; however, today’s 5.25% mortgage rate, according to Mortgage News Daily, is a significant jump that has squeezed buyers swiftly. As a result, the demand for Orange County Housing has weakened.
To understand where this weaker demand is coming from it is necessary to consider where interest rates and incomes have been historically and their impact on affordability. The chart below highlights how interest rates have been a lot higher and limit the price of a home that a buyer can afford. In 1980, the average mortgage rate was 13.75%, the median income was $22,000, and the median detached sales price was $108,000. That meant that the monthly housing payment was 55% of a homeowner’s income. Rates continued to drop, and incomes climbed decade after decade. In 2000,
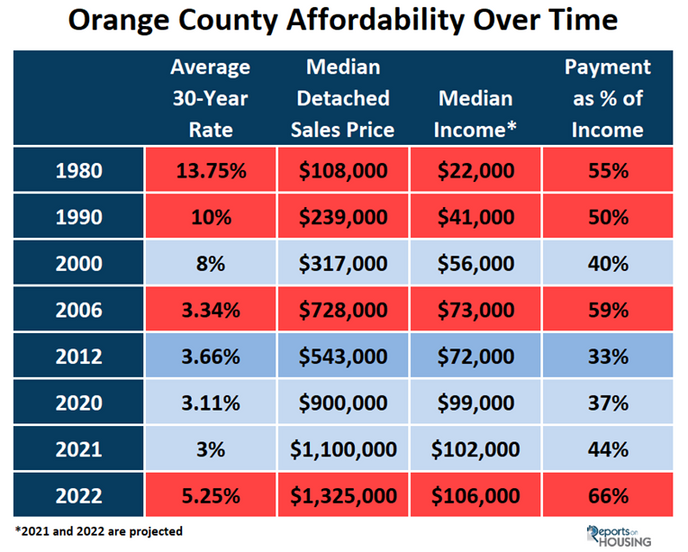
mortgage rates were at 8%, the median income grew to $56,000, and the median detached sales price had blossomed to $317,000. Yet, the monthly payment was only 40% of a homeowner’s income. It swelled to 59% in 2007, just prior to the start of the Great Recession, and dropped to 33% in 2012 as housing began to climb once again. In 2020 and 2021, even as the median price of a home had rocketed to record levels, the monthly payment was at 37% and 44% due to historically low mortgage rates. Affordability was not an issue as mortgage rates had dropped to record lows. Flash forward to today’s 5.25% mortgage rate, $106,000 median household income, and a record setting April median detached sales price of $1,325,000, the monthly housing payment is 66% of a homeowner’s monthly paycheck. That is way too high for the average home buyer.
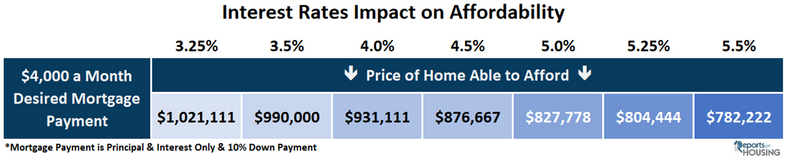
Skyrocketing home values were not a problem in 2020 and 2021 when rates reached 17-record lows. But, as rates have climbed from 3.25% to 5.25% in just a few months, home affordability has rapidly eroded like a sandcastle at high tide. Many potential home buyers no longer qualify to purchase a home, or their purchasing power has greatly diminished. A payment on a $1 million home with 10% down at the start of the year was $3,917 at 3.25%. Today, it is $4,970 at 5.25%, a $1,053 per month rise in the first five months of the year. Additionally, a buyer looking to spend $4,000 per month was touring homes at a $1,021,111 at the start of January. Today, that same buyer is now considering homes at $782,222. Their purchasing power plunged by nearly $240,000.
Even with home values reaching record highs, the housing market is rapidly cooling. There are fewer showings, fewer multiple offers, and homes are taking longer to sell. Overpriced homes are sitting, the inventory is rapidly growing, and price reductions are on the rise. In Orange County 22% of all available homes to purchase have reduced their asking price at least once. Demand, the number of pending sales over the prior month, is down by 31% compared to one year ago. It is down 22% compared to the 3-year average prior to COVID (2017 to 2019). In fact, demand is at its lowest point for this time of year since 2007, intentionally omitting the pandemic lockdowns of 2020.
The Bottom Line: The quick rise in mortgage rates has substantially eroded home affordability and the Orange County housing market is rapidly cooling. It all boils down to the monthly payment. When the monthly payment climbs out of reach for many home buyers, demand cools. The housing frenzy is quickly coming to an end. Sellers need to be careful in navigating the new housing landscape. Carefully pricing is fundamental in order to find success.
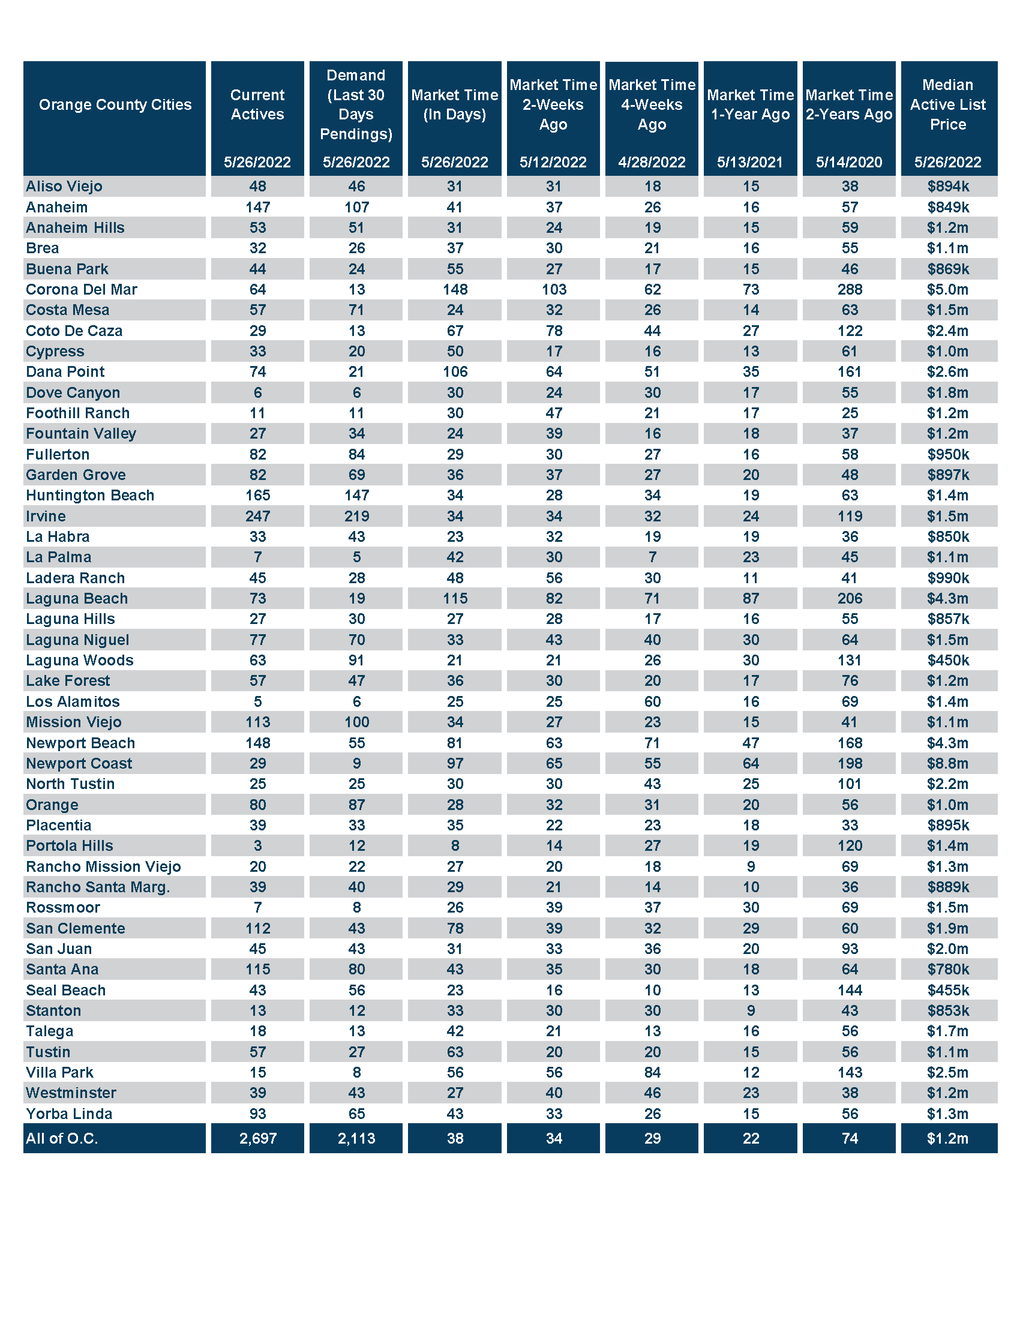
Active Listings
The current active inventory continued to surge higher.
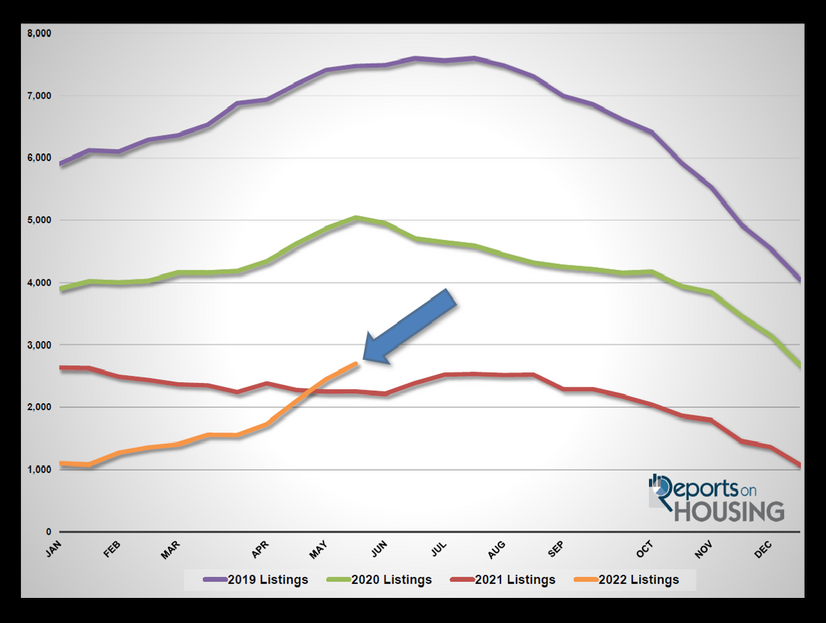
The active listing inventory surged higher, adding 245 homes in the past couple of weeks, up 10%, and now sits at 2,697, its highest level since last December 2020, 17-months ago. With diminished demand, the inventory has swelled by 179% since the start of the year, adding 1,732 homes in the first five months of the year. At this rate, the inventory will rise to nearly 4,500 when it peaks between October and Thanksgiving. Last year in October there were approximately 2,000 homes available. Normally the inventory peaks during the summer, but it will be delayed due to overpriced homes accumulating on the market without success. The 4,500 level will be the highest level since 2019, but will still be shy of the 3-year October average prior to COVID (2017 to 2019) of 6,400 homes. Nonetheless, there will be a lot more homes on the market later this year and it will be matched up against muted demand.
Last year, the inventory was at 2,251, 17% lower, or 446 fewer. The 3-year average prior to COVID (2017 through 2019) is 6,370, an extra 3,673 homes, or 136% higher, more than double today. There were a lot more choices back then, though this is slowly narrowing.
The new trend that developed this year is a sharp decrease in the number of homes coming on the market. For the month of April, there were 3,325 new FOR-SALE signs in Orange County, 695 fewer than the 3-year average prior to COVID (2017 to 2019), 17% less. Missing signs counter the potential rise in the inventory.
ORANGE COUNTY ACTIVE LISTIING INVENTORY
YEAR-OVER-YEAR (2019-2022)
Demand
Demand dropped by 3% in the past couple of weeks.
Demand, a snapshot of the number of new escrows over the prior month, decreased from 2,179 to 2,113 in the past couple of weeks, down 66 pending sales, or 3%. Typically demand reaches a peak by now, between April and May, and is on the decline. This year it peaked early on March 31st due to the higher interest rate environment and has fallen by 8% since. In June, housing transitions to the Summer Market, where demand slowly diminishes. The distractions of summer, from heading to the beach to family vacations, will slowly cool demand further from the spring heights.
ORANGE COUNTY DEMAND YEAR-OVER-YEAR (2018-2021)
PRIOR 30 DAYS PENDIINGS SNAPSHOT
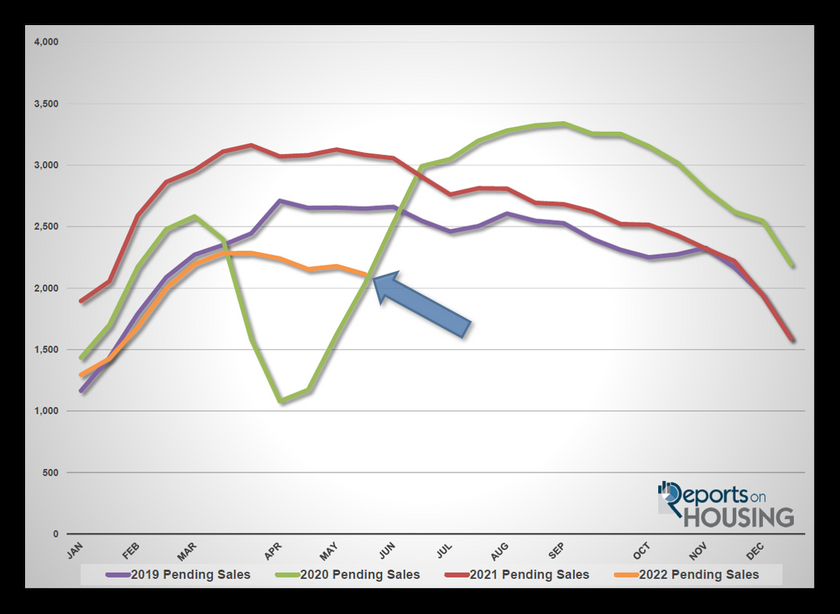
Last year, demand was at 3,083, 46% more than today, or an extra 970. The 3-year average prior to COVID (2017 to 2019) was at 2,738 pending sales, 30% more than today, or an extra 625.
With the supply surging higher and demand falling as well, the Expected Market Time (the number of days to sell all Orange County listings at the current buying pace) increased from 34 to 38 days in the past couple of weeks, its highest level since January of last year. At 38 days it remains an insane, Hot Seller’s Market (less than 60 days) where there are plenty of showings, sellers get to call the shots during the negotiating process, multiple offers are the norm, and home values are still rising rapidly; BUT, the number of multiple offers is dropping and it is taking longer to sell for many. Last year the Expected Market Time was at 22 days, faster than today. The 3-year average prior to COVID was at 70 days, substantially slower than today and a Slight Seller’s Market (between 60 and 90 days).
Luxury End
The luxury market slowed significantly in the past couple of weeks.
In the past couple of weeks, the luxury inventory of homes priced above $2 million increased from 618 to 661 homes, up 7%, or an additional 43 homes, its highest level since April of 2021. Luxury demand decreased by 11 pending sales, down 5%, and now sits at 233. With the supply rising and demand falling, the overall Expected Market Time for luxury homes priced above $2 million increased from 76 to 85 days, still an extremely hot market for luxury. The market time was at 45 days back in February, indicating that luxury is cooling just like the rest of the market. Mortgage rates do not have as much of an impact on the luxury market, but the turbulence on Wall Street definitely has had an impact.
Year over year, luxury demand is down by 59 pending sales or 20%, and the active luxury listing inventory is up by 62 homes or 10%. The Expected Market Time last year was at 62 days, considerably stronger than today.
For homes priced between $2 million and $4 million, the Expected Market Time in the past two weeks increased from 54 to 61 days. For homes priced between $4 million and $8 million, the Expected Market Time increased from 106 to 146 days. For homes priced above $8 million, the Expected Market Time decreased from 401 to 270 days. At 270 days, a seller would be looking at placing their home into escrow around February 2023.
Orange County Housing Summary
- The active listing inventory continued to surge higher by 245 homes, up 10%, and now totals 2,697 homes, its highest level since December 2020. In April, there were 17% fewer homes that came on the market compared to the 3-year average prior to COVID (2017 to 2019), 695 fewer. Last year, there were 2,251 homes on the market, 446 fewer homes, or 17% less. The 3-year average prior to COVID (2017 to 2019) was 6,370, or 136% more.
- Demand, the number of pending sales over the prior month, decreased by 66 pending sales in the past two weeks, down 3%, and now totals 2,113. Intentionally ignoring the COVID lockdowns of 2020, this is the lowest level at this time of year since 2007. Last year, there were 3,083 pending sales, 46% more than today. The 3-year average prior to COVID (2017 to 2019) was 2,738, or 30% more.
- With supply surging higher and demand falling, the Expected Market Time, the number of days to sell all Orange County listings at the current buying pace, surged higher from 34 to 38 days in the past couple of weeks, still an insanely Hot Seller’s Market (less than 60 days), but rapidly cooling and the highest since January of last year. It was at 22 days last year, much stronger than today.
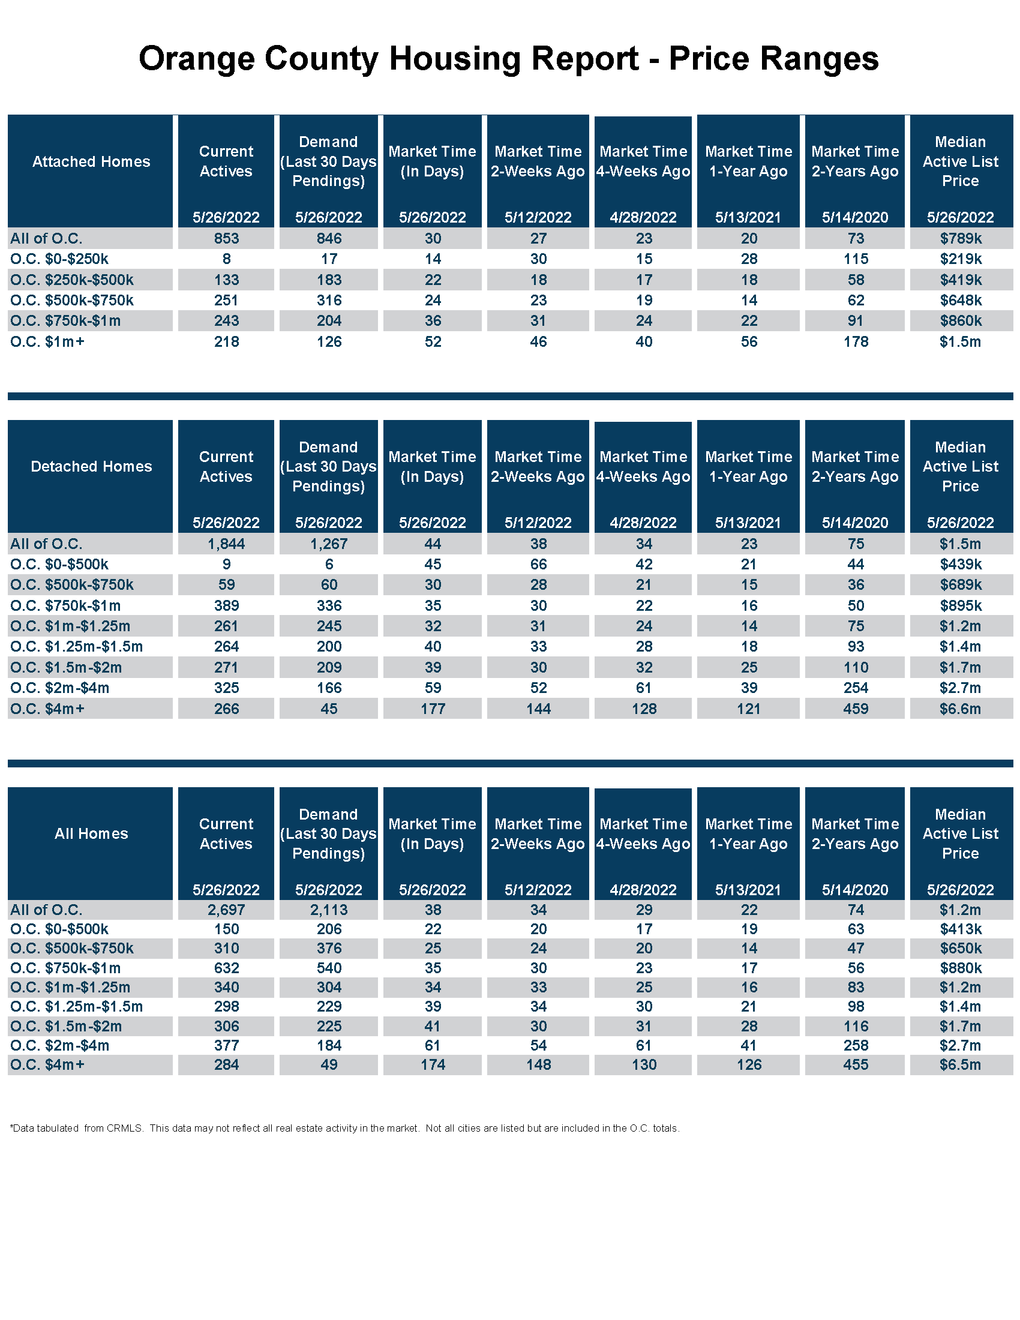
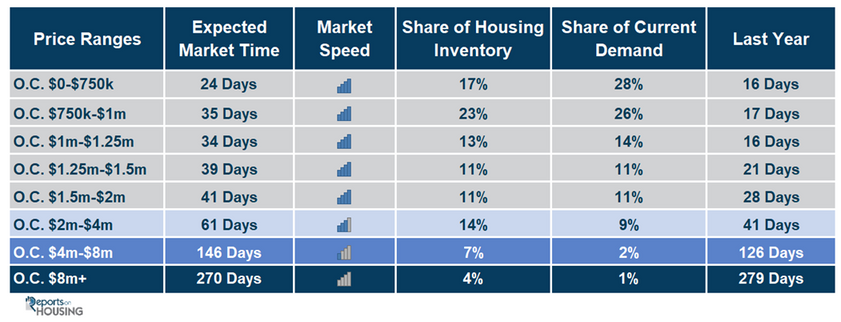
- For homes priced below $750,000, the market is a Hot Seller’s Market (less than 60 days) with an Expected Market Time of 24 days. This range represents 17% of the active inventory and 28% of demand.
- For homes priced between $750,000 and $1 million, the Expected Market Time is 35 days, a Hot Seller’s Market. This range represents 23% of the active inventory and 26% of demand.
- For homes priced between $1 million to $1.25 million, the Expected Market Time is 34 days, a Hot Seller’s Market. This range represents 13% of the active inventory and 14% of demand.
- For homes priced between $1.25 million to $1.5 million, the Expected Market Time is 39 days, a Hot Seller’s Market. This range represents 11% of the active inventory and 11% of demand.
- For homes priced between $1.5 million to $2 million, the Expected Market Time is 30 days, a Hot Seller’s Market. This range represents 10% of the active inventory and 12% of demand.
- For homes priced between $2 million and $4 million, the Expected Market Time in the past two weeks increased from 54 to 61 days. For homes priced between $4 million and $8 million, the Expected Market Time increased from 106 to 146 days. For homes priced above $8 million, the Expected Market Time decreased from 401 to 270 days.
- The luxury end, all homes above $2 million, accounts for 25% of the inventory and 12% of demand.
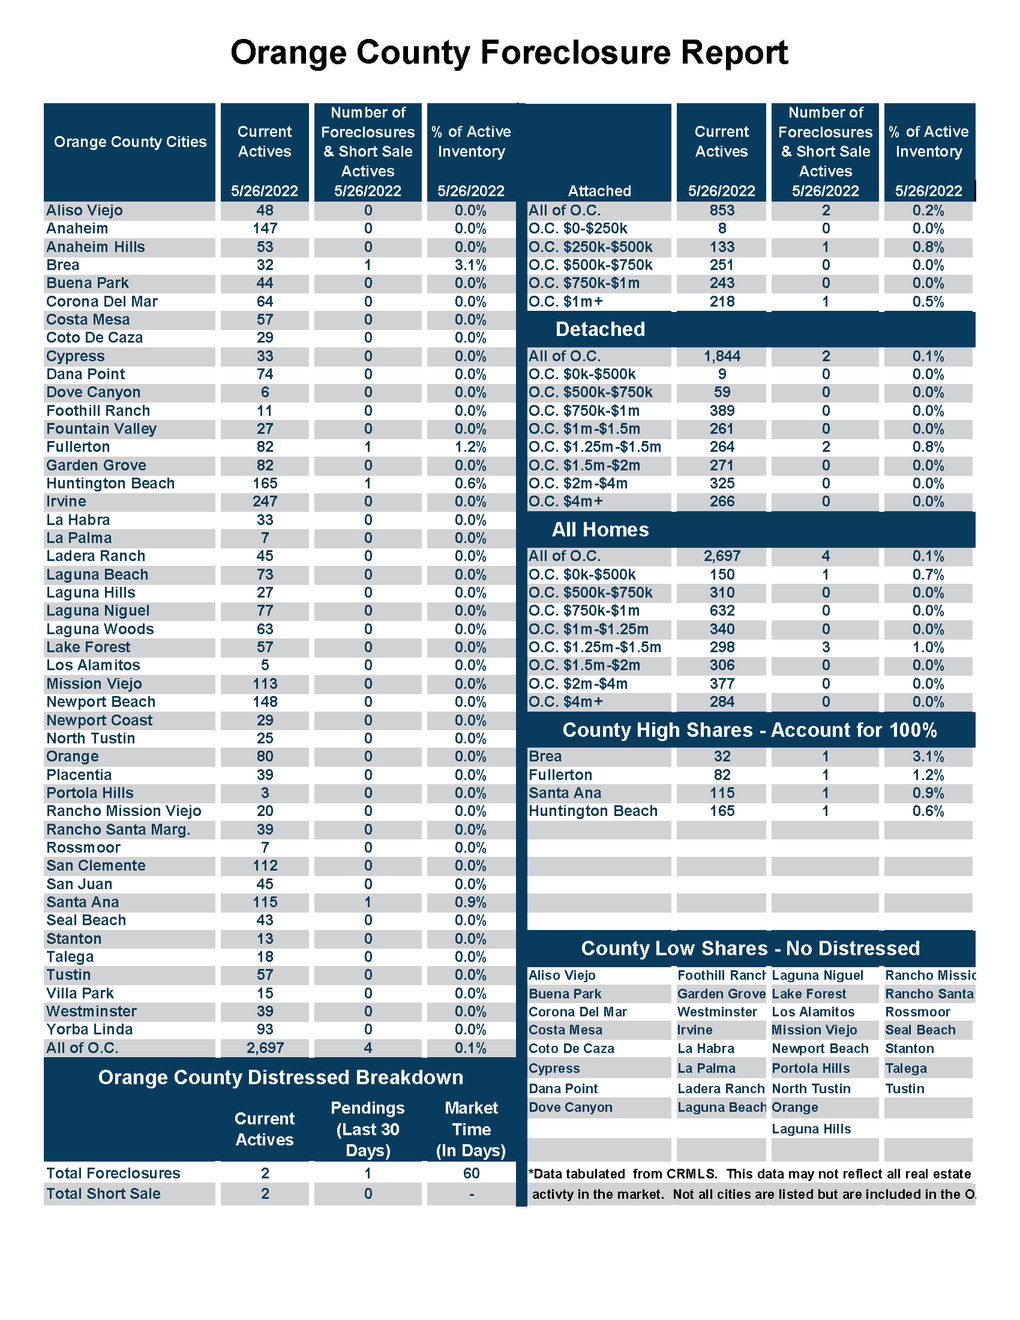
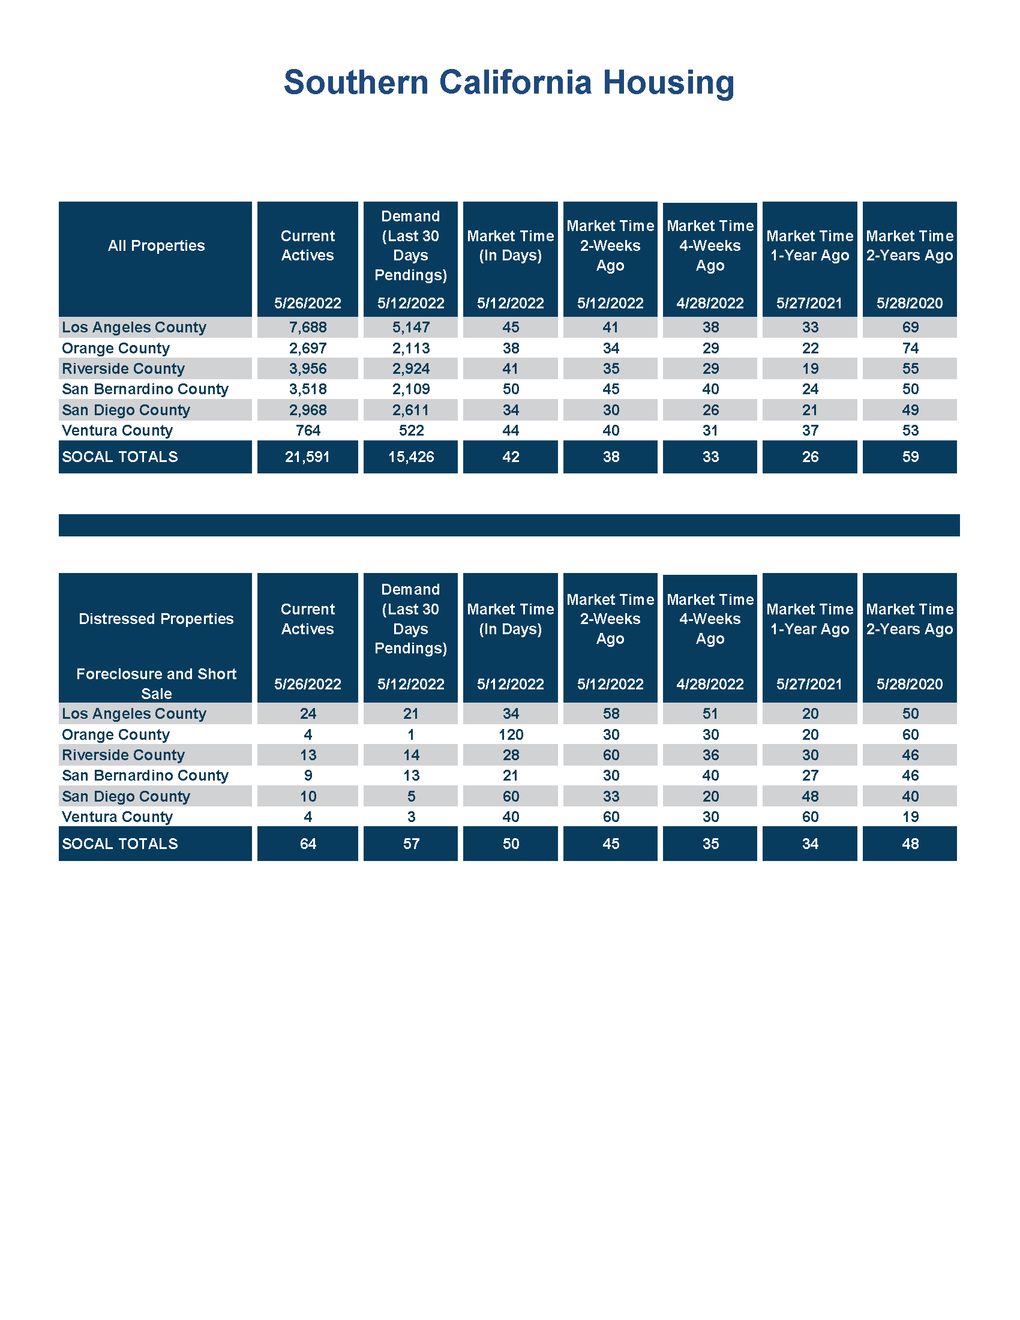
- Distressed homes, both short sales and foreclosures combined, made up only 0.1% of all listings and 0% of demand. There are only 2 foreclosures and 2 short sale available to purchase today in all of Orange County, 4 total distressed home on the active market, up 1 from two weeks ago. Last year there were 10 total distressed homes on the market, similar to today.
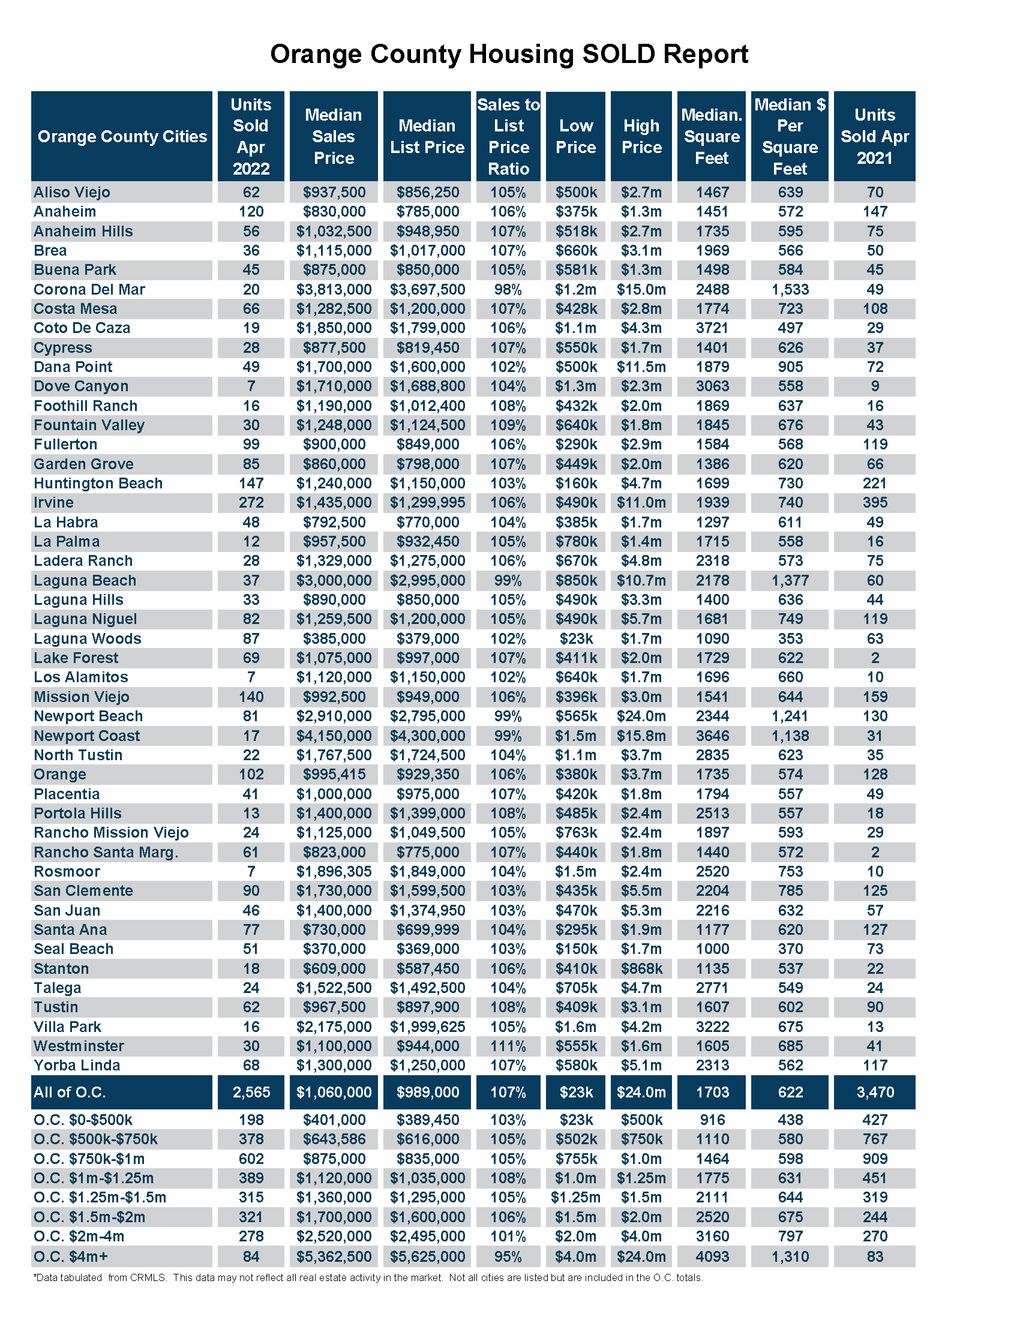
- There were 2,565 closed residential resales in April, 26% less than April 2021’s 3,470 closed sales. April marked a 3% decrease compared to March 2022. The sales to list price ratio was 107.2% for all of Orange County. There were no foreclosure sales, and short sales accounted for 0.1% of all closed sales. That means that 99.9% of all sales were good ol’ fashioned sellers with equity.
Have a great week.
Sincerely,
Steven Thomas
Quantitative Economics and Decision Sciences
Copyright 2022- Steven Thomas, Reports On Housing – All Rights Reserved. This report may not be reproduced in whole or part without express written permission by author.