January 8, 2024
Unlike the sluggish start to 2023, this year’s housing market has kicked off with a scarcity of homes available and a much faster pace.
The 2024 Start
With the second-fewest homes to start a year since tracking began in 2004, the Orange County housing market is already hotter than pre-COVID years.
Farmers markets are growing in popularity. There are plenty of booths and crowds of people eager to shop outdoors and support the community even in the middle of winter. Those who have frequented them for years know January is not a great month for fruits. The selection is limited mainly to citrus. It is not the season for peaches, plums, melons, pineapple, berries, or apples. Squeezing between the crowds reveals half-empty shelves with very few options.
That is precisely what buyers are facing at the start of 2024. The Orange County housing shelves are half empty. It is tough being a buyer looking for a home today with higher mortgage rates and very few options to purchase. Demand is muted due to affordability constraints and fewer FOR-SALE signs. Still, the inventory crisis eclipses today’s diminished demand, resulting in a market that already feels hot at the start of January.
After a late but muted inventory peak in 2023 at 2,496 homes, the lowest peak since tracking began in 2004, the inventory dropped by 28% to where it sits today at 1,785. That is the second-lowest start to a year behind 2022. There were 42% more homes available last year, with 2,530 homes available, which is still very low compared to long-term averages. The average start from 2013 through 2020 was 4,421, a staggering 147% more. That is an extra 2,636 available homes. Contributing to the supply scarcity is the fact that fewer homeowners are willing to give up their underlying, low, fixed-rate mortgages. In 2023, there were 16,151 missing FOR-SALE signs compared to the 3-year average before COVID (2017 to 2019), 41% fewer. Mortgage rates are anticipated to drop this year, and the further they fall, the more homeowners will be more inclined to sell their homes.
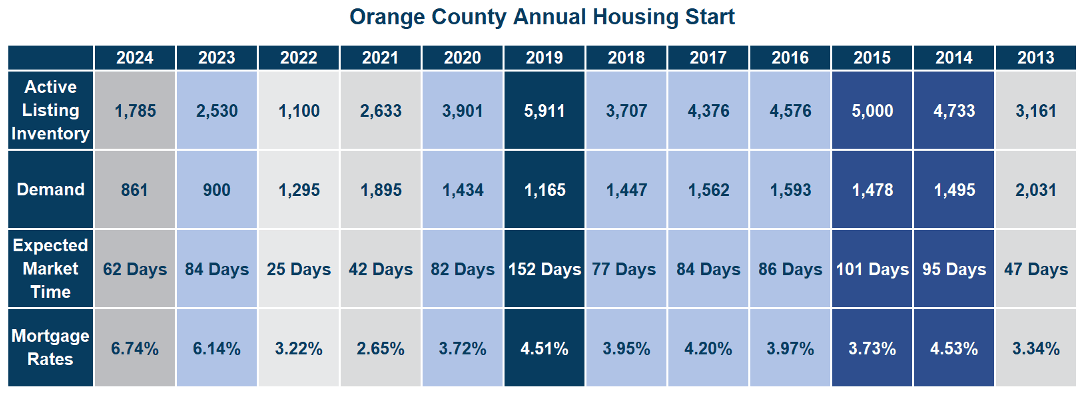
With a higher mortgage rate environment and far fewer homes coming on the market, demand, a snapshot of the last 30 days of pending sales activity, is at its lowest level to start a year since tracking began 20 years ago, only 861. Last year was the prior low with a demand reading of 900 pending sales, an extra 39 or 5%. As rates drop this year, demand readings will increase due to more available homes and improving home affordability.
Today, demand may be at record low levels to start a year, even lower than last year, but when it is combined with a catastrophically low inventory, the Expected Market Time (the number of days to sell all Orange County listings at the current buying pace) is pretty hot compared to pre-pandemic levels. It may not be as insane as 2021 and 2022, but it is considerably hotter than what is considered “normal.” The long-term average start before COVID (2013 to 2022) was an Expected Market Time of 91 days, an additional 29 days, nearly a month longer.
The Orange County housing market will thaw from the holidays and improve from here. Cyclically, far more homes will be placed on the market in January and February compared to November and December, the cycle lows yearly. Buyer demand will increase with the distractions of the holidays in the rearview mirror and more homes entering the fray. Further fueling the increase is how rates are now hovering around 6.75% today, after remaining above 7% since the end of July and even breaching 8% in October. The housing market’s direction is predicated on the direction of mortgage rates and home affordability. As rates drop, affordability will eventually improve enough to instigate more demand. Mortgage rates will gradually fall as the economy slows this year and inflation continues to fall.
ATTENTION BUYERS: Waiting for the market to slow and negotiations to line up in a buyer’s favor is not the answer. For the market to lean in favor of buyers, there needs to be considerably more homes available to purchase compared to weak demand. Unfortunately, there is a chronic scarcity of homes with FOR-SALE signs in the yard. This will not suddenly change anytime soon based on all current trends. With mortgage rates anticipated to drop further this year, there will be increased buyer competition with increased home affordability. Yes, more homes will opt to sell as rates drop, but the more robust demand will offset any increase. Instead, buyers should pursue a purchase with patience and steadfast determination. It may take several offers to find success, but it is that kind of persistence that is ultimately rewarded with the keys to a new home.
ATTENTION SELLERS: Take advantage of the hotter market by pricing a home close to the last comparable or pending sale. Careful pricing will allow a seller to tap into all the buyers waiting for every home that hits the market. A realistic price will allow a seller to attract immediate interest. Sellers who stretch the asking price too much and grossly overprice will result in wasted market time and less activity as the price is adjusted down the road. In this market, it is best to take advantage of the buyer pool that is carefully watching and waiting for every new home that matches their search requirements.
Active Listings
The active inventory dropped by 4% in the past couple of weeks.
The active listing inventory dropped by 77 homes in the past two weeks, down 4%, and now sits at 1,785, its lowest level since April 2022. It was the second lowest reading to start a year since tracking began in 2004, only behind 2022’s 1,100 homes. The inventory dropped to its current catastrophically low level because November and December are when the fewest homeowners come onto the market and opt to sell their homes. It is also when many unsuccessful sellers pull their homes off the market to enjoy the holidays. Further aggravating the issue is that homeowners are unwilling to sell and are hunkering down. From here, expect the inventory to remain muted through January. Last year, the inventory did not rise until April due to more favorable rates and the hunkering-down effect. This year could be more of the same, depending on the direction of mortgage rates. Only time will tell.
Last year, the inventory was 2,530 homes, 42% higher, or 745 more. The 3-year average before COVID (2017 through 2019) was 4,665, an additional 2,880 homes, or 151% extra, more than double where it stands today.
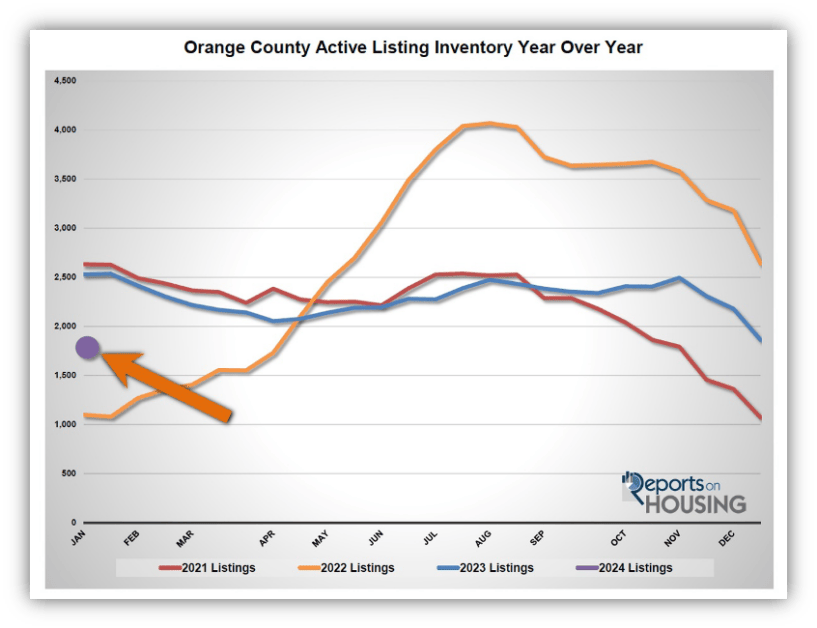
Homeowners continue to “hunker down” in their homes, unwilling to move due to their current underlying, locked-in, low fixed-rate mortgage. For December, 962 new sellers entered the market in Orange County, 532 fewer than the 3-year average before COVID (2017 to 2019), 36% less. Last year, there were 1,028 new sellers, 7% more than today. It will be much easier to isolate when more sellers finally enter the fray in the future, which is anticipated as rates drop.
Demand
Demand plunged by another 18% in the past couple of weeks.
Demand, a snapshot of the number of new pending sales over the prior month, plunged from 1,113 to 861 in the past couple of weeks, down 192 pending sales, or 18%, its lowest initial January reading since tracking began in 2004. This two-week plunge is typical for this time of year. This low demand reading is due to sky-high mortgage rates and very few homes on the market. Demand readings will improve as more homes come on the market. It will dramatically increase over the next couple of months and further increase when rates drop to between 6% and 6.5% when the U.S. economy cools later this year.
Last year, demand was 900, 5% higher than today, or an extra 39 pending sales. The 3-year average before COVID (2017 to 2019) was 1,391 pending sales, 32% more than today, or an additional 530.
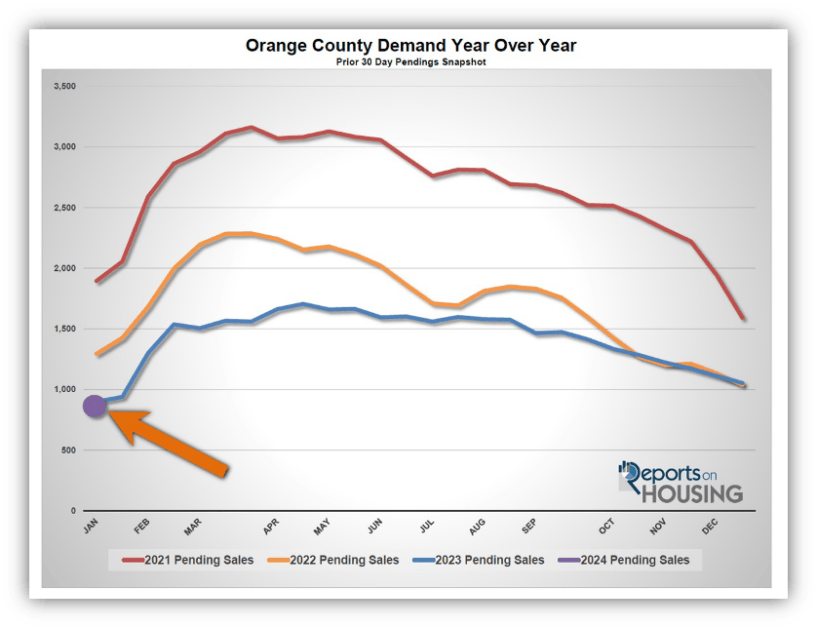
With demand plunging compared to the drop in supply, the Expected Market Time (the number of days to sell all Orange County listings at the current buying pace) increased from 59 to 62 days in the past couple of weeks. Last year, the Expected Market Time was 84 days, slower than today. The 3-year average before COVID was 104 days, much slower than today.
Luxury End
The luxury market has not changed much in the past couple of weeks.
In the past couple of weeks, the luxury inventory of homes priced above $2 million decreased from 664 to 620 homes, down 44, or 7%. Luxury demand decreased by five pending sales, down 4%, and now sits at 115. With supply falling slightly faster than demand, the Expected Market Time for luxury homes priced above $2 million decreased from 166 to 162 days. At 162 days, the luxury market is substantially slower than the 47-day Expected Market Time in the lower ranges (less than $2 million). Careful pricing and plenty of patience are the best approaches to today’s luxury market.
Year over year, luxury demand is up by 24 pending sales or 26%, and the active luxury listing inventory is up by 41 homes or 7%. Last year’s Expected Market Time was 191 days, slower than today.
For homes priced between $2 million and $4 million, the Expected Market Time in the past two weeks decreased from 121 to 105 days. For homes priced between $4 million and $6 million, the Expected Market Time increased from 235 to 357 days. For homes priced above $6 million, the Expected Market Time increased from 293 to 374 days. At 374 days, a seller would be looking at placing their home into escrow around January 2025.
Orange County Housing Summary
- The active listing inventory in the past couple of weeks decreased by 77 homes, down 4%, and now sits at 1,785, its second-lowest start to a year since tracking began in 2004, only behind 2022. In December, 36% fewer homes came on the market compared to the 3-year average before COVID (2017 to 2019), 532 less. Last year, there were 2,530 homes on the market, 745 more homes, or 42% higher. The 3-year average before COVID (2017 to 2019) was 4,665, or 151% extra, more than double.
- Demand, the number of pending sales over the prior month, plunged by 192 pending sales in the past two weeks, down 18%, and now totals 861, its lowest initial demand reading since tracking began in 2004. Last year, there were 900 pending sales, 5% more than today. The 3-year average before COVID (2017 to 2019) was 1,391, or 32% more.
- With demand plunging compared to the drop in supply, the Expected Market Time, the number of days to sell all Orange County listings at the current buying pace, increased from 53 to 62 days in the past couple of weeks. It was 84 days last year, slower than today. The 3-year average before COVID (2017 to 2019) was 104 days, considerably slower than today.
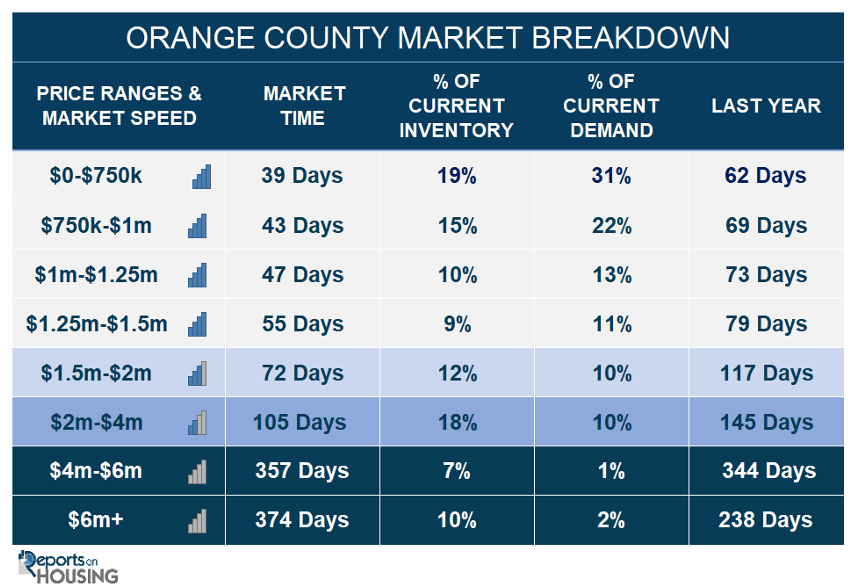
- For homes priced below $750,000, the Expected Market Time increased from 37 to 39 days. This range represents 19% of the active inventory and 31% of demand.
- For homes priced between $750,000 and $1 million, the Expected Market Time increased from 36 to 43 days. This range represents 15% of the active inventory and 22% of demand.
- For homes priced between $1 million and $1.25 million, the Expected Market Time increased from 34 to 47 days. This range represents 10% of the active inventory and 13% of demand.
- For homes priced between $1.25 million and $1.5 million, the Expected Market Time increased from 38 to 55 days. This range represents 9% of the active inventory and 11% of demand.
- For homes priced between $1.5 million and $2 million, the Expected Market Time decreased from 56 to 72 days. This range represents 12% of the active inventory and 10% of demand.
- For homes priced between $2 million and $4 million, the Expected Market Time in the past two weeks decreased from 121 to 105 days. For homes priced between $4 million and $6 million, the Expected Market Time increased from 235 to 357 days. For homes priced above $6 million, the Expected Market Time increased from 293 to 374 days.
- The luxury end, all homes above $2 million, account for 35% of the inventory and 13% of demand.
- Distressed homes, both short sales and foreclosures combined, comprised only 0.6% of all listings and 0.3% of demand. Only six foreclosures and four short sales are available today in Orange County, with ten total distressed homes on the active market, up one from two weeks ago. Last year, 15 distressed homes were on the market, similar to today.
- There were 1,427 closed residential resales in November, identical to November 2022. November marked a 13% drop compared to October 2023. The sales-to-list price ratio was 98.8% for all of Orange County. Foreclosures accounted for 0.1% of all closed sales, and there were no closed short sales. That means that 99.9% of all sales were good ol’ fashioned sellers with equity.
Have a great week.
Sincerely,
Steven Thomas
Quantitative Economics and Decision Sciences