March 18, 2024
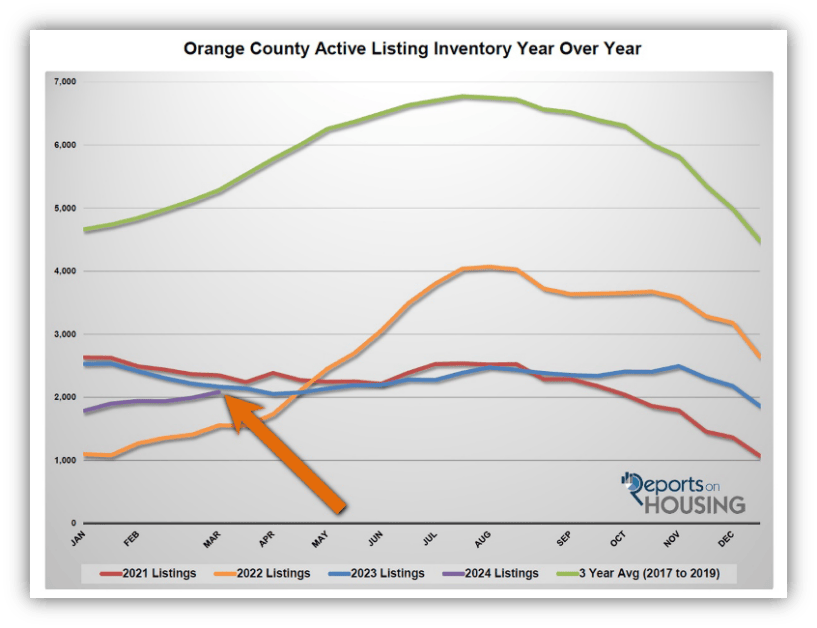
The Orange County inventory has been on the rise and is starting to pick up steam, unlike last year when it continuously dropped through mid-April.
More Homes to Buy
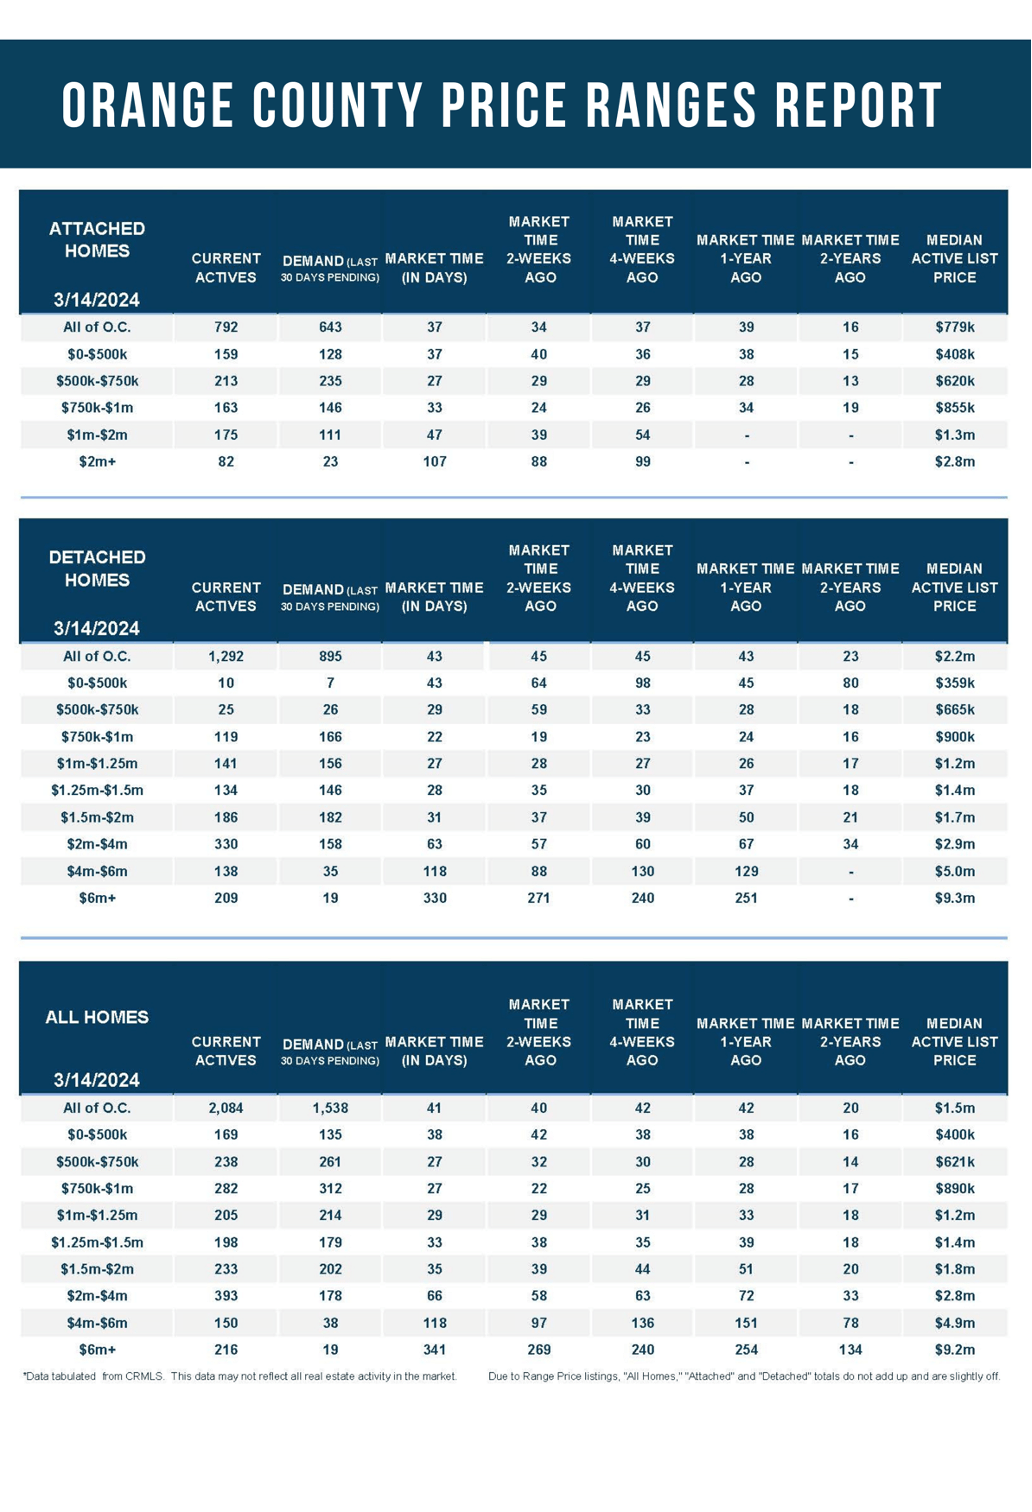
From the start of the year to today, more homes are available in every price range.
Californians have endured severe droughts, which have resulted in water restrictions, new laws, and policies aimed at curtailing the consumption of this valuable resource. Reservoirs reach record lows. Frustrated snow skiers watch the 10-day forecast, anxiously awaiting a hint of future snow. There are years when rainfall totals disappoint. But in years when it rains week after week, snow tops all surrounding mountains, and reservoirs rise, there is a sense of relief. It is a year when a drought has been abated.
Orange County has endured an inventory drought for several years now. Yet, finally, there is rain in the forecast, more homes are coming on the market, and the inventory is slowly rising. The drought of available homes to purchase has not ended, but at least it has been moving in the right direction. For buyers experiencing the drought firsthand, any rise in the number homes to look at is a welcome relief.
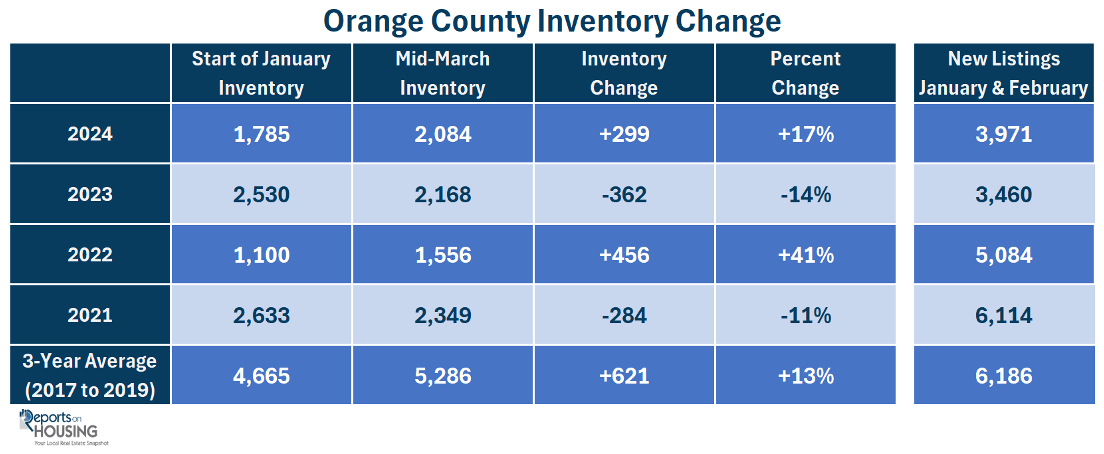
From the start of the year to today, the active inventory has risen from 1,785 to 2,084 homes, a rise of 17% or 299 homes. Mortgage rates bounced between 6.63% and 7.16%. Last year, the inventory dropped from 2,530 to 2,168 homes, down 362 homes or 14%, while mortgage rates fluctuated between 5.99% and 7.1%. It was 2022 when the inventory changed the most, rising from 1,100, a record low start, to 1,556, up 41% or 456 homes. That was when mortgage rates soared from 3.29% at the beginning of January to nearly 4.5% by mid-March. The low mortgage rate environment was quickly coming to an end.
For a proper perspective, it is best to look at the 3-year average before COVID (2017 to 2019) when housing was normal and mortgage rates were in the low to mid 4% range. Cyclically, the active inventory would slowly rise during the Winter Market, then pick up steam during the Spring Market, and slowly reach a peak sometime during the Summer Market. The 3-year average rose from 4,665 to 5,286, up 621 or 13%. The percent change looks misleading because it is smaller than this year and 2022, but that is because there were already a lot of homes on the market before COVID. This year and 2022 started from chronically low, anemic levels. As a result, the percent change exaggerates what is really occurring from a buyer’s perspective. 2,084 homes today is more than the 1,785 to start this year, but it does not feel significant for buyers waiting for more homes to come on the market.
Nonetheless, the rise in inventory is a welcome trend in a housing market starved for a fresh supply, especially in comparison to last year’s dwindling supply. The 2,084 homes available today are much better than the 1,556 available in 2022, yet the total is still 61% lower than the 3-year average before COVID of 5,286 homes when the housing market was functioning at a much better pace.
The inventory has been rising partly due to the higher mortgage rate environment, as rates have eclipsed the 7% mark several times over the past month, and also because more homeowners are opting to sell their homes. When rates surpass the psychological 7% barrier, the inventory grows. That has been true both last year and this year. In addition, there have been 3,971 homeowners who placed their homes on the market in January and February. That is up 15% from last year’s record low, an extra 511 sellers. Yet, the 3-year average was 6,186 homes, 56% higher, or 2,215 additional FOR-SALE signs.
The inventory crisis has not been averted. The drought is far from over. But, slowly, more homes are accumulating on the market. It is a trend to be aware of, especially for sellers. Even though the market is exceptionally hot and negotiations favor sellers, a growing inventory indicates some sellers are overzealous and lingering on the market, stretching their asking price too high. With higher rates, many buyers are not biting when pricing is out of bounds. That is precisely why 22% of the active inventory has adjusted their price lower at least once. With a climbing inventory, sellers must price appropriately to secure success.
Active Listings
The active inventory increased by 5% in the past couple of weeks.
The active listing inventory increased by 92 homes in the past two weeks, up 5%, and now sits at 2,084. The Spring Housing market has finally arrived. There was a palpable change in the air as soon as clocks officially sprang forward on March 10th. The days grow longer, and the sun does not set until 7 PM. Extra daylight translates to more time for buyers to view homes. Buyer activity heats up, along with more homeowners entering the fray. The Spring Market is when the rising inventory typically picks up steam and rises a bit faster. It is also when demand peaks and then remains elevated through the Summer Market. Yet, the inventory has had trouble growing, with fewer homes placed on the market than normal due to so many homeowners enjoying their low fixed-rate mortgages. Yet, if rates remain above 7% with duration, expect the inventory to methodically rise.
Last year, the inventory was 2,168 homes, 4% higher, or 84 more. The 3-year average before COVID (2017 through 2019) was 5,286, an additional 3,202 homes, or 154% extra, more than double where it stands today.
Homeowners continue to “hunker down” in their homes, unwilling to move due to their current underlying, locked-in, low fixed-rate mortgage. For February, 1,954 new sellers entered the market in Orange County, 1,178 fewer than the 3-year average before COVID (2017 to 2019), 38% less. Last February, there were 1,755 new sellers, 10% fewer than this year. More sellers are finally opting to sell compared to the previous year.
Demand
Demand increased by 4% in the past couple of weeks.
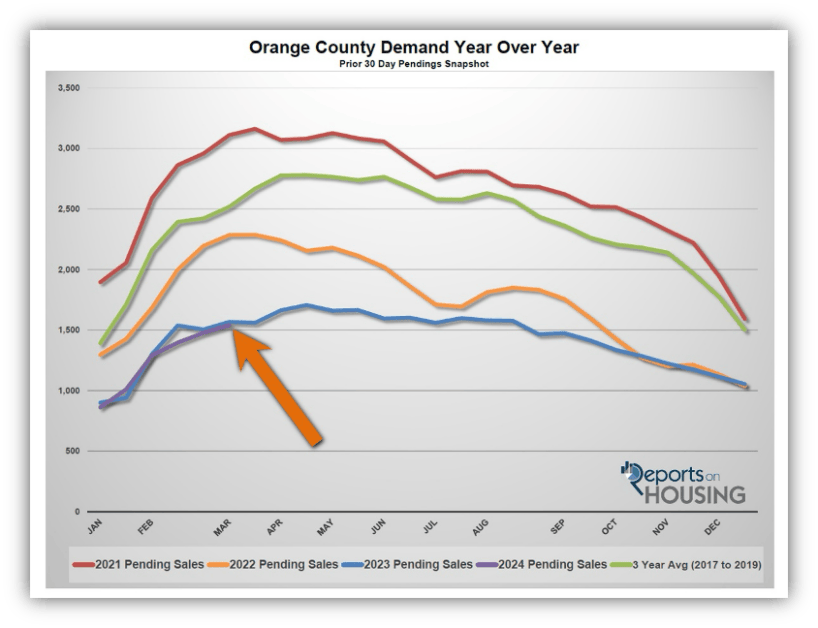
Demand, a snapshot of the number of new pending sales over the prior month, increased from 1,476 to 1,538 in the past couple of weeks, up 62 pending sales, or 4%, its highest level since August. Yet, it is the lowest mid-March reading since tracking began in 2004. Now that the Spring Market has arrived and more homes are coming on the market, expect demand to continue to rise and peak sometime in April. The only caveat is that the Federal Reserve has signaled that they will cut rates three times this year and start as soon as economic data supports a cooling economy. When that happens, rates will fall, and demand will elevate. There is a chance that the peak in demand could occur later this year, in summer, or even in the fall.
Last year, demand was 1,567, 2% more than today, or 29 extra pending sales. The 3-year average before COVID (2017 to 2019) was 2,517 pending sales, 64% more than today, or an additional 979.
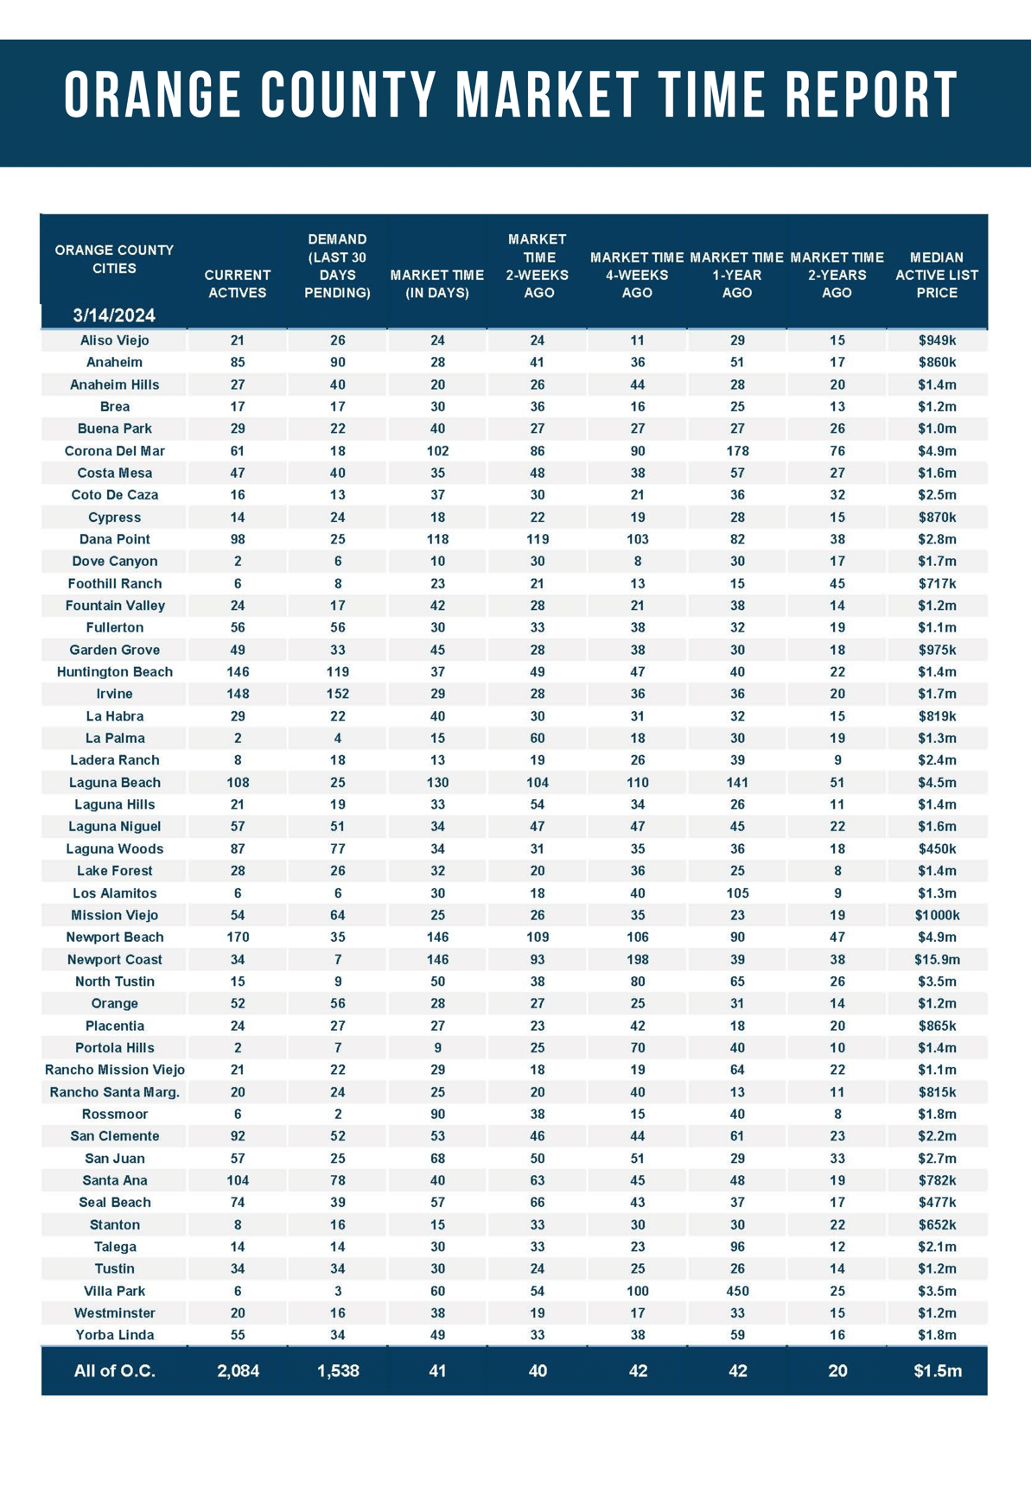
With supply rising a bit faster than demand, the Expected Market Time (the number of days to sell all Orange County listings at the current buying pace) increased from 40 to 41 days in the past couple of weeks. Last year, the Expected Market Time was 42 days, similar to today. The 3-year average before COVID was 63 days, slower than today.
Luxury End
The luxury market slowed in the past couple of weeks.
In the past couple of weeks, the luxury inventory of homes priced above $2 million increased from 706 to 759 homes, up 53, or 8%. Luxury demand decreased by 18 pending sales, down 7%, and now sits at 235. With inventory surging higher and demand falling, the Expected Market Time for luxury homes priced above $2 million climbed from 84 to 97 days. While the luxury price ranges may have cooled in the past couple of weeks, 97 days is much hotter than before COVID. This is due to the strength of equity markets. Yet, for homes priced below $2 million, the Expected Market Time is 31 days, far more instant than luxury.
Year over year, the active luxury inventory is up by 135 homes or 22%, and luxury demand is up by 51 pending sales or 28%. Last year’s Expected Market Time was 102 days, similar to today.
In the past two weeks, the expected market time for homes priced between $2 million and $4 million increased from 58 to 66 days. For homes priced between $4 million and $6 million, the Expected Market Time increased from 97 to 118 days. For homes priced above $6 million, the Expected Market Time increased from 269 to 341 days. At 341 days, a seller would be looking at placing their home into escrow around July 2025.
Orange County Housing Summary
- The active listing inventory in the past couple of weeks increased by 92 homes, up 5%, and now sits at 2,084. It is still the second-lowest mid-February reading since tracking began in 2004, only behind 2022. In February, 38% fewer homes came on the market compared to the 3-year average before COVID (2017 to 2019), 1,178 less. 199 more sellers came on the market this February compared to 2023. Last year, there were 2,168 homes on the market, 84 more homes, or 4% higher. The 3-year average before COVID (2017 to 2019) was 5,286, or 154% extra, more than double.
- Demand, the number of pending sales over the prior month, increased by 62 pending sales in the past two weeks, up 4%, and now totals 1,538, the lowest mid-March reading since tracking began. Last year, there were 1,567 pending sales, 2% more than today. The 3-year average before COVID (2017 to 2019) was 2,517, or 64% more.
- With supply rising faster than demand, the Expected Market Time, the number of days to sell all Orange County listings at the current buying pace, increased from 40 to 41 days in the past couple of weeks. It was 42 days last year, similar to today. The 3-year average before COVID (2017 to 2019) was 63 days, slower than today.
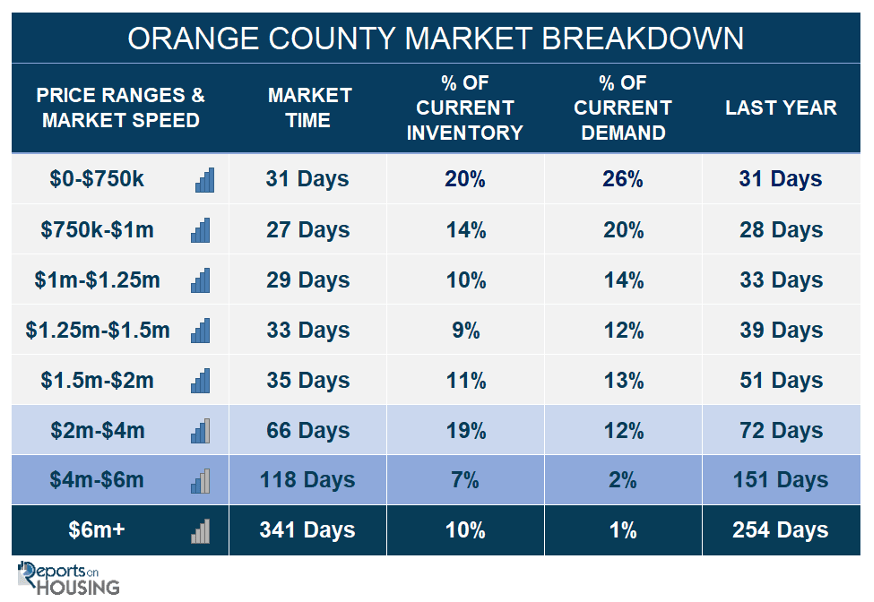
- The Expected Market Time for homes priced below $750,000 decreased from 35 to 31 days. This range represents 20% of the active inventory and 26% of demand.
- The Expected Market Time for homes priced between $750,000 and $1 million increased from 22 to 27 days. This range represents 14% of the active inventory and 20% of demand.
- The Expected Market Time for homes priced between $1 million and $1.25 million remained unchanged at 29 days. This range represents 10% of the active inventory and 14% of demand.
- The Expected Market Time for homes priced between $1.25 million and $1.5 million decreased from 38 to 33 days. This range represents 9% of the active inventory and 12% of demand.
- The Expected Market Time for homes priced between $1.5 million and $2 million decreased from 39 to 35 days. This range represents 11% of the active inventory and 13% of demand.
- In the past two weeks, the expected market time for homes priced between $2 million and $4 million increased from 58 to 66 days. For homes priced between $4 million and $6 million, the Expected Market Time increased from 97 to 118 days. For homes priced above $6 million, the Expected Market Time increased from 269 to 341 days.
- The luxury end, all homes above $2 million, account for 36% of the inventory and 15% of demand.
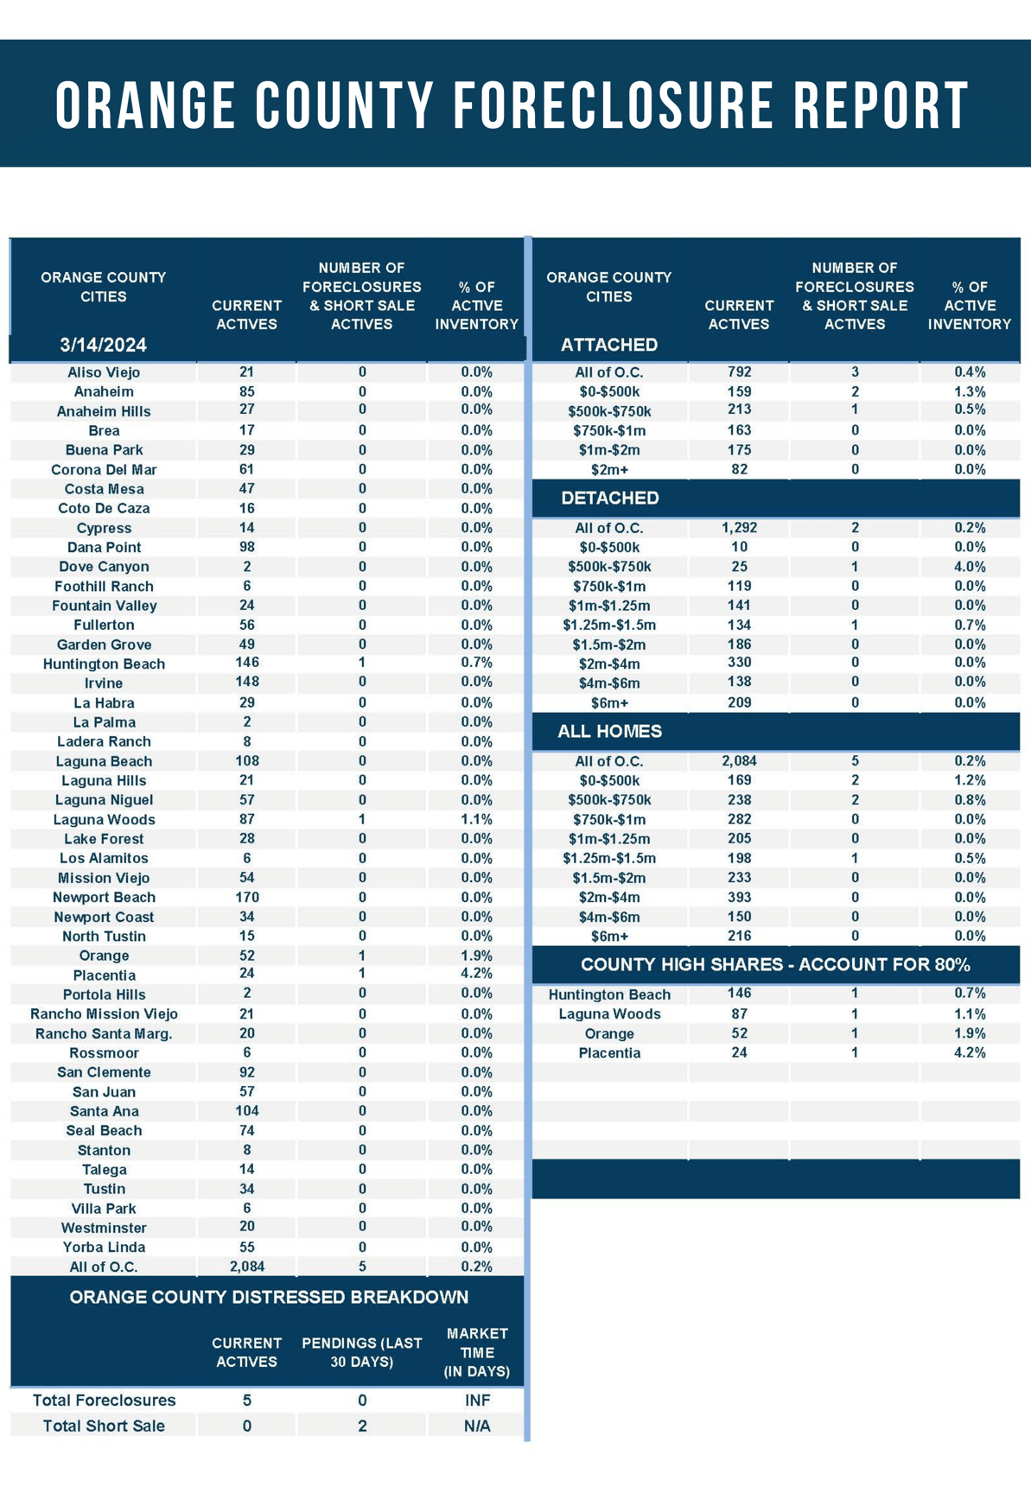
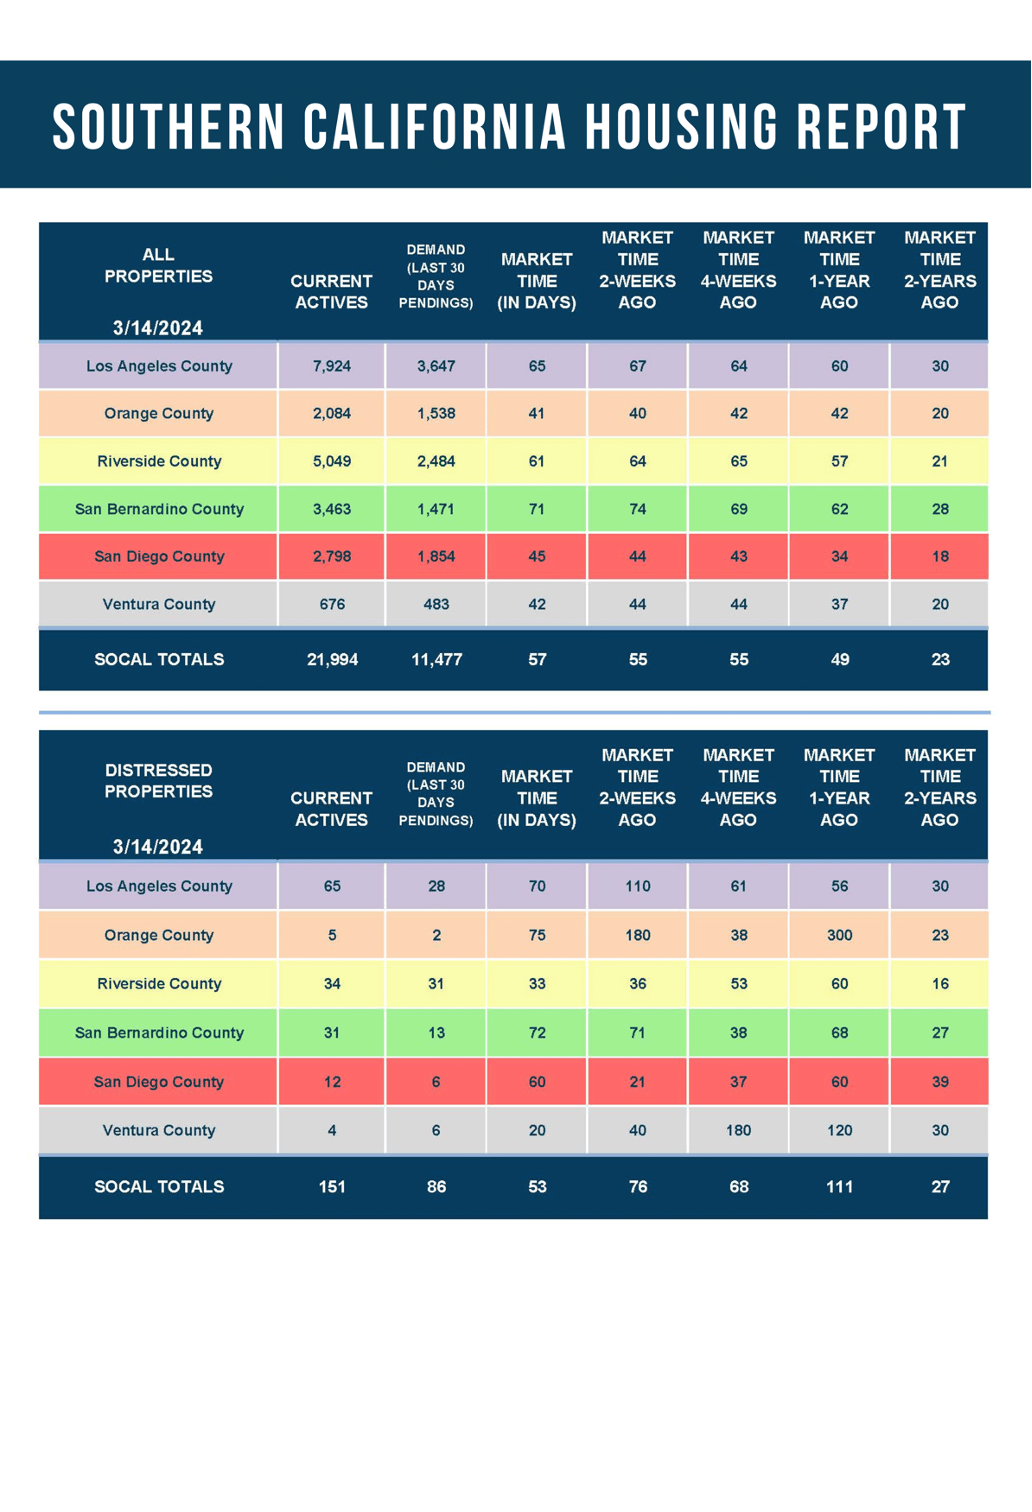
- Distressed homes, both short sales and foreclosures combined, comprised only 0.2% of all listings and 0.1% of demand. Only five foreclosures and no short sales are available today in Orange County, with five total distressed homes on the active market, unchanged from two weeks ago. Last year, ten distressed homes were on the market, similar to today.
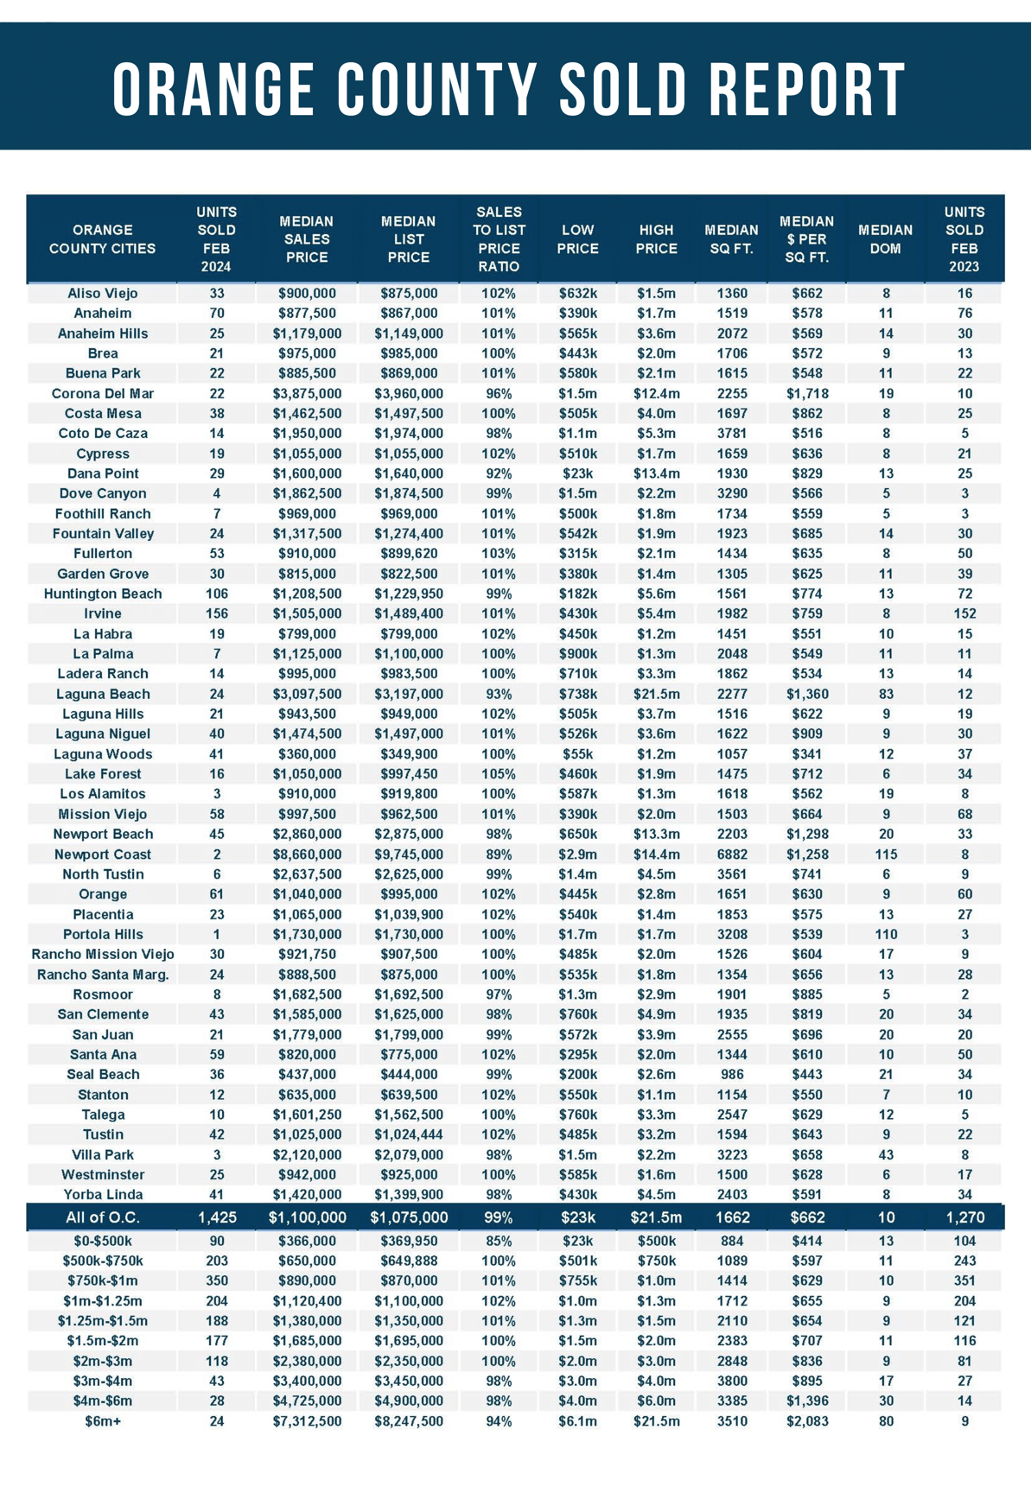
- There were 1,425 closed residential resales in February, up 12% from February 2023’s 1,270 and 21% from January 2024. The sales-to-list price ratio was 99.4% for Orange County. Foreclosures accounted for 0.4% of all closed sales, and there were no closed short sales. That means that 99.6% of all sales were good ol’ fashioned sellers with equity.
Have a great week.
Sincerely,
Steven Thomas
Quantitative Economics and Decision Sciences
Copyright 2024—Steven Thomas, Reports On Housing—All Rights Reserved. This report may not be reproduced in whole or in part without express written permission from the author.