August 17, 2026
AI is not an accurate gauge for determining a home’s price
and should only be used as a starting point in a conversation
with a real estate professional.
AI and AVM’s Reliability
Carefully reviewing all recent comparable closed and pending sales is the only way to establish price accurately.
In 1936, one of the largest polls ever conducted predicted with near certainty that Alf Landon would defeat President Franklin D. Roosevelt by a landslide. Before the election, The Literary Digest collected nearly 2.4 million responses. Instead, President Roosevelt absolutely dominated, winning 98.49% of the Electoral College. The problem was not a shortage of data. Instead, it was the assumption that more data automatically produced greater accuracy.
Nearly a century later, homeowners can make a similar mistake when they place too much confidence in AI or Automated Valuation Models (AVMs) to arrive at a home’s value. They can process an enormous amount of housing data in seconds, but it still cannot see everything that determines what a home is truly worth: its FAIR MARKET VALUE. Instead, it provides a value that is typically inaccurate.
Many homeowners rely on Zillow to determine their home’s value. But more and more homeowners are turning to AI chatbots to establish value. In asking Google’s Gemini, “Is AI better than Zillow in pricing a home?” It states, “No, generalized AI models are not inherently better than Zillow because Zillow’s Zestimate is already a highly sophisticated, proprietary AI system built specifically for real estate valuation. They have spent two decades training its neural networks and machine learning models on billions of data points to create its current AVM.” Yet, Zillow acknowledges its shortcoming stating that their Zestimate “provides a transparent, free starting point to help homeowners, buyers and sellers better understand what a home may be worth.” It is “not an appraisal and can’t be used in place of an appraisal.”
This is evident in looking at the error rate for their Zestimates in Orange County. On their website, they detail their accuracy for homes that were actively listed and then sold, as well as homes that were “off-market,” never entered into the Multiple Listing Service, and then sold. For homes that were active listings, they recalculate the Zestimate immediately after a home hits the market, using the listing price as a strong signal of market value and the listing description to assess upgrades, condition, renovations, and additions. After adjusting, of course, they are more accurate. The issue is that when homeowners rely on the Zestimate before it is recalculated, it is inaccurate. It is just a starting point for a conversation with a real estate professional about a home’s price.
In Orange County, for homes that are actively listed, the median Zestimate error rate is 1.9%. Meaning that a Zestimate of $1 million is off by plus-or-minus $19,000. The home would sell somewhere between $981,000 and $1,019,000. Yet that error rate is based on homes that are recalculated AFTER they are listed FOR SALE, giving tremendous weight to asking prices.
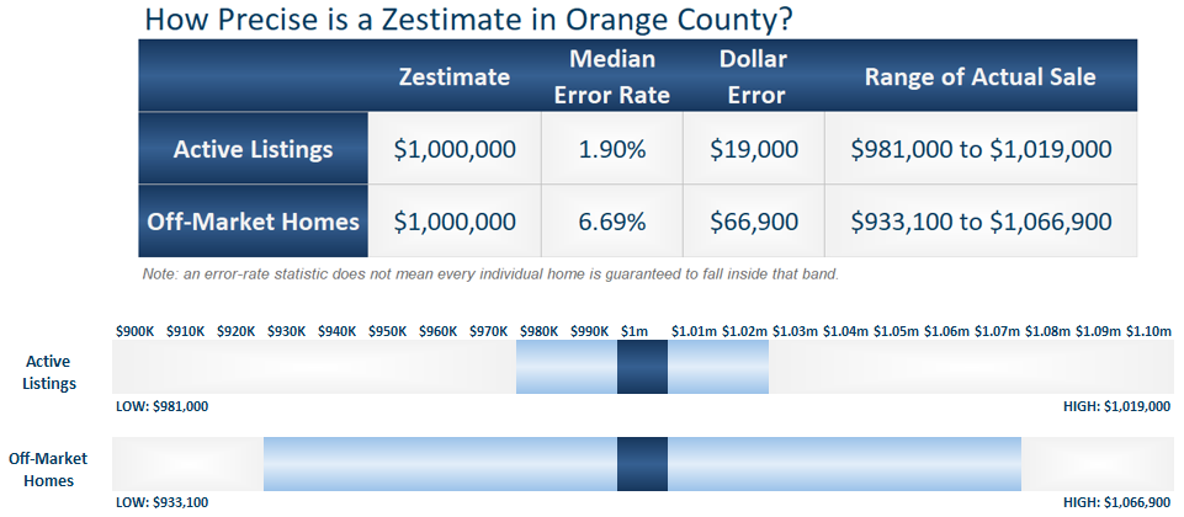
For homeowners that turn to Zillow BEFORE listing their homes, the median error rate is 6.69%. That translates to a plus-or-minus $66,900 for a $1 million Zestimate. That means the home ultimately sold somewhere between $933,100 and $1,066,900. That is an ominous $133,800 range.
Even a highly sophisticated, proprietary AI system built specifically for evaluating home prices can be substantially inaccurate. How can the errors be so significant? AI and AVMs cannot see beyond the data. They cannot see under the roof of a home. They do not understand a home’s condition, upgrades, or subtle nuances of a particular street, neighborhood, or location. That is where HUMAN REAL ESTATE EXPERTS with local market knowledge have a distinct advantage.
Every property has a unique value shaped by numerous factors. A real estate professional with firsthand knowledge of the property and neighborhood can more precisely isolate its FAIR MARKET VALUE by carefully weighing recent comparable closed and pending sales against the home’s condition, upgrades, views, lot characteristics, privacy, craftsmanship, floor plan, curb appeal, location nuances, remodeling, amenities, and much more.
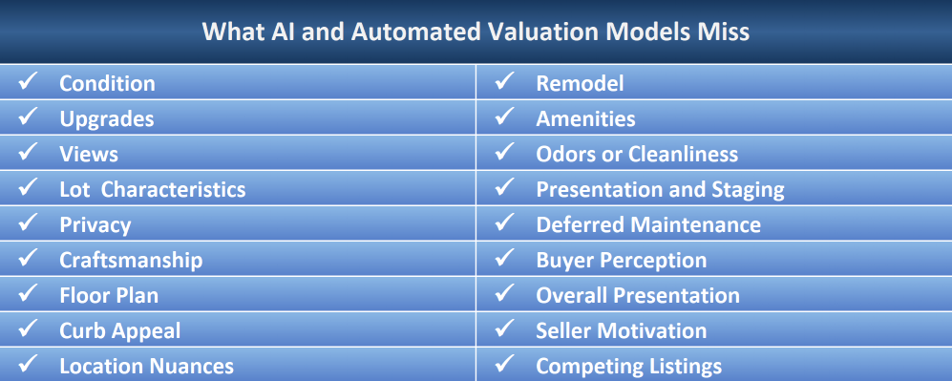
AI has become an extraordinarily powerful tool, but determining a home’s FAIR MARKET VALUE requires more than processing data. AI and AVMs cannot walk through a home, evaluate its condition and upgrades, understand the nuances that make up the neighborhood, or carefully weigh how it compares with recent comparable closed and pending sales. Instead, AI should be viewed as a starting point, not the ultimate answer in determining a home’s value. Accurately pricing a home requires firsthand knowledge and expertise of a local real estate professional.
Active Listings
The inventory increased by 8 in the past couple of weeks.
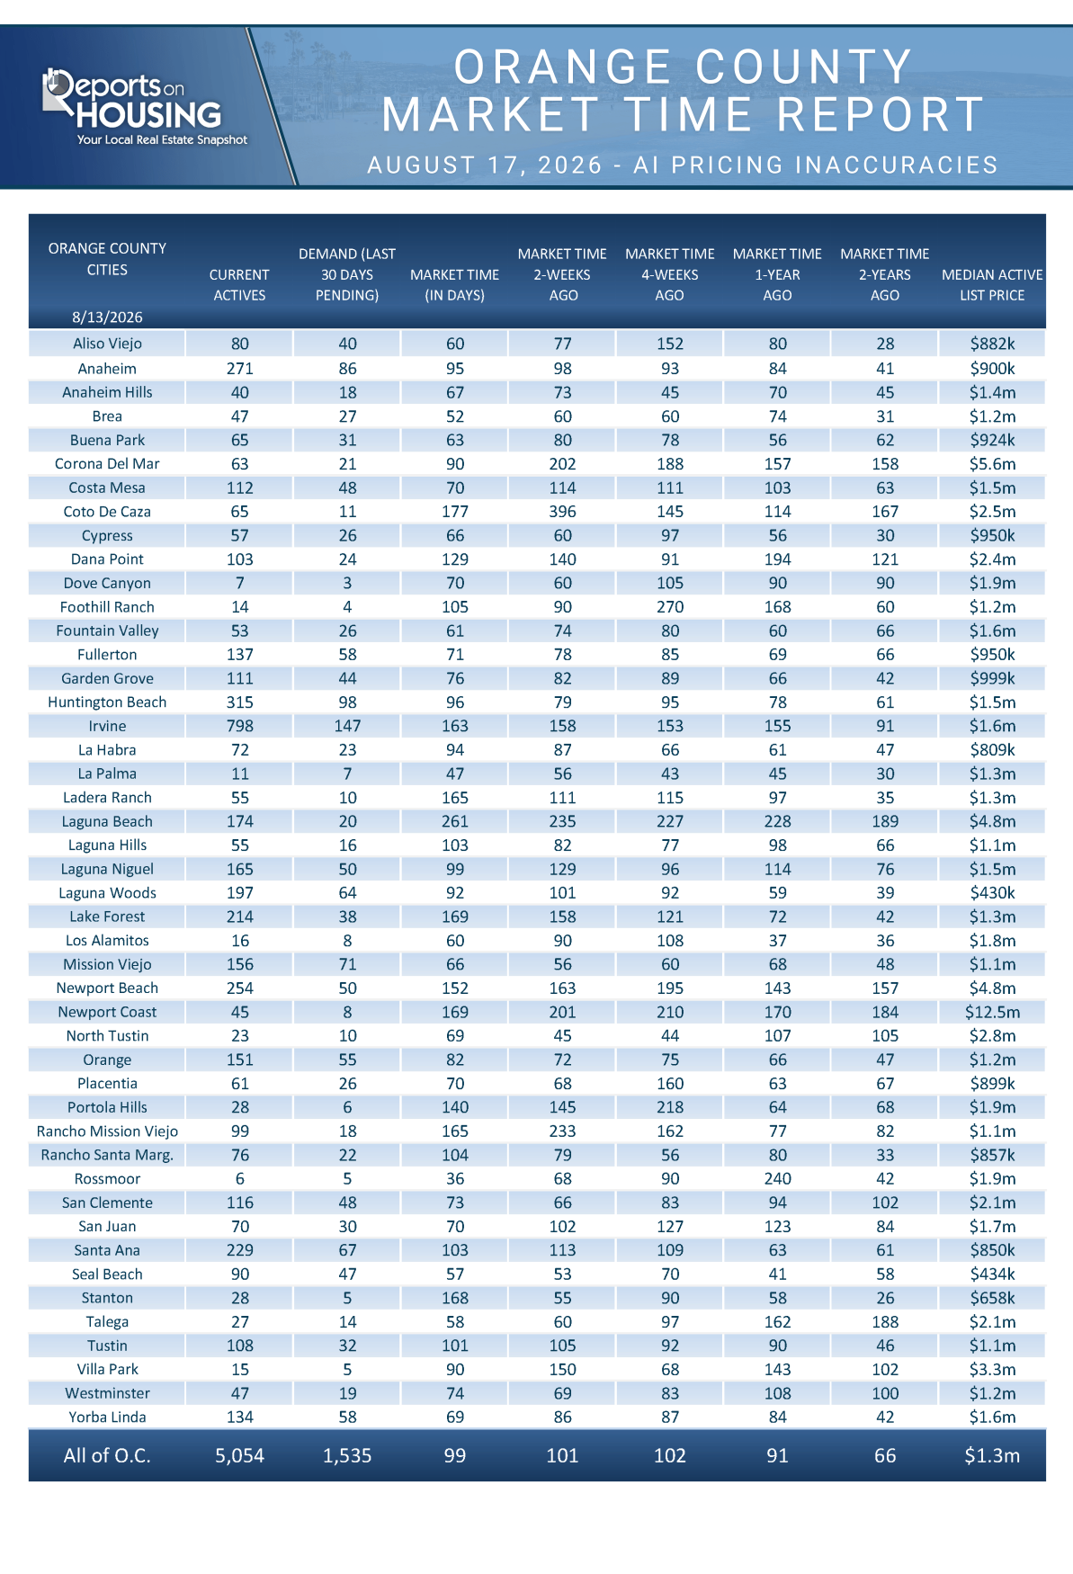
The active listing inventory increased by 8 homes over the past two weeks, nearly unchanged, to 5,054. It appears as if the inventory has reached a plateau, yet not quite peaked. It has increased from 5,020 to 5,054 over the past four weeks, up only 34 homes. It is the last hurrah of summer as housing is about to transition to the Autumn Market, which officially begins in September. That is when the inventory slowly falls from week to week. With both the Spring and Summer Markets in the rearview mirror, fewer homes are placed on the market, and many unsuccessful sellers throw in the proverbial towel.
Last year, the inventory was at 5,011 homes,with 43 fewer homes (-1%). The 3-year average before COVID (2017 through 2019) was 6,723, an additional 1,669 homes, or 33% more.
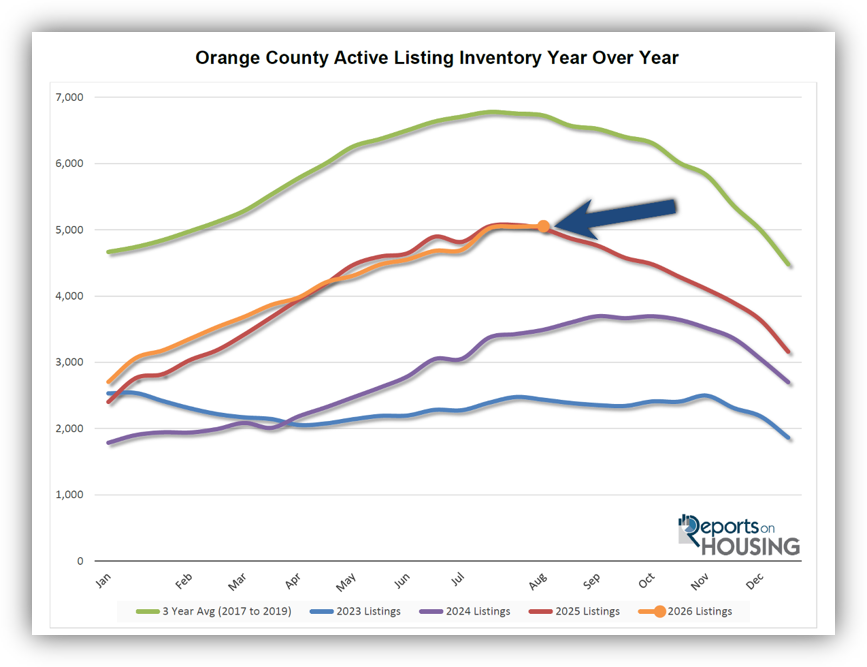
Homeowners continue to “hunker down” in their homes, unwilling to move because of their current, underlying, locked-in, low fixed-rate mortgage. This trend has been easing from the lows established in 2023. Through July, 18,948 homes were placed on the market in Orange County, 6,899 fewer than the 3-year average before COVID (2017-2019), 27% less. In 2025, 19,520 homes entered the market (3% more), compared with 17,052 in 2024 (10% fewer) and 14,616 in 2023 (23% fewer). Slightly fewer homes have been coming to market this year than last.
Demand
Demand increased by 3% in the past couple of weeks.
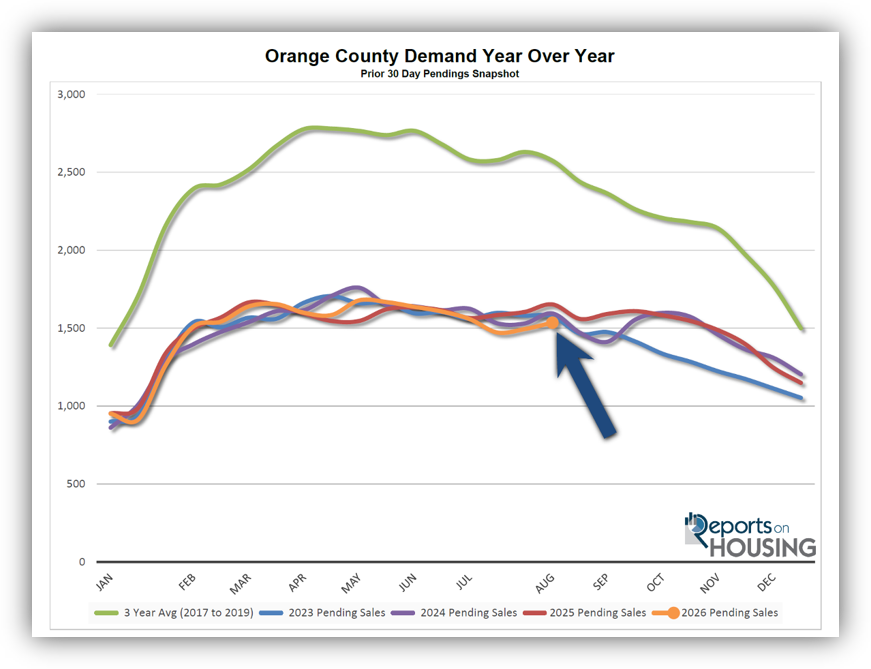
Demand, a snapshot of the number of new pending sales over the prior month, increased from 1,494 to 1,535 in the past couple of weeks, up 41 pending sales, or 3%, its largest rise since the start of May. Nonetheless, it is the lowest mid-August reading since tracking began in 2004. Like the active listing inventory, this rise is the last hurrah of the Summer Market. From here, expect buyer demand to slowly decline from week to week, in line with supply.
Last year, demand was 1,652, with 117 additional pending sales (+8%). The 3-year average before COVID (2017 to 2019) was 2,574 pending sales, 68% more than today, or an additional 1,039.
As the Federal Reserve has indicated, it is essential to monitor all economic releases for signs of a slowdown. These releases can cause mortgage rates to rise or fall, depending on how they compare with market expectations. It is also important to monitor any developments in the Iran conflict and its impact on the oil market, and ultimately inflation, which can also cause mortgage rates to rise or fall. This week marks the release of the S&P Global Manufacturing and Services Purchasing Managers Index (PMI), which tracks the strength of the U.S. manufacturing and services sectors. Next week, the Personal Consumption Expenditures – Price Index (PCE), the Fed’s preferred inflation gauge, will be released.
Expected Market Time
The Expected Market Time dropped by two days over the past couple of weeks.
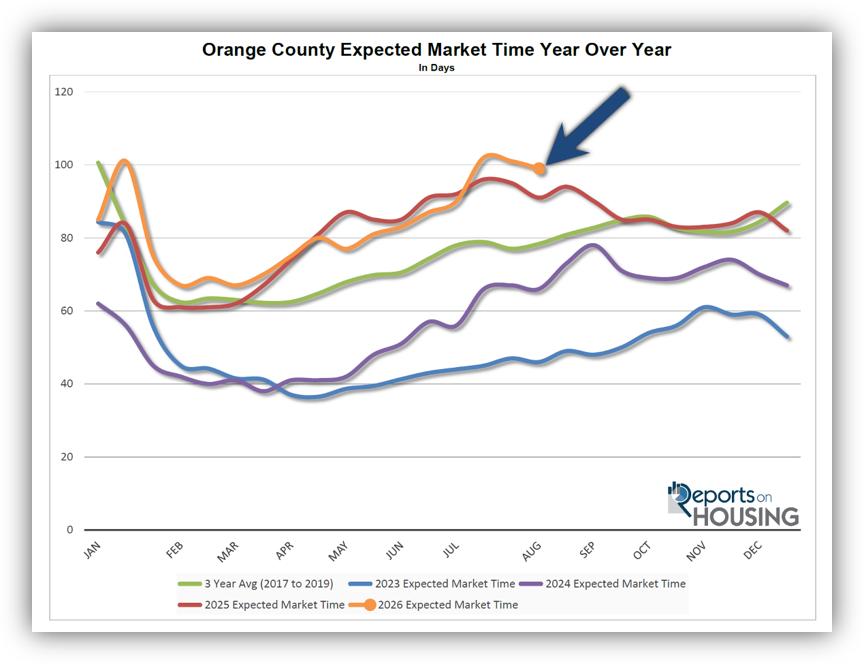
With the supply of available homes rising by 8 homes, nearly unchanged, and demand rising by 41 pending sales, up 3%, the Expected Market Time (the number of days it takes to sell all Orange County listings at the current buying pace) decreased from 101 to 99 days in the past couple of weeks.
Last year, it was 91 days, slightly faster than today. The 3-year average before COVID (2017 to 2019) was 79 days, considerably faster than today.
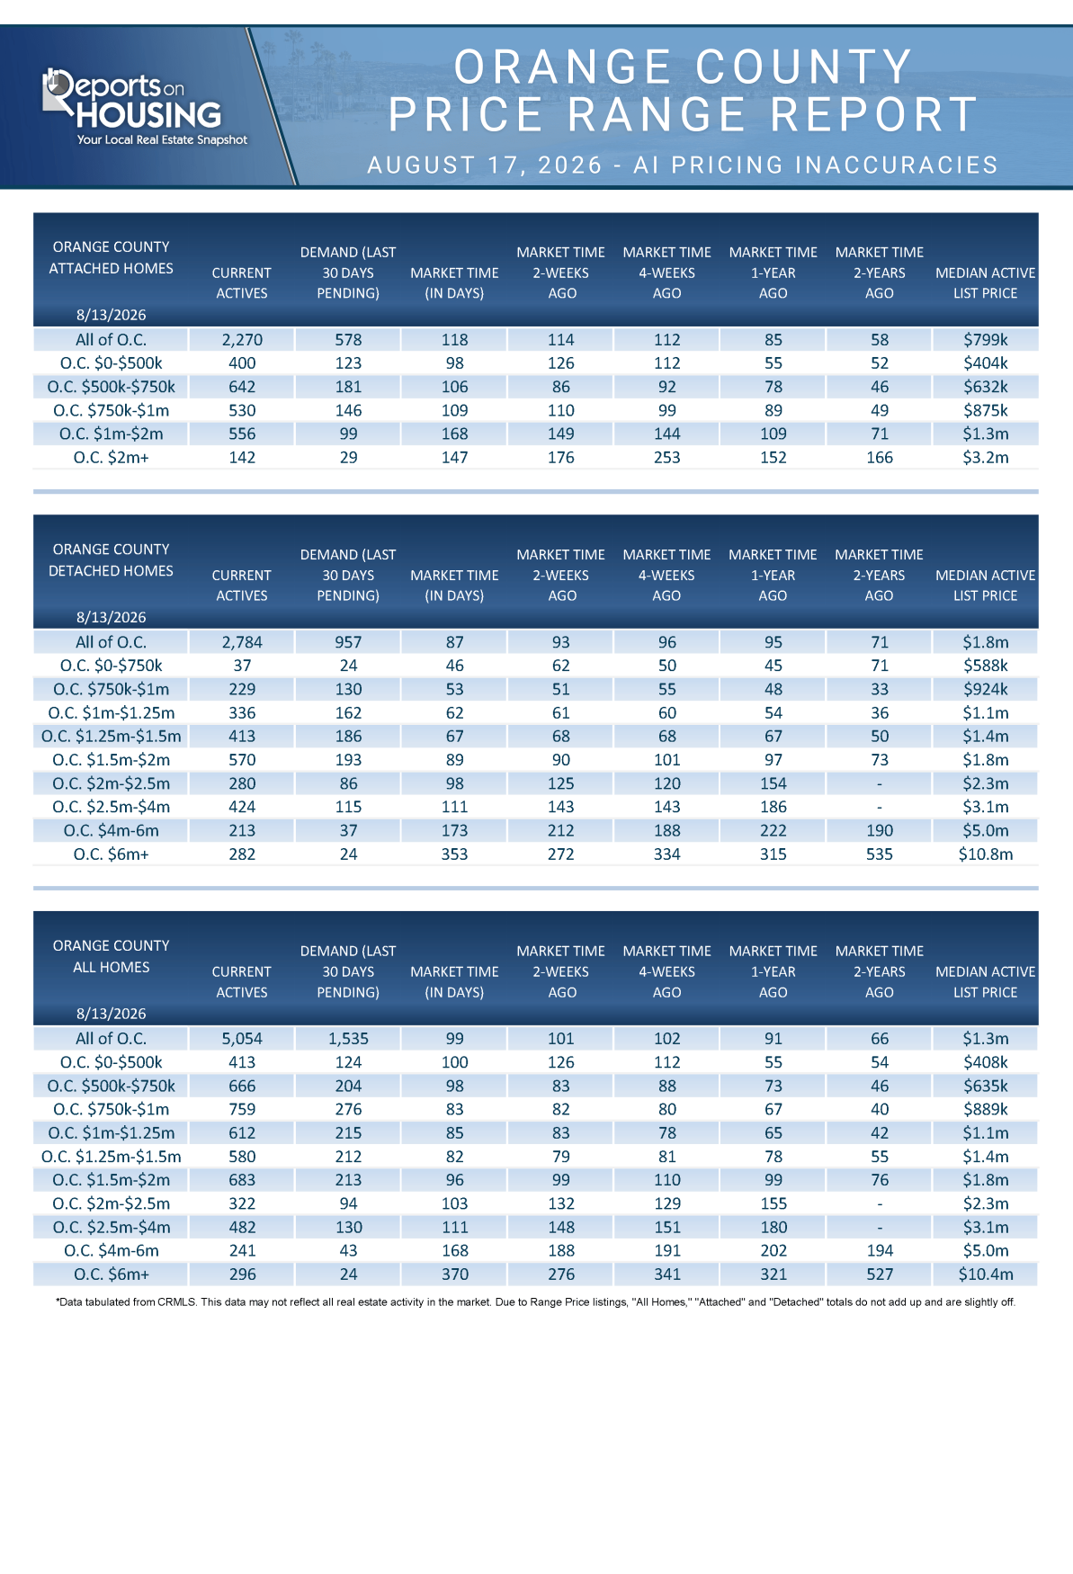
The Expected Market Time for condominiums and townhomes increased from 114 to 118 days in the past two weeks. It was 85 days last year. For detached homes, the Expected Market Time decreased from 93 to 87 days. It was 95 days a year ago. The detached-home market remains significantly faster than the attached-home market.
Luxury End
The luxury market improved over the past couple of weeks.
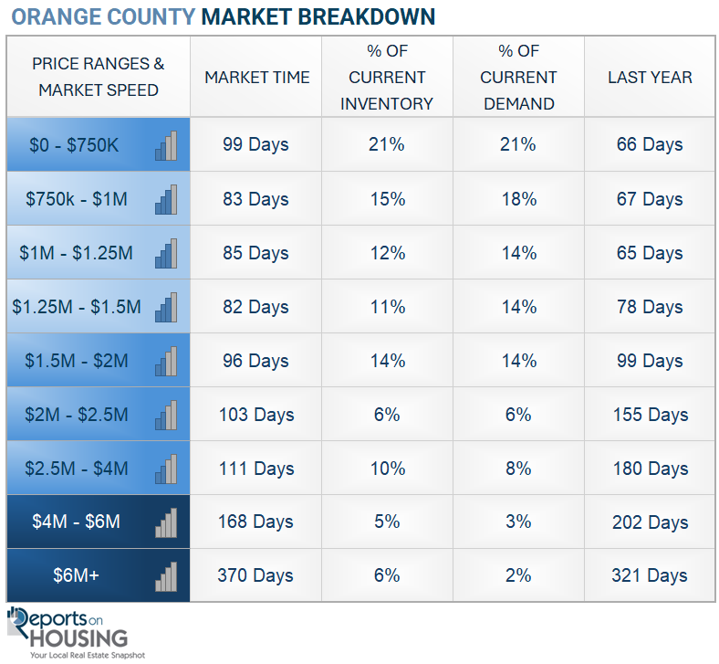
In the past couple of weeks, the luxury inventory of homes priced above $2.5 million (the top 10% of the Orange County housing market) decreased from 1,055 to 1,019, a drop of 36 (-3%). Luxury demand increased from 175 to 197, up 22 (+13%). With supply falling and demand rising, the Expected Market Time for luxury homes priced above $2.5 million decreased from 181 to 155 days, its strongest reading since the start of May. The luxury market is much stronger than it was at this time last year.
Year over year, the active luxury inventory is down by 172 homes (-14%), and luxury demand is up by 28 pending sales (+17%). Last year’s Expected Market Time was 211 days, slower than today.
In the past two weeks, the Expected Market Time for homes priced between $2.5 million and $4 million decreased from 148 to 111 days. For homes priced between $4 million and $6 million, the Expected Market Time decreased from 188 to 168 days. For homes priced above $6 million, the Expected Market Time increased from 276 to 370 days. Luxury is at 155 days overall. At this pace, a seller would be looking at becoming a pending sale around January 2027.
Orange County Housing Summary
- INVENTORY: The active listing inventory in the past couple of weeks increased by 8 homes, nearly unchanged, and now stands at 5,054. Last year, there were 5,011 homes on the market, 43 fewer homes (-1%). The 3-year average before COVID (2017 to 2019) was 6,723, which is 33% higher. From January through July, 27% fewer homes came on the market than the 3-year average before COVID (2017 to 2019), 6,899 fewer. There were 572 fewer than last year, 1,896 more than in 2024, and 4,332 more than in 2023.
- DEMAND: Buyer demand, the number of pending sales over the prior month, increased by 41 in the past two weeks, and now stands at 1,535 (+3%), its largest rise since the start of May. Last year, there were 1,652 pending sales, up 8%. The 3-year average before COVID (2017 to 2019) was 2,574, which is 68% higher than today.
- MARKET TIME: With the inventory nearly unchanged and demand rising, the Expected Market Time, the number of days to sell all Orange County listings at the current buying pace, decreased from 101 to 99 days in the past couple of weeks. Last year, it was 91 days, slightly faster than today. The 3-year average before COVID (2017-2019) was 79 days, faster than today.
- LUXURY: In the past two weeks, the Expected Market Time for homes priced between $2.5 million and $4 million decreased from 148 to 111 days. For homes priced between $4 million and $6 million, the Expected Market Time decreased from 188 to 168 days. For homes priced above $6 million, the Expected Market Time increased from 276 to 370 days.
- DISTRESSED HOMES: Short sales and foreclosures combined comprised only 0.2% of all listings and 0.7% of demand. Four foreclosures and five short sales are available today in Orange County, bringing the total of distressed homes on the active market to 9, down one from two weeks ago. Last year, 7 distressed homes were on the market, similar to today.
- CLOSED SALES: There were 1,930 closed residential resales in July, nearly identical to July 2025’s 1,934 sales, and down 3% from June 2026. The sales-to-list price ratio in Orange County was 99.5%. Foreclosures accounted for 0.05% of all closed sales, and short sales accounted for 0.05%. That means that 99.9% of all sales were sellers with equity.
Have a great week.
Sincerely,
Steven Thomas
Quantitative Economics and Decision Sciences
Copyright 2026—Steven Thomas, Reports On Housing—All Rights Reserved. This report may not be reproduced in whole or in part without the author’s express written permission.