August 3, 2026
The attached home market, condominiums and townhomes, is substantially slower than the detached home market, which is pushing prices lower.
Condos Take Longer to Sell
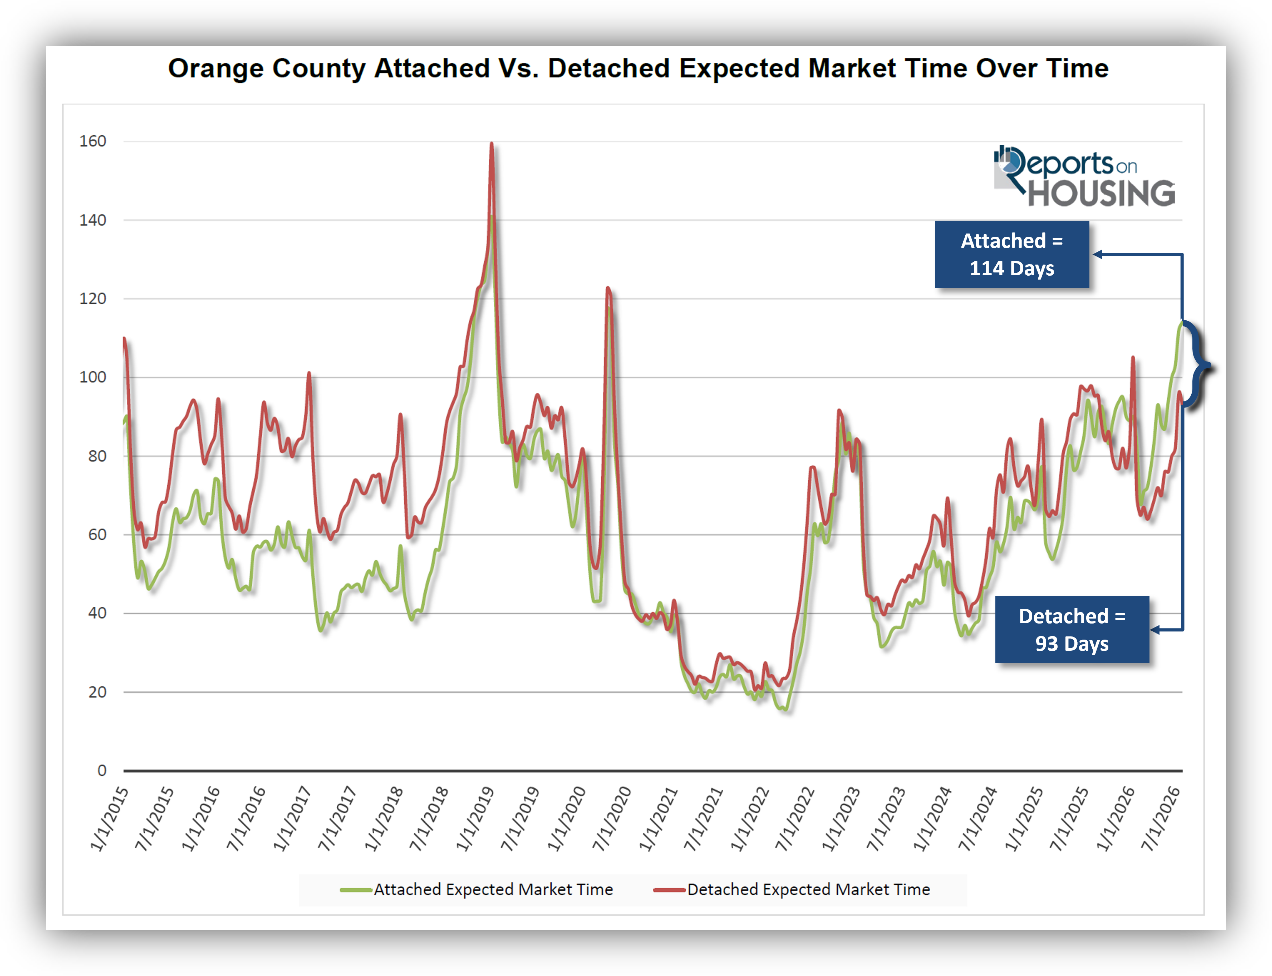
The market time for attached homes is 114 days, compared to 93 days for detached homes.
Budget-conscious families, individuals, and young adults often looked to the “$1 menu” at fast food restaurants for a quick, inexpensive meal. A family could eat out with many affordable options to choose from. It felt like they were catching a break without breaking the bank. Fast forward to today, and the $1 menu has been replaced with the “value menu.” This value menu includes meal deals and items under $3. Families looking for an affordable meal option are no longer catching the break that they once enjoyed. A family of four can expect to pay around $25 today for a fast-food “deal,” making it much harder to eat out on a strict budget.
Condominiums and townhomes used to be the affordable option for buyers hoping to break into the housing market. They offered a lower-cost alternative to detached homes and served as a “stepping stone” to homeownership. In addition to a more attainable purchase price, many condominium associations included amenities such as pools, spas, fitness centers, outdoor barbecues, and community clubhouses. Like the “$1 menu” being replaced with the much higher-priced “value menu,” the cost to purchase condominiums and townhomes has climbed dramatically. For many families, what was once an accessible path to homeownership is no longer the financial break it used to be.
According to Zillow’s Home Value Index, the median detached home is $1,305,471 as of June. For attached homes, it is $760,391, a much more affordable option. Yet, the Orange County median monthly Homeowners Association (HOA) dues for all attached sales in June were $507. For detached homes, it was $0.
Many condominium associations do not have sufficient reserves. These reserves are the association’s savings for major future repairs, maintenance, and replacements. And, starting in January 2027, Freddie Mac and Fannie Mae, who handle 70% of all conventional loans, are increasing their reserve requirements from 10% to 15% of the association’s annual budgeted assessment income. To make up the difference, associations will need to either increase monthly HOA dues or issue special assessments. In addition, higher maintenance costs, soaring insurance premiums, and stricter safety legislation have all impacted monthly dues.
As a result of higher costs, attached homes are taking much longer to sell compared to detached homes. The attached home inventory is up 17% compared to last year, from 1,912 to 2,231, while demand (a snapshot of the number of new pending sales over the prior month) is down 8%, from 636 to 587 pending sales. The Expected Market Time (the number of days it takes to sell all Orange County listings at the current buying pace) is 114 days for attached homes, compared to 90 days a year ago.
The detached home inventory is down 11% compared to last year, from 3,159 to 2,815, while demand is down 6%, from 968 to 907. The Expected Market Time is 93 days, compared to 98 days a year ago. The 114-day attached home market is considerably slower than the 93-day detached home market. It is taking 21 days longer, three additional weeks, to sell condominiums versus detached houses. The gap has increased strikingly this year.
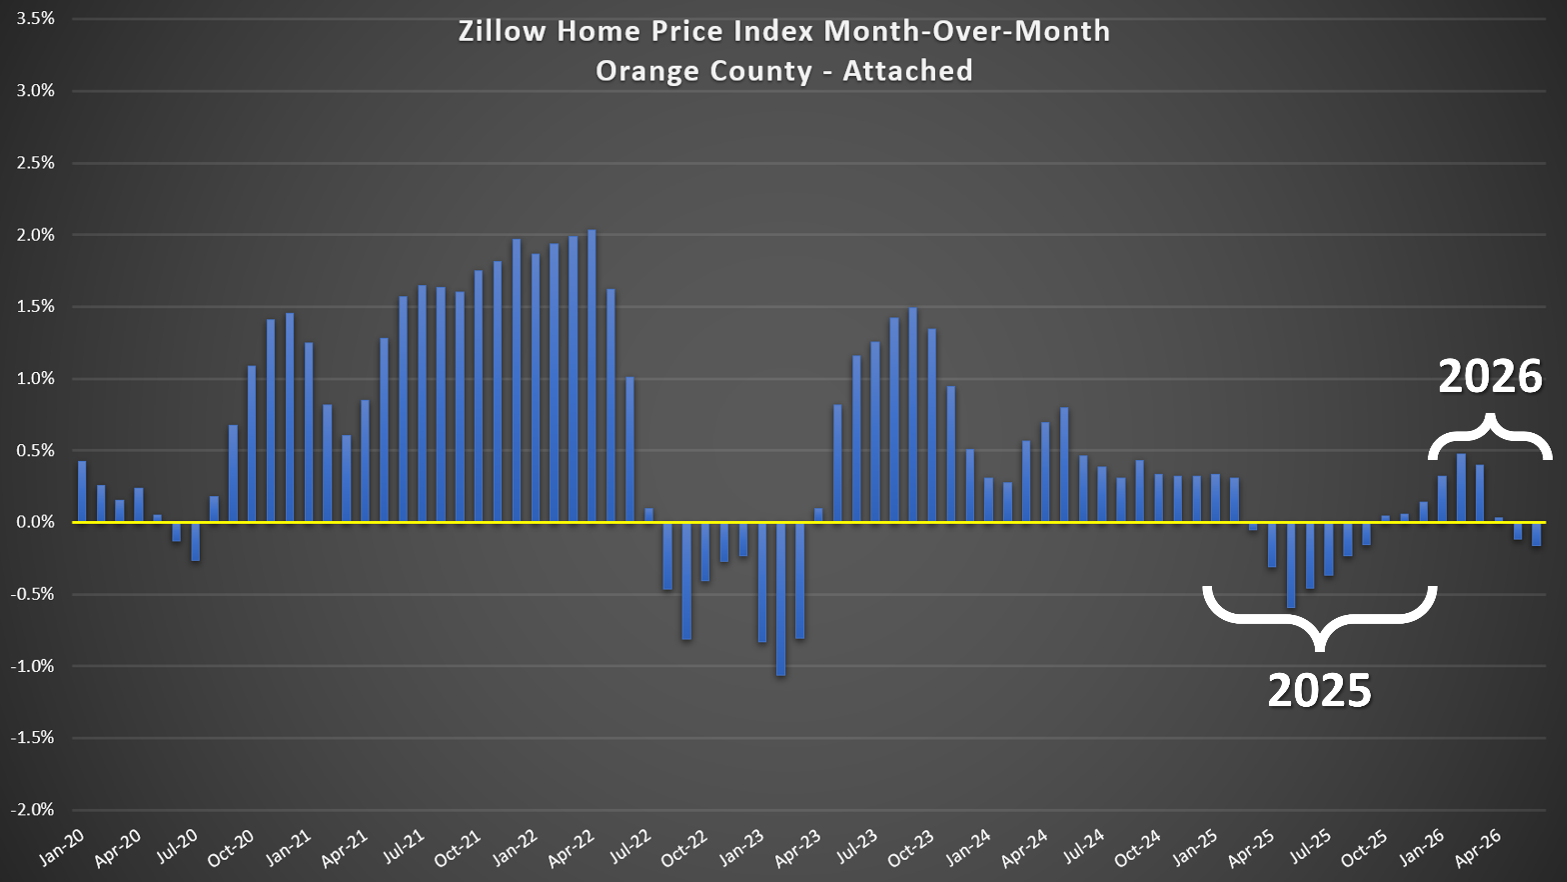
With longer market times, negotiations for attached properties are leaning towards buyers, resulting in declining values for the past couple of months, dropping from $762,489 to $760,391 (-0.3%). At the same time, detached home values have risen from $1,303,939 to $1,305,471 (+0.1%). Year over year, attached homes are up 0.4%, a $3,371 increase. Detached homes are up 1.9% from last year, a $23,746 increase.
As the entry point for many first-time buyers, higher rates are now having a larger impact on attached buyer demand due to rate sensitivity. Mortgage rates are 6.82% today compared to 6% at the end of February. Rates had been below 6.5% from September 3rd of last year through the first few weeks of March, which boosted demand and increased affordability. With the threat of inflation due to the Iran conflict, mortgage rates popped above 6.5% in March and, as of last week, reached their highest level since July 2025. Last year, rates were at 6.57% and dropping at the start of August.
Additionally, as of August 3rd, Fannie Mae and Freddie Mac have officially eliminated their streamlined “Limited Review” and “Streamlined Review” processes for established condominium projects. That means that lenders now have to adopt a new process by conducting a more comprehensive review of HOA budgets, reserve funds, building maintenance history, insurance coverage, and delinquency rates. This may result in longer closing timelines and stricter eligibility for condominium complexes.
The “condo conundrum” is that the housing market’s traditional entry point, a stepping stone to homeownership, is becoming increasingly difficult to afford and finance. They remain considerably less expensive than detached homes, but rising HOA dues, underfunded reserves, special assessments, insurance costs, stricter lending requirements, and elevated mortgage rates are eroding that affordability advantage. Buyers are responding with greater caution, causing attached homes to take longer to sell and their values to underperform detached homes.
Active Listings
The inventory increased by 26 in the past couple of weeks.
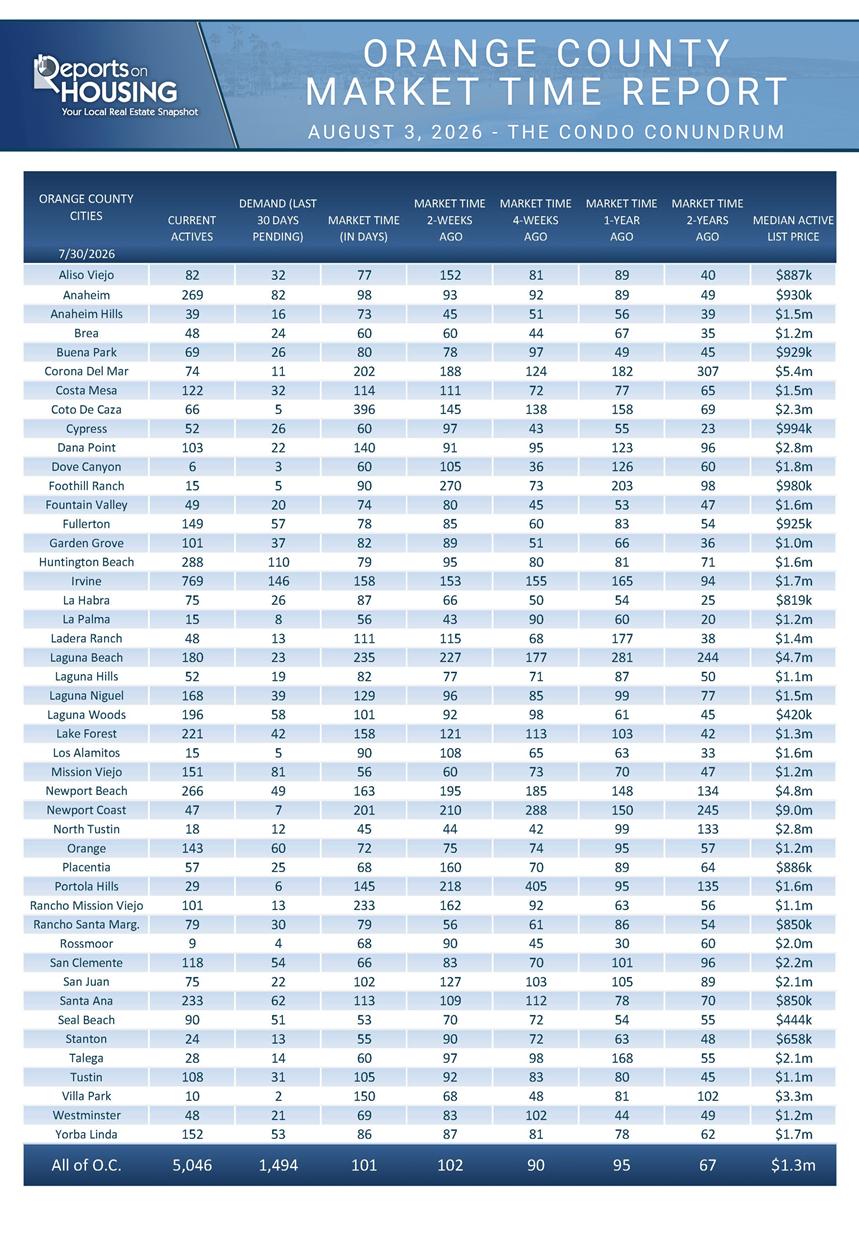
The active listing inventory increased by 26 homes over the past two weeks, up 1%, to 5,046, its highest level since last July. It looks as if the inventory is closely following last year’s trajectory. If that is the case, this end-of-July reading could be the 2026 peak. From here it depends on a combination of the number of homeowners coming to market, any changes in demand, and the number of sellers who pull their homes off the market due to lack of success. It is advisable to watch the inventory readings carefully from here. If a peak is reached sooner, rather than later, the Orange County housing market will stop slowing weekly.
Last year, the inventory was at 5,071 homes, nearly unchanged from today, with 25 additional homes. The 3-year average before COVID (2017 through 2019) was 6,753, an additional 1,707 homes, or 34% more.
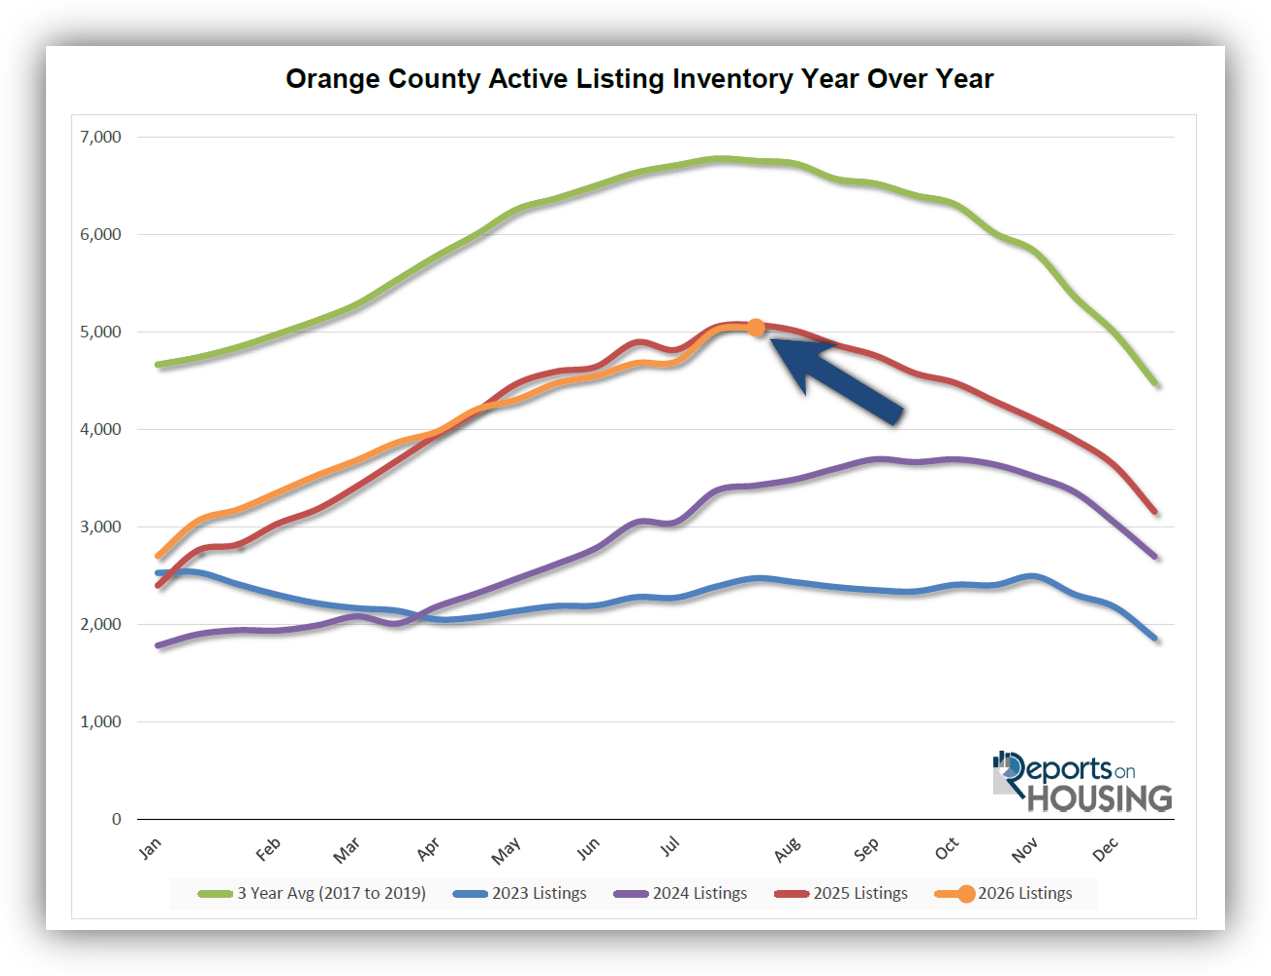
Homeowners continue to “hunker down” in their homes, unwilling to move because of their current, underlying, locked-in, low fixed-rate mortgage. This trend has been easing from the lows established in 2023. Through July, 18,948 homes were placed on the market in Orange County, 6,899 fewer than the 3-year average before COVID (2017-2019), 27% less. In 2025, 19,520 homes entered the market (3% more), compared with 17,052 in 2024 (10% fewer) and 14,616 in 2023 (23% fewer). Slightly fewer homes have been coming to market this year than last.
Demand
Demand increased by 1% in the past couple of weeks.
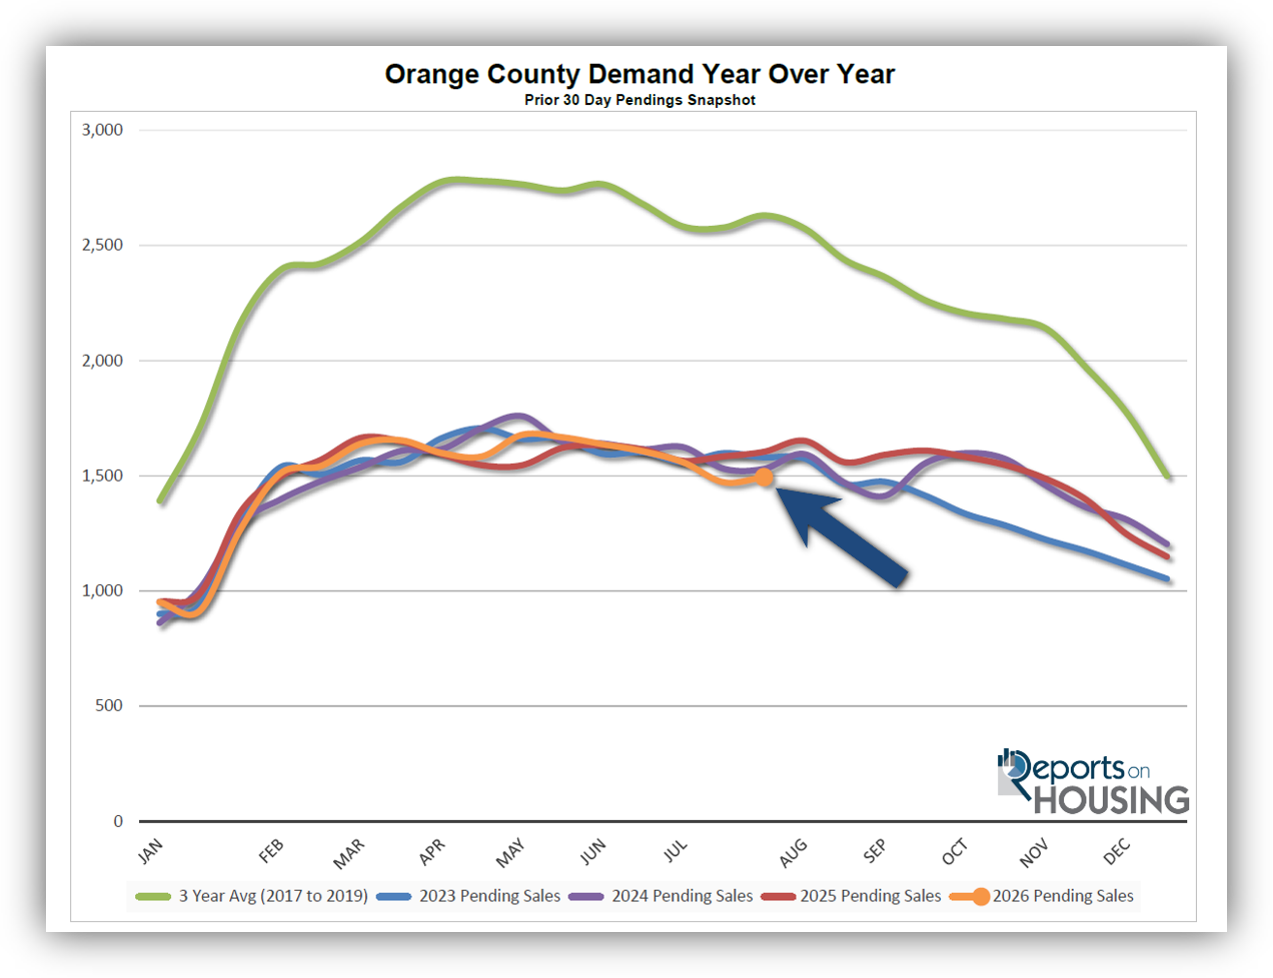
Demand, a snapshot of the number of new pending sales over the prior month, increased from 1,472 to 1,494 in the past couple of weeks, up 22 pending sales, or 1%, its first rise since the start of May. Nonetheless, it is the lowest end of July reading since tracking began in 2004. Demand could slightly increase over the next couple of weeks, as buyers take advantage of the last hurrah of summer before the kids go back to school, and housing transitions to the Autumn Market when demand slowly declines.
Last year, demand was 1,604, with 110 additional pending sales (+7%). The 3-year average before COVID (2017 to 2019) was 2,630 pending sales, 76% more than today, or an additional 1,136.
As the Federal Reserve has indicated, it is essential to monitor all economic releases for signs of a slowdown. These releases can cause mortgage rates to rise or fall, depending on how they compare with market expectations. It is also important to monitor any developments in the Iran conflict and its impact on the oil market, and ultimately inflation, which can also cause mortgage rates to rise or fall. This week is jobs week, which includes the number of job openings, wages, and the number of jobs created or lost, one of the month’s most important economic data points. Next week, the Consumer Price Index (CPI) will be released, a key indicator of inflation, along with retail sales.
Expected Market Time
The Expected Market Time did not change much over the past couple of weeks.
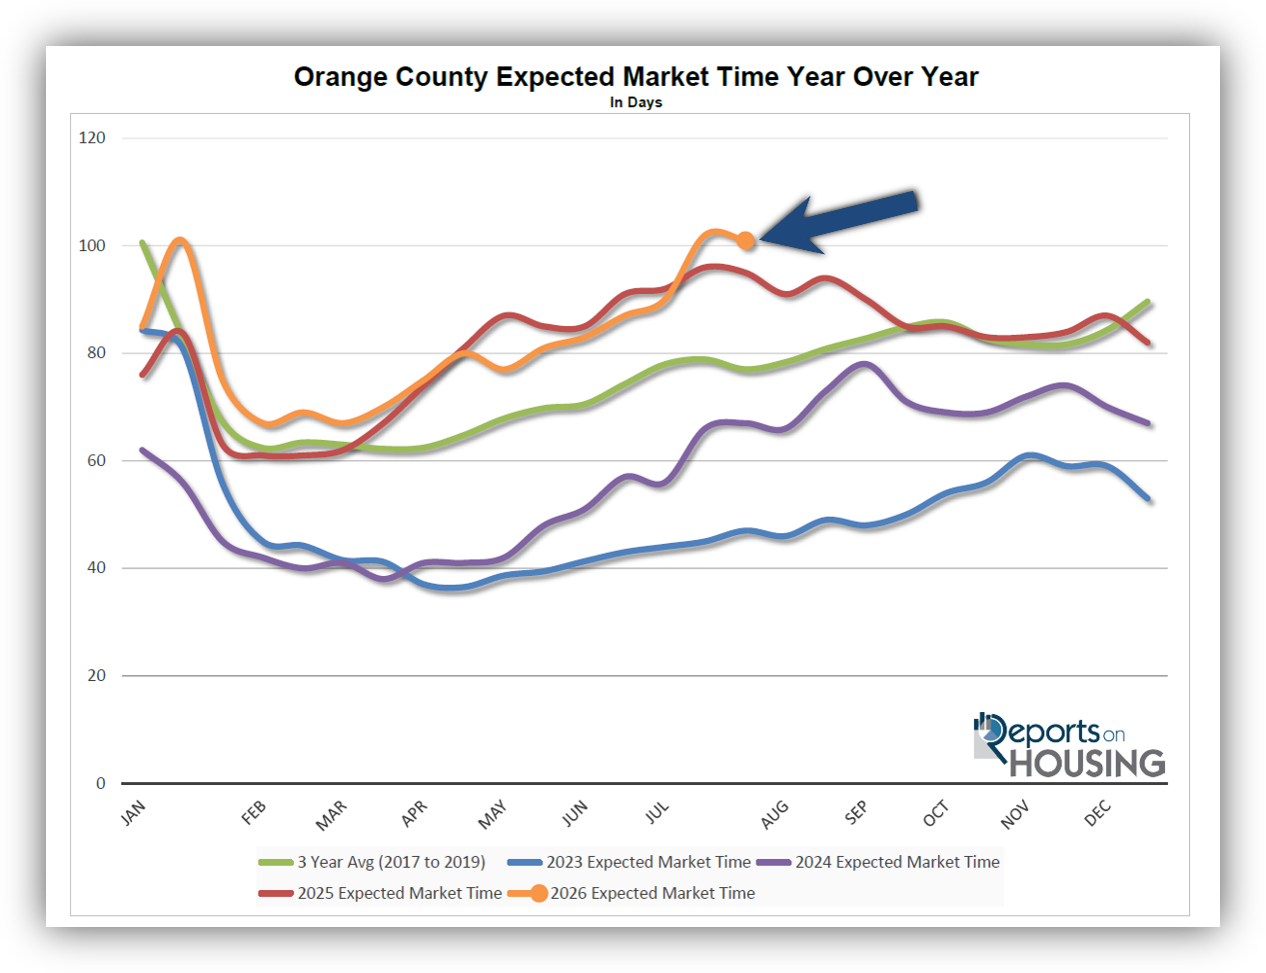
With the supply of available homes rising by 26 homes, up 1%, and demand rising by 22 pending sales, up 1%, the Expected Market Time (the number of days it takes to sell all Orange County listings at the current buying pace) decreased from 102 to 101 days in the past couple of weeks.
Last year, it was 95 days, slightly faster than today. The 3-year average before COVID (2017 to 2019) was 78 days, considerably faster than today.
The Expected Market Time for condominiums and townhomes increased from 112 to 114 days in the past two weeks. It was 90 days last year. For detached homes, the Expected Market Time decreased from 96 to 93 days. It was 98 days a year ago. The detached-home market remains significantly faster than the attached-home market.
Luxury End
The luxury market improved over the past couple of weeks.
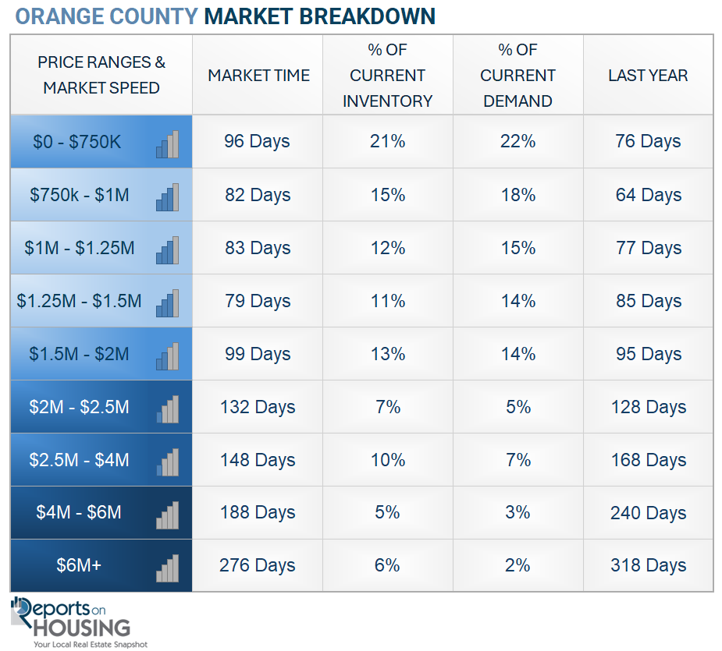
In the past couple of weeks, the luxury inventory of homes priced above $2.5 million (the top 10% of the Orange County housing market) increased from 1,053 to 1,055, a rise of two (+0%). Luxury demand increased from 164 to 175, up 11 (+7%). With supply flat and demand rising, the Expected Market Time for luxury homes priced above $2.5 million decreased from 193 to 181 days. Expect the luxury market to remain sluggish for the remainder of the year.
Year over year, the active luxury inventory is down by 146 homes (-12%), and luxury demand is up by 4 pending sales (+2%). Last year’s Expected Market Time was 211 days, slower than today.
In the past two weeks, the Expected Market Time for homes priced between $2.5 million and $4 million decreased from 151 to 148 days. For homes priced between $4 million and $6 million, the Expected Market Time decreased from 191 to 188 days. For homes priced above $6 million, the Expected Market Time decreased from 341 to 276 days. Luxury is at 181 days overall. At this pace, a seller would be looking at becoming a pending sale around January 2027.
Orange County Housing Summary
- INVENTORY: The active listing inventory in the past couple of weeks increased by 26 homes, up 1%, and now stands at 5,046. Last year, there were 5,071 homes on the market, 25 additional homes, nearly the same as today. The 3-year average before COVID (2017 to 2019) was 6,753, which is 34% higher. From January through July, 27% fewer homes came on the market than the 3-year average before COVID (2017 to 2019), 6,899 fewer. There were 572 fewer than last year, 1,896 more than in 2024, and 4,332 more than in 2023.
- DEMAND: Buyer demand, the number of pending sales over the prior month, increased by 22 in the past two weeks, up 1%, and now stands at 1,494, its first rise since the start of May. Last year, there were 1,604 pending sales, up 7%. The 3-year average before COVID (2017 to 2019) was 2,630, which is 76% higher than today.
- MARKET TIME: With the inventory and demand rising at a similar pace, the Expected Market Time, the number of days to sell all Orange County listings at the current buying pace, decreased from 102 to 101 days in the past couple of weeks. Last year, it was 95 days, slightly faster than today. The 3-year average before COVID (2017-2019) was 78 days, faster than today.
- LUXURY: In the past two weeks, the Expected Market Time for homes priced between $2.5 million and $4 million decreased from 151 to 148 days. For homes priced between $4 million and $6 million, the Expected Market Time decreased from 191 to 188 days. For homes priced above $6 million, the Expected Market Time decreased from 341 to 276 days.
- DISTRESSED HOMES: Short sales and foreclosures combined comprised only 0.2% of all listings and 0.6% of demand. Six foreclosures and four short sales are available today in Orange County, bringing the total of distressed homes on the active market to 10, up two from two weeks ago. Last year, 11 distressed homes were on the market, similar to today.
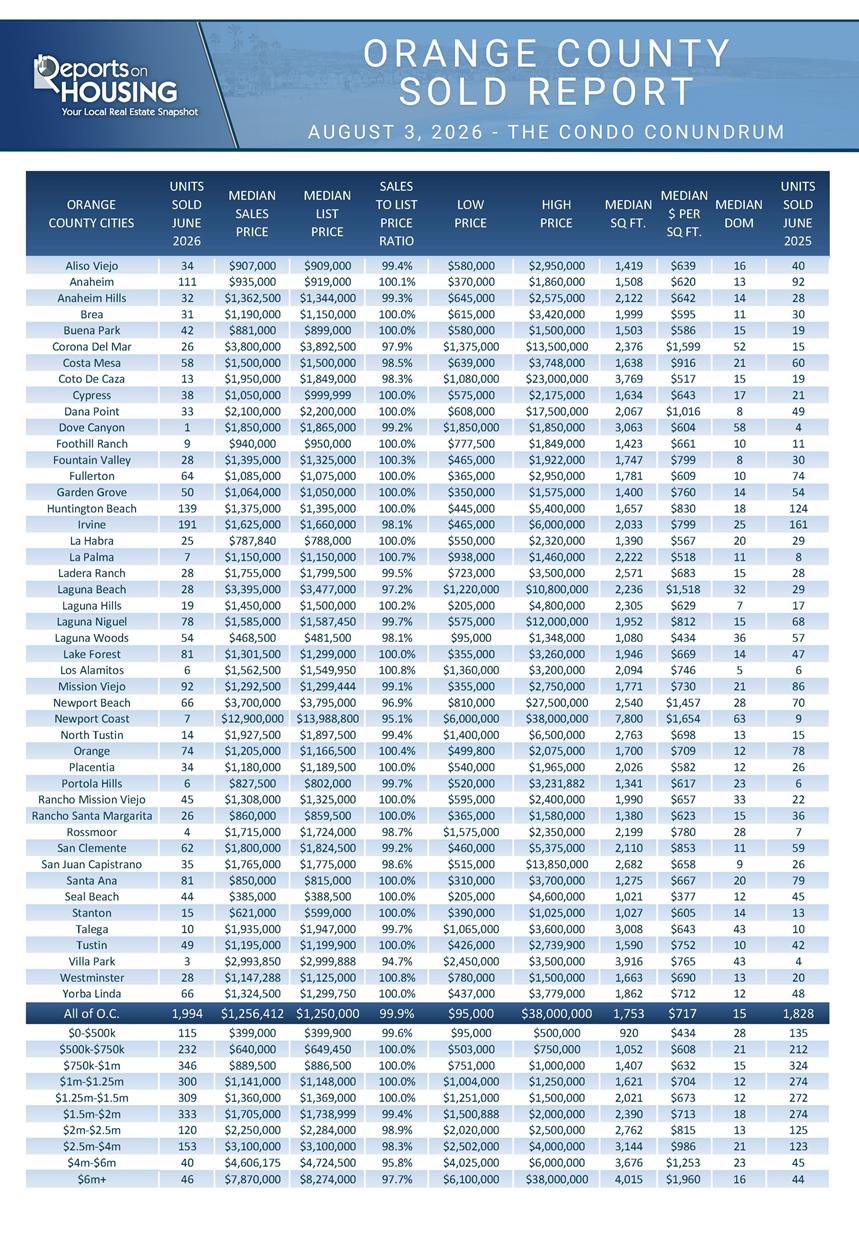
- CLOSED SALES: There were 1,994 closed residential resales in June, up 9% compared to June 2025’s 1,828 sales, and up 10% from May 2026. The sales-to-list price ratio in Orange County was 99.9%. Foreclosures accounted for 0.1% of all closed sales, and short sales accounted for 0.3%. That means that 99.7% of all sales were sellers with equity.
Have a great week.
Sincerely,
Steven Thomas
Quantitative Economics and Decision Sciences
Copyright 2026—Steven Thomas, Reports On Housing—All Rights Reserved. This report may not be reproduced in whole or in part without the author’s express written permission.