April 13, 2026
The Spring Market is in full bloom, the busiest time of the year, yet the housing market slows weekly as the number of homes coming on the market outpaces buyer demand.
The Spring Market
As more homes come on the market, demand peaks and remains flat, and the market time rises during the spring.
Brightly colored tulips are synonymous with spring. The life cycle of a tulip is an annual journey that mostly takes place underground. It relies on colder temperatures that trigger the bulb to start the blooming process. In warmer climates, the bulbs are refrigerated for 8 to 10 weeks to simulate winter freezing, then planted from late November through December. By February, plenty is going on underground as the tulips begin to sprout. The peak colorful blooms arrive in March, just in time for spring.
For the Orange County housing market, the winter season does not need to be simulated. Demand slows tremendously from mid-November through the first couple of weeks of January, the Holiday Market. It is the slowest time of the year. In mid-January, the holidays fade into the Winter Market, when housing begins to sprout. Demand surges higher, and the active inventory can hardly keep up. The Market Time speeds up from week to week, accelerating as more buyers begin their searching process. By late March, the Spring Market arrives in full bloom. Demand reaches its annual peak, and the inventory continues to grow weekly.
It is the Winter Market when housing’s momentum builds, accelerating from week to week. It moves from a crawl to nearly full speed by the time spring arrives. The Spring Market is when demand maintains its strong trajectory while inventory continues to rise rapidly. With demand (a snapshot of the number of new pending sales over the prior month) elevated but no longer rapidly growing, and demand pushing higher and higher, the Expected Market Time (the number of days it takes to sell all Orange County listings at the current buying pace) grows longer each week.
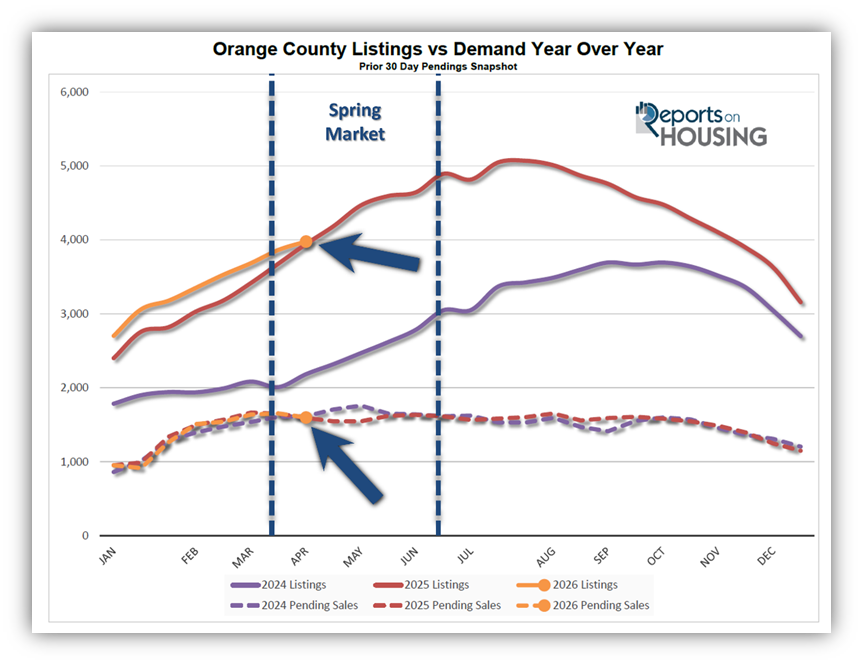
The 2-year average (2024-2025) change in demand from the end of March through the end of June was a decrease from 1,633 pending sales to 1,615, down only 1%, with the annual peaks coming as early as mid-March (last year) to the start of May (2024). At the same time, the 2-year average (2024-2025) change in active inventory from the end of March through the end of June was a revealing 40% increase. Last year, it grew from 3,681 homes to 4,894, up 1,213 or 33%. In 2024, it increased from 2,010 to 3,048, up 1,038 or 52%.
As the inventory climbed higher and demand remained relatively flat, the Expected Market Time increased. Over the past 2 years, the market has slowed by an average of 22 days. Last year, it slowed from 67 days to 91, an increase of 24 days. In 2024, it slowed from 37 days to 57, an increase of 20 days.

Everyone has the misconception that spring is the “hottest time of the year” for real estate. That is true for pending and closed sales, as demand remains elevated but changes little. It translates to plenty of closed sales. But it is not the hottest period in terms of market speed, as measured by the Expected Market Time. That occurs between the very end of February and mid-April. In 2024, the lowest (hottest) reading was 54 days at the end of February. In 2025, the lowest (hottest) reading was 34 days, also in February.
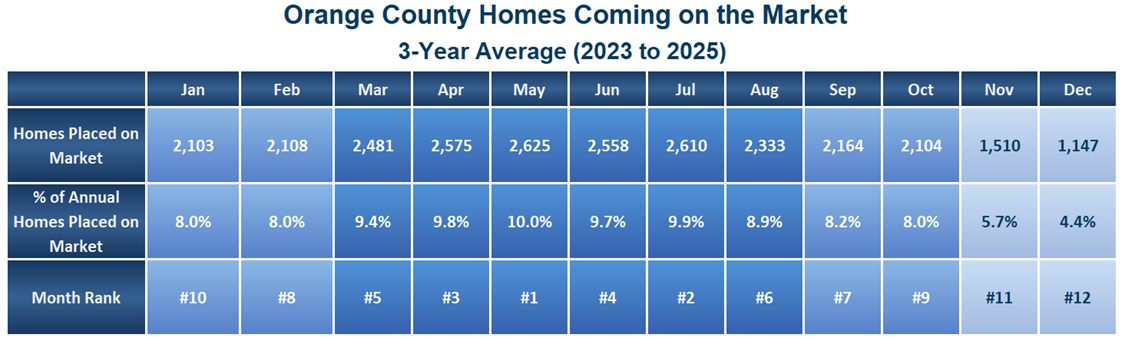
The inventory grows because more homes come on the market in Orange County from March through August. More homes come on the market in May than in any other month, yet April, June, and July are quite similar. With a seasonally high number of homes coming on the market during the Spring and Summer Markets, which matches up with elevated but flat demand, the market slows during the spring and summer.
It is not until the inventory peaks and starts to fall that the market stops slowing, typically occurring between July and August in Orange County (July last year, and September in 2024).
ATTENTION SELLERS: The market slows each week due to increased seller competition. The market is still strong, but it does slow over time. Regardless, the best approach to the housing market is precision pricing, accurately pricing a home based on its true Fair Market Value, taking into consideration location, condition, upgrades, and amenities, and carefully considering all recent comparable closed and pending sales.
ATTENTION BUYERS: Even in a slowing market, accurately priced, well-maintained homes will still fly off the market, fetching prices close to or even above the asking price. It is a great time to be a buyer, with more choices and mortgage rates lower than last year, yet it still boils down to each individual home that is placed on the market and the interest it generates. “Wow” properties, accurately priced with all the bells and whistles, tend to attract multiple offers. Homes that have been lingering on the market and need a little bit of “elbow grease” tend to be more negotiable.
Active Listings
The inventory increased by 3% in the past couple of weeks.
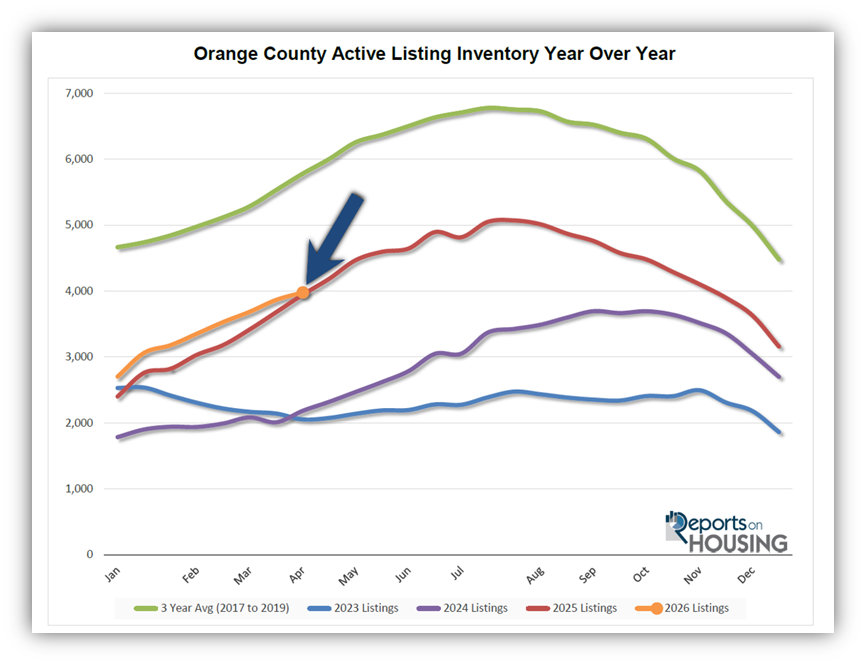
The active listing inventory increased by 113 homes over the past two weeks, up 3%, to 3,979, its smallest rise of the year. The smaller increase is due to a slight drop in the inventory during the Easter week. With the Spring Market in full gear, expect the inventory to continue rising until it peaks sometime between July and August. This is the time of the year when a surge of homes comes on the market, outpacing the number of pending sales.
Last year, the inventory was at 3,945 homes, 1% lower, or 34 fewer. The year-over-year gap continued to narrow over the past couple of weeks. It is almost identical. The 3-year average before COVID (2017 through 2019) was 5,780, an additional 1,801 homes, or 45% more.
Homeowners continue to “hunker down” in their homes, unwilling to move because of their current, underlying, locked-in, low fixed-rate mortgage. This trend has been easing from the lows established in 2023. Through March, 7,661 homes were placed on the market in Orange County, 2,433 fewer than the 3-year average before COVID (2017-2019), 24% less. In 2025, 7,989 homes entered the market (4% more), compared to 6,480 in 2024 (15% less), and 5,608 in 2023 (27% less). Slightly fewer homes have been coming on the market this year compared to last.
Demand
Demand decreased by 33 pending sales in the past couple of weeks.
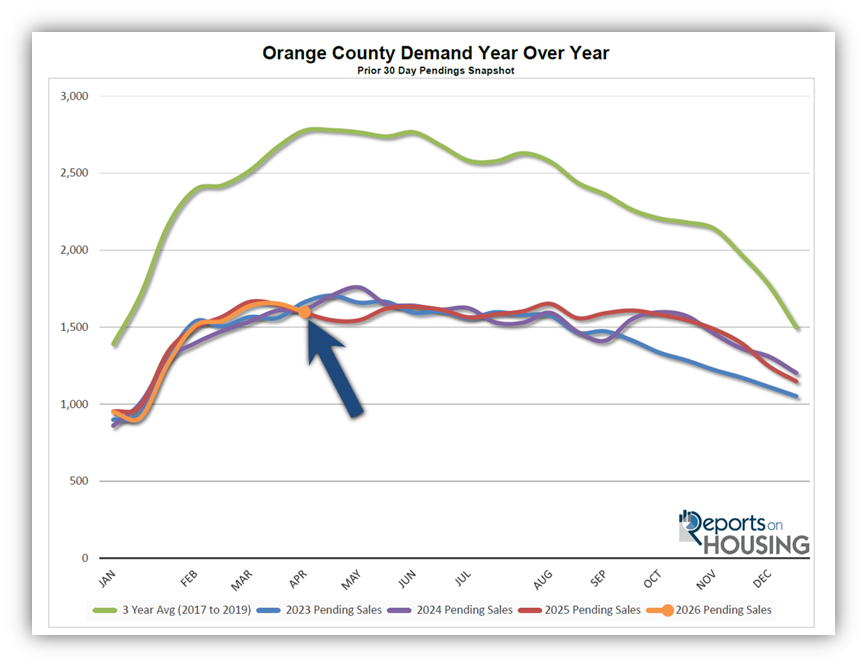
Demand, a snapshot of the number of new pending sales over the prior month, decreased from 1,654 to 1,599 in the past couple of weeks, down 55 pending sales, or 3%. Demand may have peaked a couple of weeks ago. The slowdown could be attributed to Easter week, or it could be that the Orange County housing market has just reached its annual peak in demand a couple of weeks ago.
Last year, demand was 1,594, with 5 fewer pending sales, nearly identical to today. The 3-year average before COVID (2017 to 2019) was 2,777 pending sales, 74% more than today, or an additional 1,178.
As the Federal Reserve has indicated, it is essential to watch all economic releases for signs of slowing. These releases can cause mortgage rates to rise or fall, depending on how they compare with market expectations. It is also important to monitor any developments in the Iran conflict and its impact on the oil market, and ultimately inflation, which can also cause mortgage rates to rise or fall. This week, the Producer Price Index (PPI) will be released, a crucial inflation indicator. Next week, retail sales and the S&P Global Manufacturing and Services Purchasing Managers Index (PMI), which tracks the strength of the U.S. manufacturing and services sectors, will be released.
Expected Market Time
In the past two weeks, the market time has increased by five days.
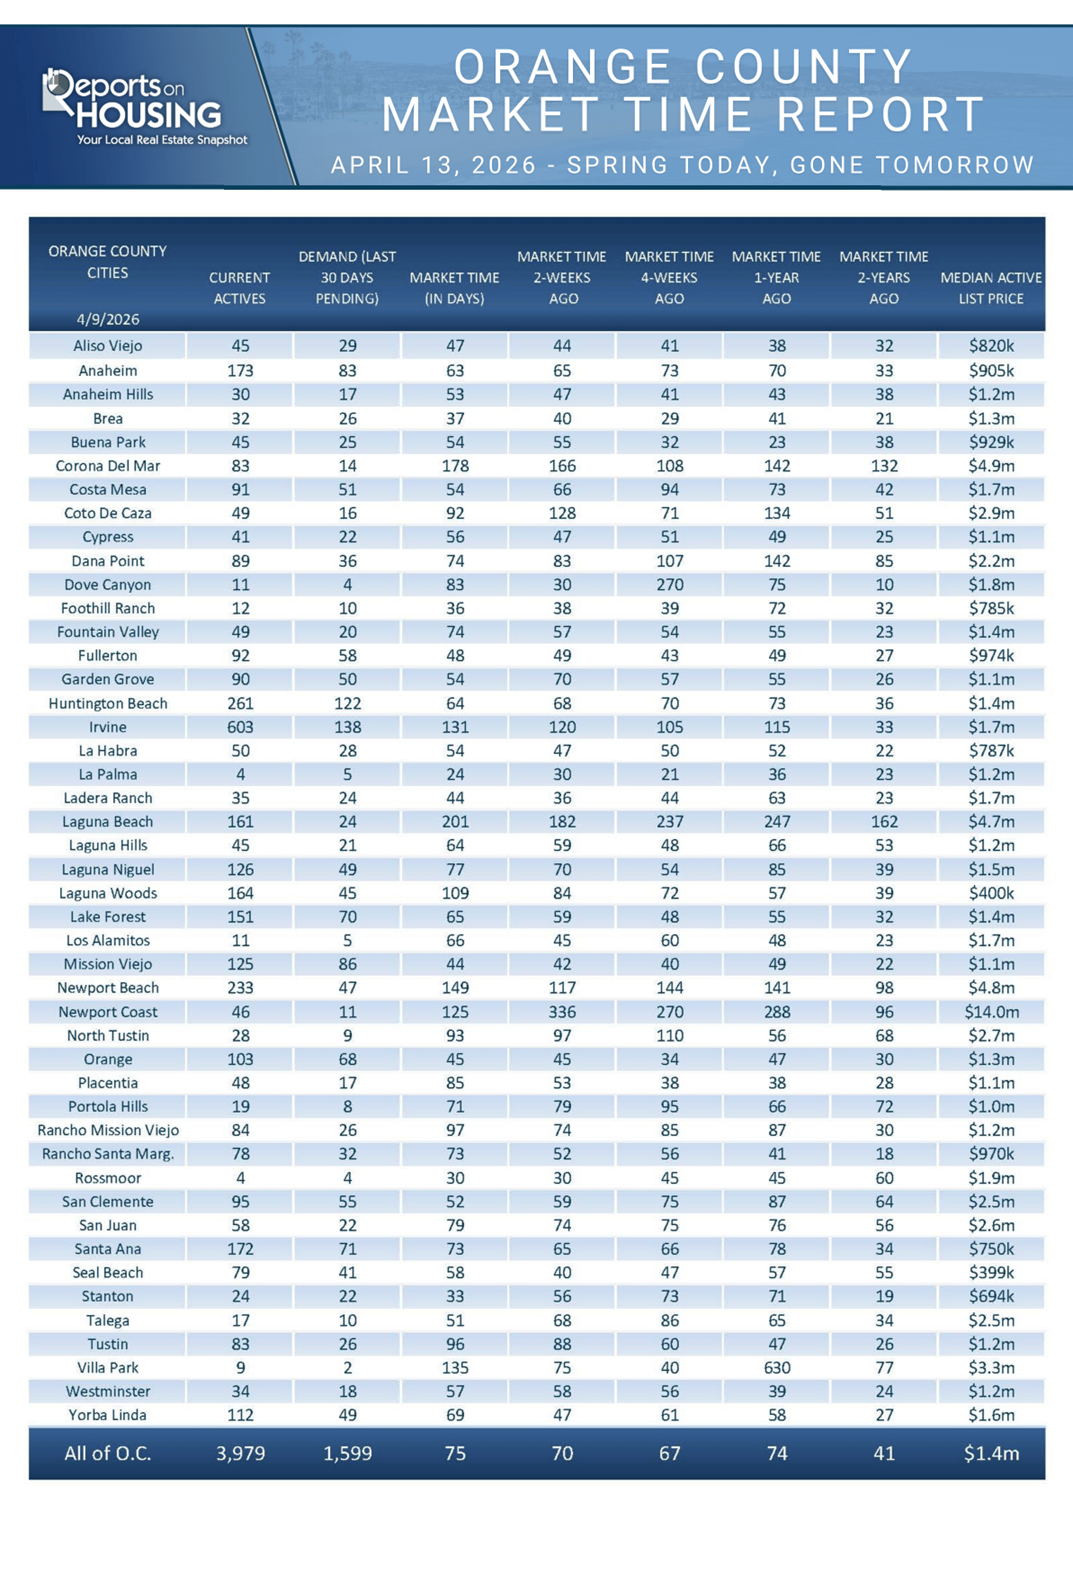
With the supply of available homes rising by 113 homes, up 3%, and demand falling by 55 pending sales, down 3%, the Expected Market Time (the number of days it takes to sell all Orange County listings at the current buying pace) increased from 70 to 75 days in the past couple of weeks, its highest level since the 75 day reading at the end of January.
Last year, it was 74 days, similar to today. The 3-year average before COVID (2017 to 2019) was 62 days, quicker than today.
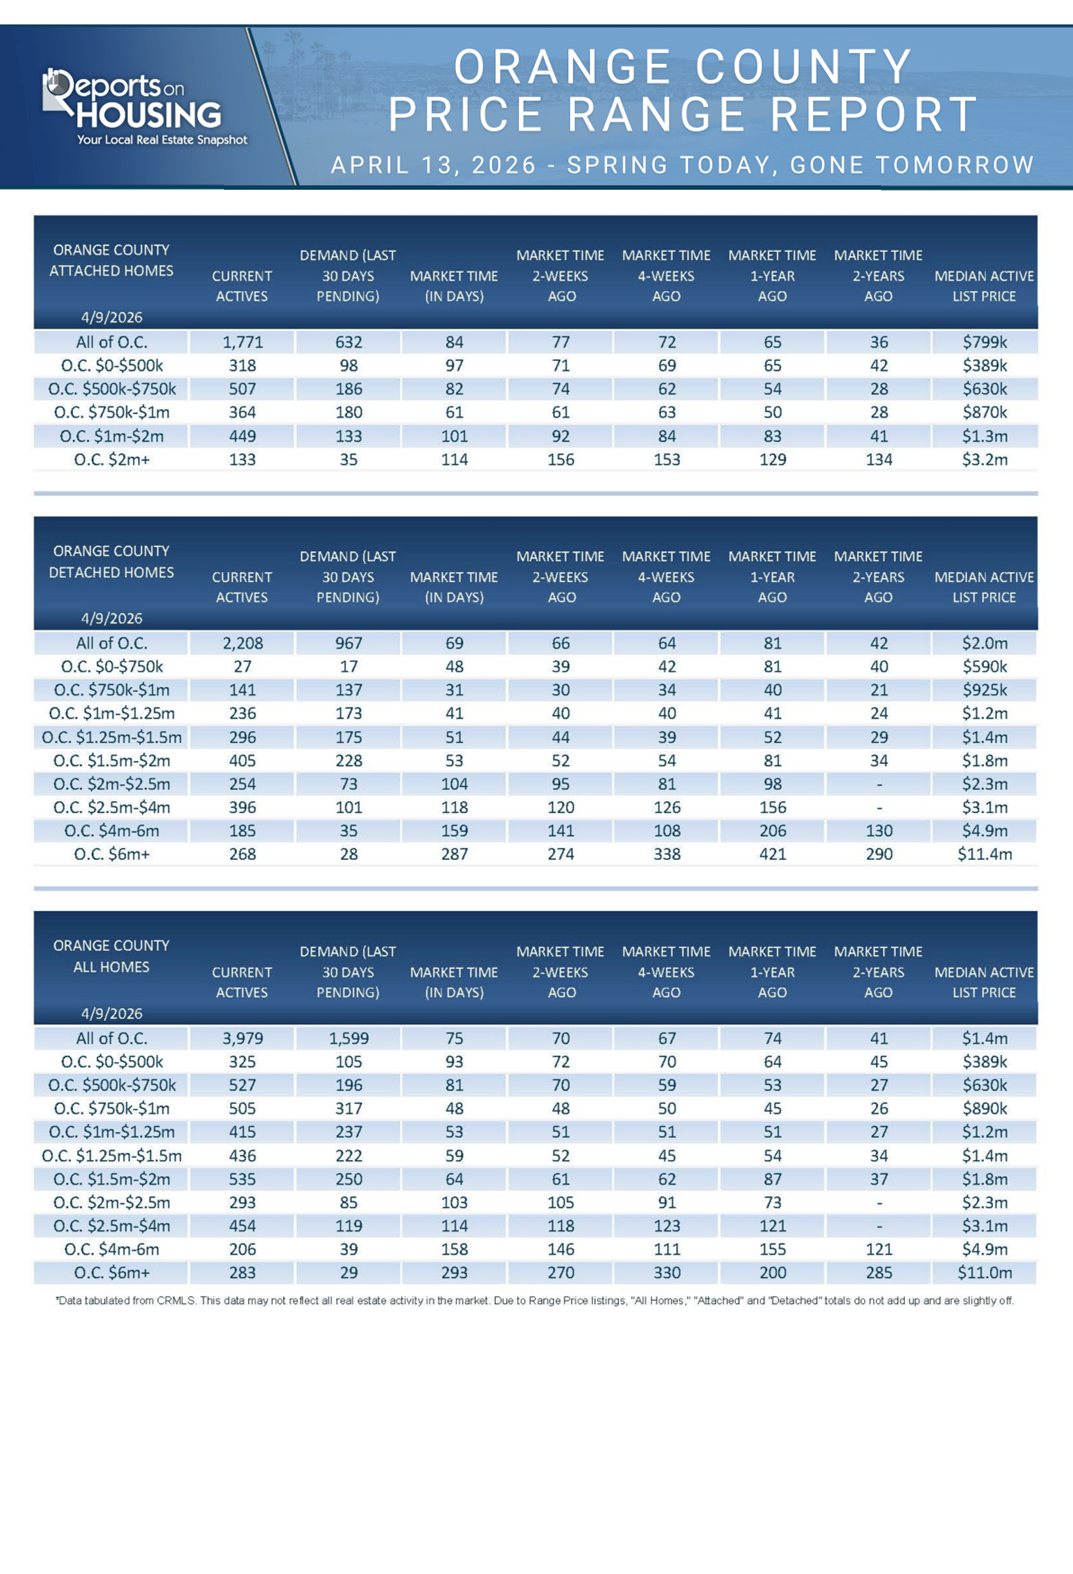
The Expected Market Time for condominiums and townhomes increased from 74 to 77 days in the past two weeks. It was 60 days last year. For detached homes, the Expected Market Time increased from 64 to 67 days. It was 72 days a year ago. The detached-home market is faster than the attached-home market.
Luxury End
The luxury market did not change much over the past couple of weeks.
In the past couple of weeks, the luxury inventory of homes priced above $2.5 million (the top 10% of the Orange County housing market) increased from 937 to 943 homes, up 6 or 1%. Luxury demand decreased by one pending sale, down 1%, to 187. With supply rising slightly and demand falling slightly, the Expected Market Time for luxury homes priced above $2 million increased from 150 to 151 days. Thus far, volatility on Wall Street has not had much effect on luxury. This is typically the hottest time of year for the luxury market, before it slows month to month.
Year over year, the active luxury inventory is down by 163 homes (-15%), and luxury demand is up by 25 pending sales (+15%). Last year’s Expected Market Time was 205 days, slower than today.
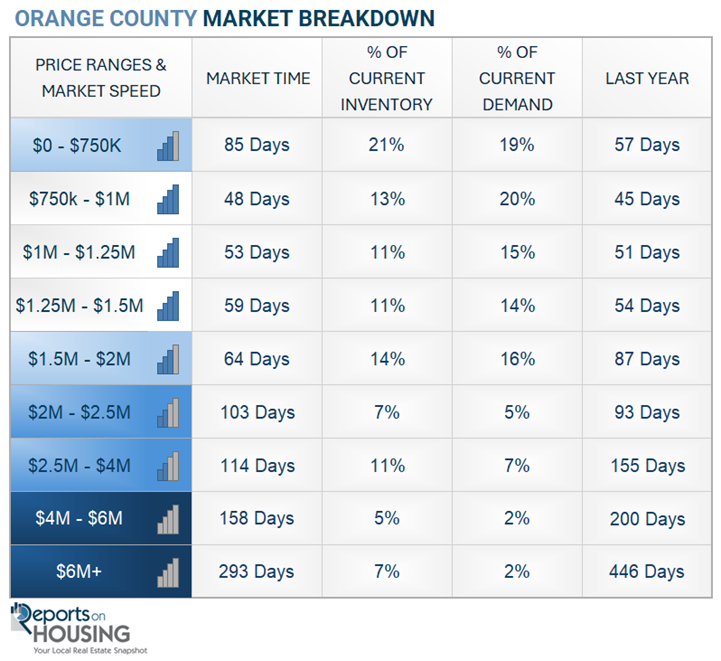
In the past two weeks, the Expected Market Time for homes priced between $2.5 million and $4 million decreased from 118 to 114 days. For homes priced between $4 million and $6 million, the Expected Market Time increased from 146 to 158 days. For homes priced above $6 million, the Expected Market Time increased from 270 to 293 days. Luxury is at 151 days overall. At this pace, a seller would be looking at becoming a pending sale around September 2026.
Orange County Housing Summary
- INVENTORY: The active listing inventory in the past couple of weeks increased by 113 homes, up 3%, and now stands at 3,979. Last year, there were 3,945 homes on the market, 34 fewer homes, or 1% less. The 3-year average before COVID (2017 to 2019) was 5,780, which is 45% higher. From January through March, 24% fewer homes came on the market than the 3-year average before COVID (2017 to 2019), 2,433 fewer. There were 328 fewer than last year, 1,181 more than in 2024, and 2,053 more than in 2023.
- DEMAND: Buyer demand, the number of pending sales over the prior month, decreased by 55 in the past two weeks, down 3%, and now stands at 1,599. It appears that demand may have reached its annual peak a couple of weeks ago. Last year, there were 1,594 pending sales, nearly identical to today. The 3-year average before COVID (2017 to 2019) was 2,777, which is 74% higher.
- MARKET TIME: With supply increasing and demand falling, the Expected Market Time, the number of days to sell all Orange County listings at the current buying pace, increased from 70 to 75 days in the past couple of weeks, its highest reading since 75 days at the end of January. Last year, it was 74 days, similar to today. The 3-year average before COVID (2017-2019) was 62 days, quicker than today.
- LUXURY: In the past two weeks, the Expected Market Time for homes priced between $2.5 million and $4 million decreased from 118 to 114 days. For homes priced between $4 million and $6 million, the Expected Market Time increased from 146 to 158 days. For homes priced above $6 million, the Expected Market Time increased from 270 to 293 days.
- DISTRESSED HOMES: Short sales and foreclosures combined, comprised only 0.3% of all listings and 0.3% of demand. Five foreclosures and five short sales are available today in Orange County, bringing the total of distressed homes on the active market to 10, up 1 from 2 weeks ago. Last year, six distressed homes were on the market, similar to today.
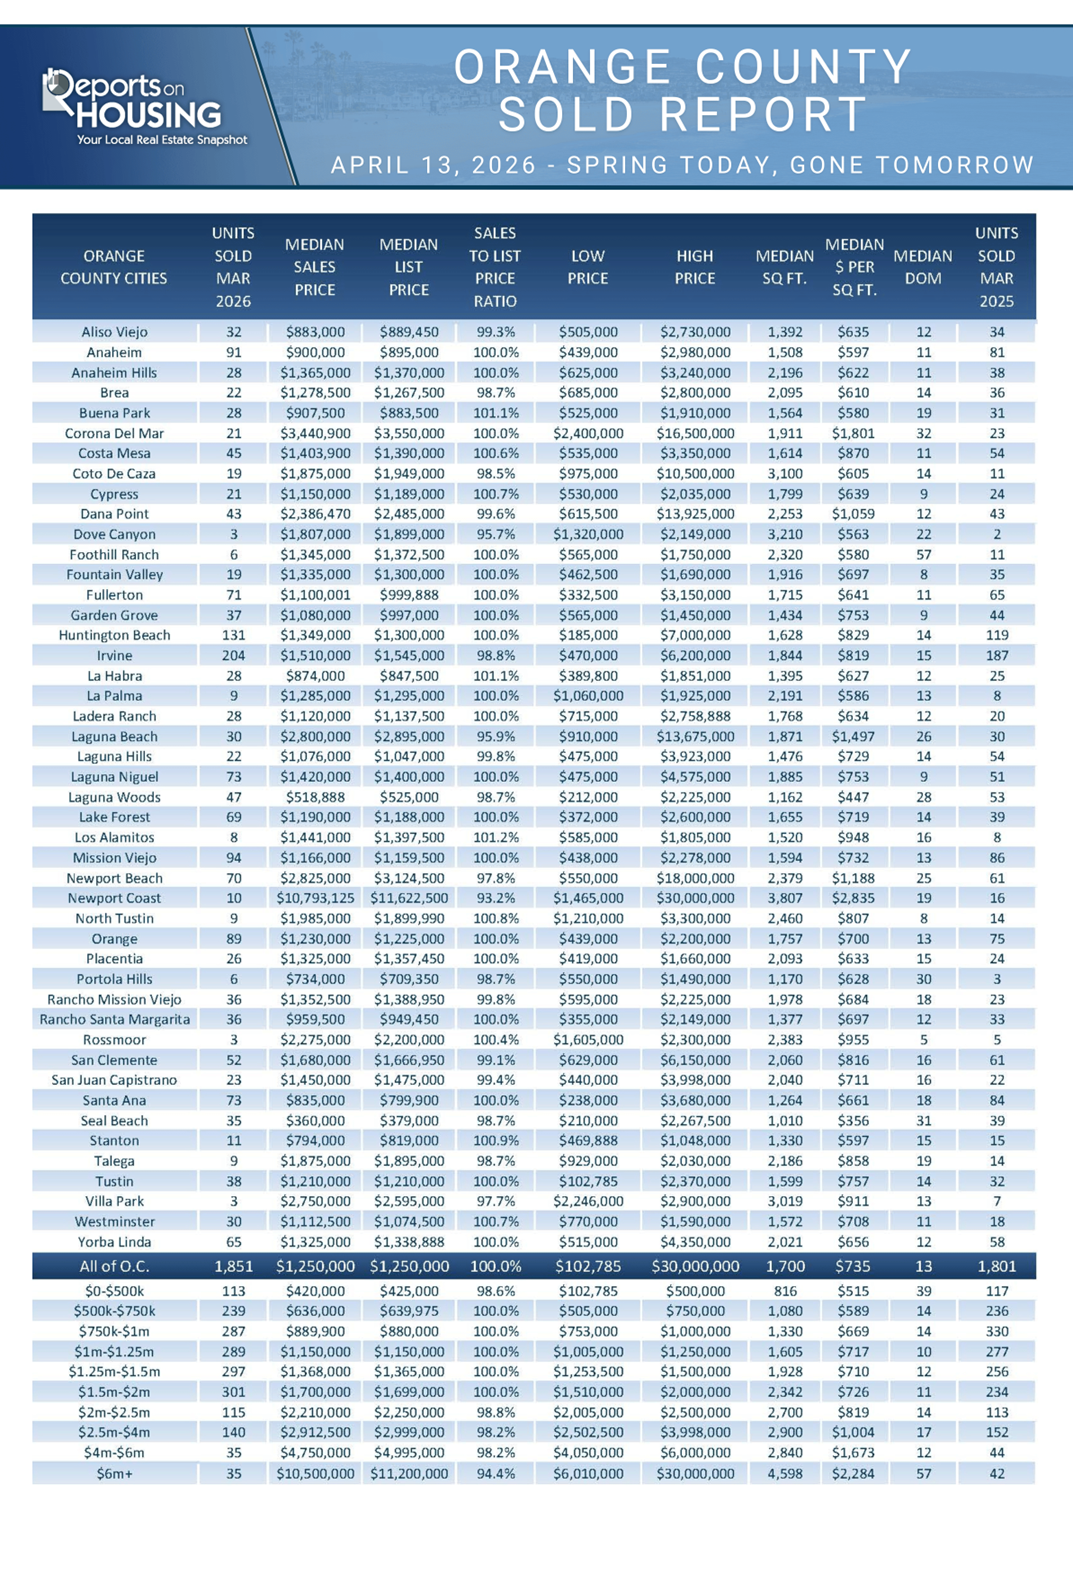
- CLOSED SALES: There were 1,851 closed residential resales in March, up 3% compared to March 2025’s 1,801 sales, and up 36% from February 2026. The sales-to-list price ratio in Orange County was 100.0%. Foreclosures accounted for 0.1% of all closed sales, and there were no short sales. That means that 99.9% of all sales were sellers with equity.
Have a great week.
Sincerely,
Steven Thomas
Quantitative Economics and Decision Sciences
Copyright 2026—Steven Thomas, Reports On Housing—All Rights Reserved. This report may not be reproduced in whole or in part without express written permission from the author.