March 30, 2026
One of the most important steps to successfully approaching today’s housing market is for sellers to arrive at the asking price with meticulous care.
Careful Pricing is Crucial
The data demonstrates that improper pricing results in sellers walking away with less money and much longer market times.
Ticket scalping is not for the faint of heart. The goal is simple: sell tickets for more than what was originally paid, but doing so requires careful, strategic pricing based on supply and demand. When a price is set excessively high and nobody bites, it often has to be adjusted. The longer a scalper holds onto a ticket, the more inclined they are to reduce the price even further. In some cases, their expectations are so unrealistic that on the day of the event, they are forced to slash the price dramatically a few hours beforehand, often below face value, to avoid being left with a worthless ticket.
Similarly, for sellers, careful, strategic pricing is critical in achieving success. Overprice, and a seller languishes on the market due to unrealistic expectations. The longer a home sits on the market, the less fanfare and excitement the home generates.
Today’s buyers are educated and know their specific market. They tap into their favorite app morning, noon, and night, waiting for the next new property to hit the market. As soon as one does, buyers view the virtual tour, they scrutinize the property description, all the details, and every photo, and then they look at the price. They look at the home’s location, condition, upgrades, and amenities, then analyze its asking price. This is a home’s first impression, and sellers only get one shot at it. Based on all these factors, buyers decide whether to tour a home or skip it altogether.
Far too many sellers are initially pricing their homes too high. They are either overzealous, mistakenly believe they need to leave room for negotiations, want to “test” a price, are struggling to remove their emotions from pricing the “family home,” or did not spend enough time methodically arriving at the price. They then have to adjust the asking price to secure a buyer willing to write an offer to purchase. An eye-opening 30% of the active listing inventory has reduced the asking price at least once.
The data reveals that starting overpriced and then reducing it results in a seller walking away with less money. The median sales price to last list price ratio is very revealing. This refers to the final list price before becoming a pending sale. There are always exceptions, but the overall trend is overwhelming. In Orange County, 79% of all closed sales in March did not reduce the asking price. The median sales price to last list price ratio for these homes was 100%, meaning, on average, a home priced appropriately sold at its initial asking price. A house listed at $1 million sold for $1 million. The median days on the market before becoming a pending sale was only 9, demonstrating that accurate pricing also means considerably less time on the market.
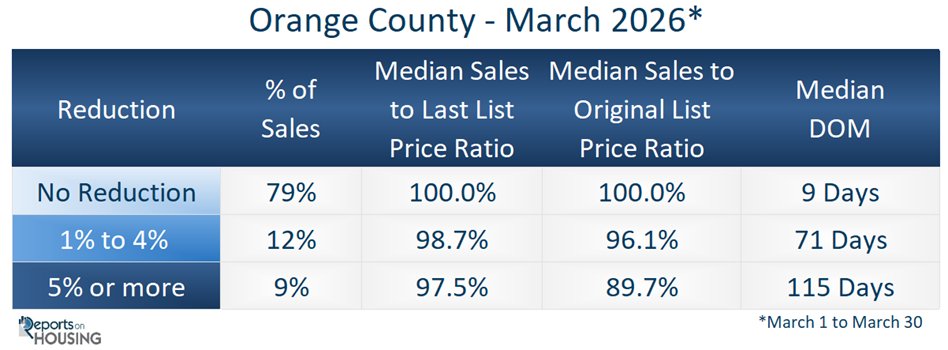
12% of all closed sales reduced their asking prices between 1% and 4%. The sales-to-last list price ratio for these homes was 98.7%; on average, it took 71 days to become a pending sale, or over 2 months. A house that reduced its list price to $1 million sold for $987,000, a substantial $13,000 less than the house that sold for $1 million with no reduction.
For homes that reduced their asking prices by 5% or more, 9% of closed sales in March, the sales-to-last list price ratio was 97.5% after being on the market for 115 days, nearly 4 months. A home that finally reduced its price to $1 million sold for $975,000, an astonishing $25,000 less than the homeowners who did not need to reduce the asking price.
The sales price to original list price ratio reveals the difference between a home’s original asking price and the value buyers are ultimately willing to pay. This is the price of a home when it initially comes on the market before any price reductions. For homes that reduced their asking price by 1% to 4%, the sales price-to-original list price ratio was 96.1%. For example, a house initially listed at $1,027,000 had to reduce the asking price to $1 million to secure success and ultimately sold for $987,000, an astonishing $40,000 less than the original price.
Homes that reduced their asking price by at least 5% had a sales-to-original-list-price ratio of 89.7%. A house initially listed at $1,087,000 had to lower the asking price, often more than once, to $1 million to find success, and ultimately sold for $975,000. That is an overwhelming $112,000 less than the original asking price.
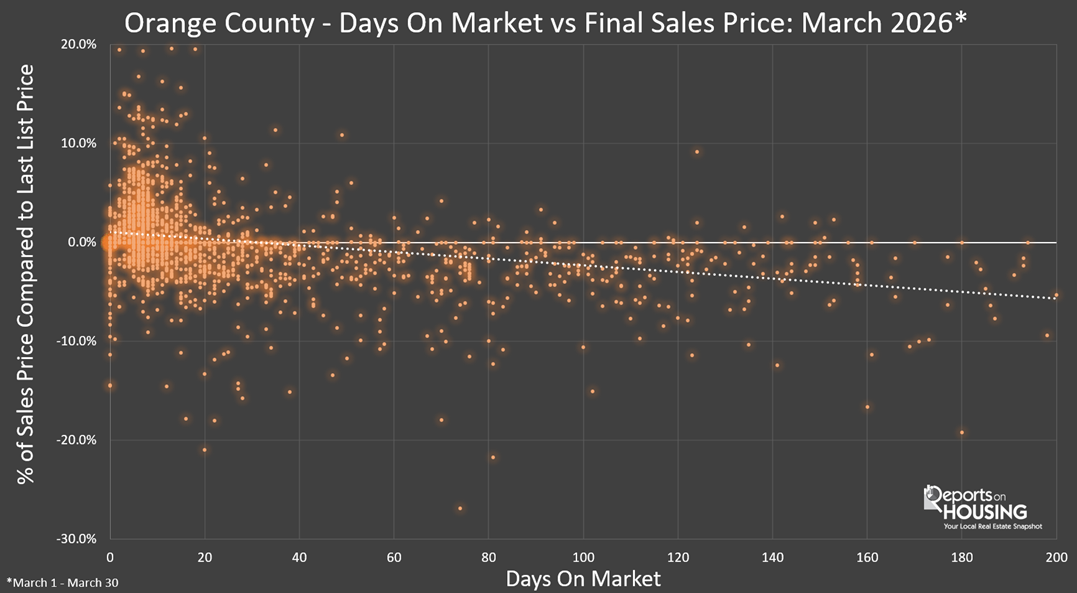
Homes that linger on the market generate less interest or activity and become “market worn.” The scatter chart below shows what happens to homes as they linger on the market. An enlightening 50% of all homes that sold within the first three weeks closed above their asking price. It dropped to 8% for homes that had been on the market for over 2 months. Homeowners who painstakingly arrived at the asking price had a substantially higher probability of selling quickly, very close to their price, and often at or above it. Sellers who were exposed to the market for a long time ultimately had to adjust the price and, for the most part, accepted an offer below their final list price. The dotted line represents the trend line, illustrating how a home’s final sales price typically drops as it sits on the market longer.
Precision pricing is the most important factor in securing the most successful outcome for sellers. Sellers who scrutinize every recent comparable closed and pending sale, carefully weighing the pros and cons, and contrasting a home’s condition, upgrades, location, and amenities, will ultimately arrive at the Fair Market Value, the most probable price the market is willing to pay for a home. This tactical approach to today’s housing market will enable sellers to walk away with the most amount of money possible, the ultimate goal in selling.
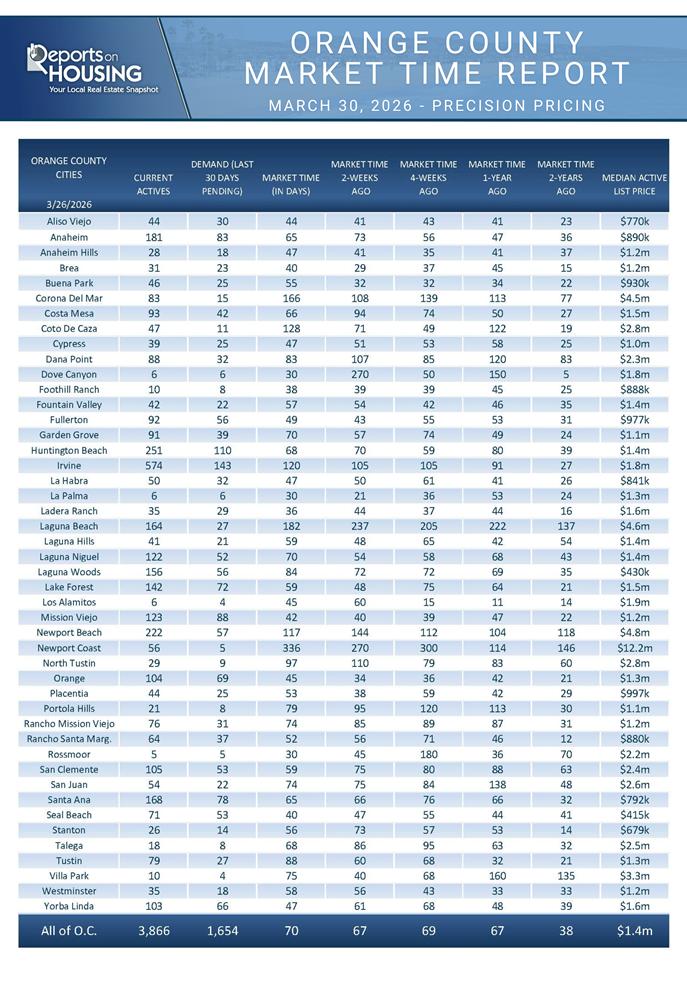
Active Listings
The inventory increased by 5% in the past couple of weeks.
The active listing inventory increased by 179 homes over the past two weeks, up 5%, to 3,866. The Spring Market has arrived. More homes are placed on the market during the spring than any other season of the year. May is the top month for new sellers. The inventory will grow from week to week until it reaches a peak, typically during the summer between July and August. Many homeowners mistakenly think the market continues to heat up each week during spring. In fact, the market slows weekly during the Spring and Summer Markets due to increased seller competition.
Last year, the inventory was at 3,681 homes, 5% lower, or 185 fewer. The year-over-year gap continued to narrow over the past couple of weeks. The 3-year average before COVID (2017 through 2019) was 5,533, an additional 1,667 homes, or 43% more.
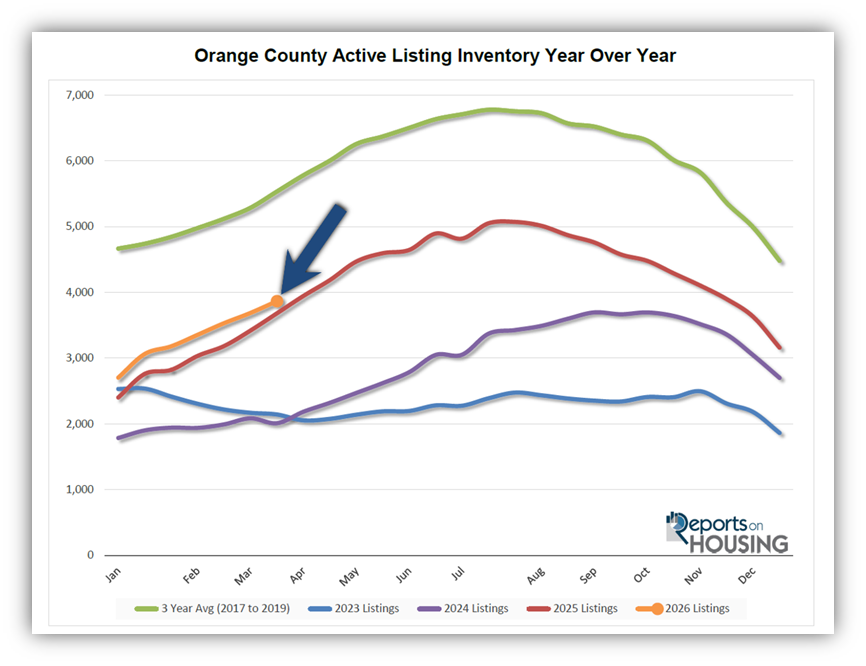
Homeowners continue to “hunker down” in their homes, unwilling to move because of their current, underlying, locked-in, low fixed-rate mortgage. This trend has been easing from the lows established in 2023. Through February, 4,803 homes were placed on the market in Orange County, 1,383 fewer than the 3-year average before COVID (2017-2019), 22% less. In 2025, 5,041 homes entered the market (5% more), compared to 4,119 in 2024 (14% less), and 3,472 in 2023 (40% less). Slightly fewer homes have been coming on the market this year compared to last.
Demand
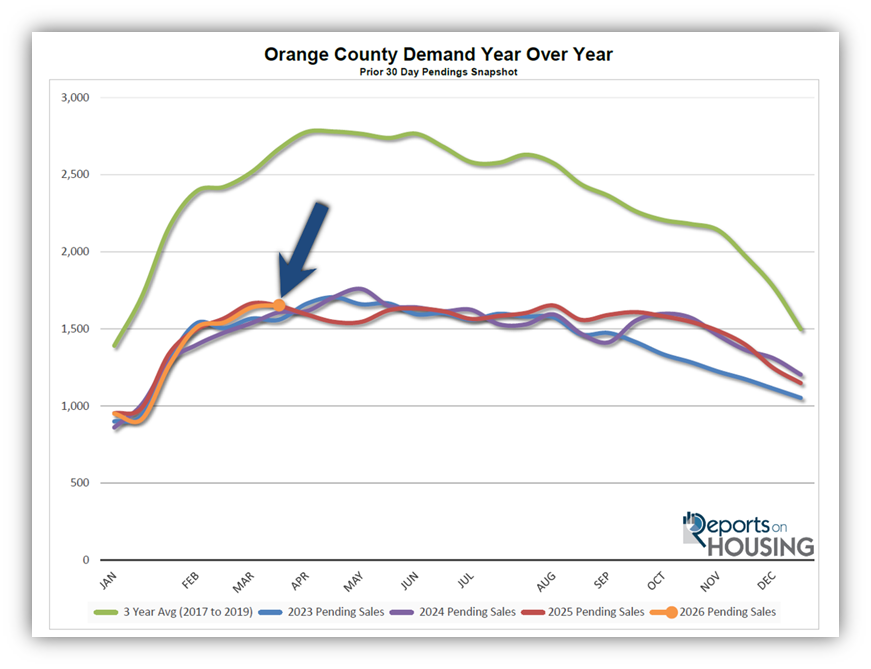
Demand increased by 15 pending sales in the past couple of weeks.
Demand, a snapshot of the number of new pending sales over the prior month, increased from 1,639 to 1,654 in the past couple of weeks, up 15 pending sales, or 1%. It is the highest level since last year’s mid-March peak at 1,665, with only 11 additional pending sales. It appears demand is reaching, or may already have reached, its annual peak. Once the peak is established, demand will drop at an extremely slow rate, appearing nearly flat through September.
Last year, demand was 1,649, with 5 fewer pending sales, nearly identical to today. The 3-year average before COVID (2017 to 2019) was 2,668 pending sales, 61% more than today, or an additional 1,014.
As the Federal Reserve has indicated, it is essential to watch all economic releases for signs of slowing. These releases can cause mortgage rates to rise or fall, depending on how they compare with market expectations. It is also important to monitor any developments in the Iran conflict and its impact on the oil market, and ultimately inflation, which can also cause mortgage rates to rise or fall. This week is jobs week, which includes the number of job openings, wages, and the number of jobs created or lost, one of the month’s most important economic data points. In addition, retail sales will be released. Next week, the Personal Consumption Expenditures – Price Index (PCE) for February, the Fed’s preferred inflation gauge, will be released on Thursday, and the Consumer Price Index (CPI) for March will be released on Friday. It will be a pivotal two weeks for rates.
Expected Market Time
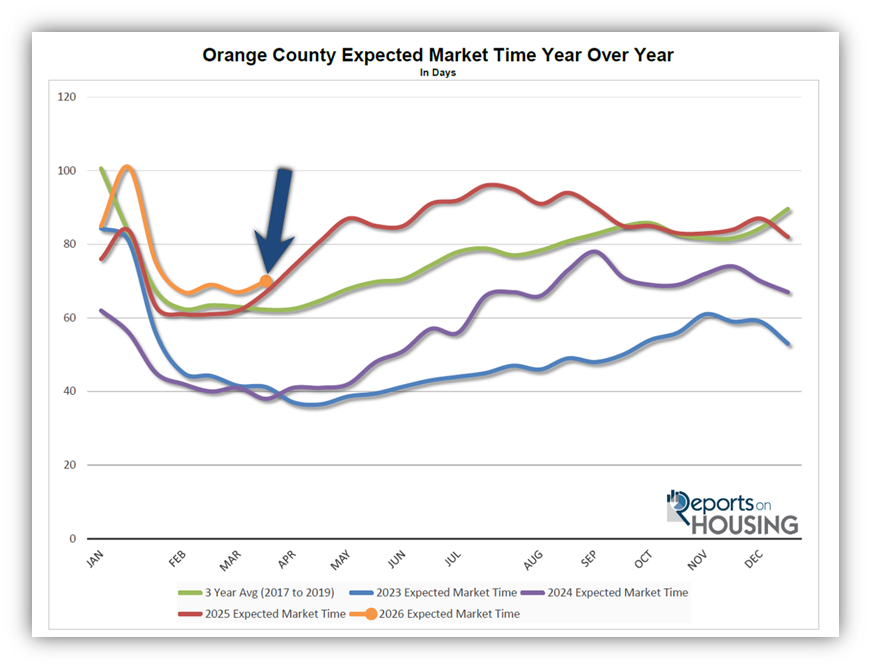
In the past two weeks, the market time has increased by three days.
With the supply of available homes rising by 179 homes, up 5%, and demand rising by 15 pending sales, up 1%, the Expected Market Time (the number of days it takes to sell all Orange County listings at the current buying pace) increased from 67 to 70 days in the past couple of weeks, its highest level since the end of January when it had dropped to 75 days.
Last year, it was 67 days, similar to today. The 3-year average before COVID (2017 to 2019) was 63 days, slightly quicker than today.
The Expected Market Time for condominiums and townhomes increased from 74 to 77 days in the past two weeks. It was 60 days last year. For detached homes, the Expected Market Time increased from 64 to 67 days. It was 72 days a year ago. The detached-home market is faster than the attached-home market.
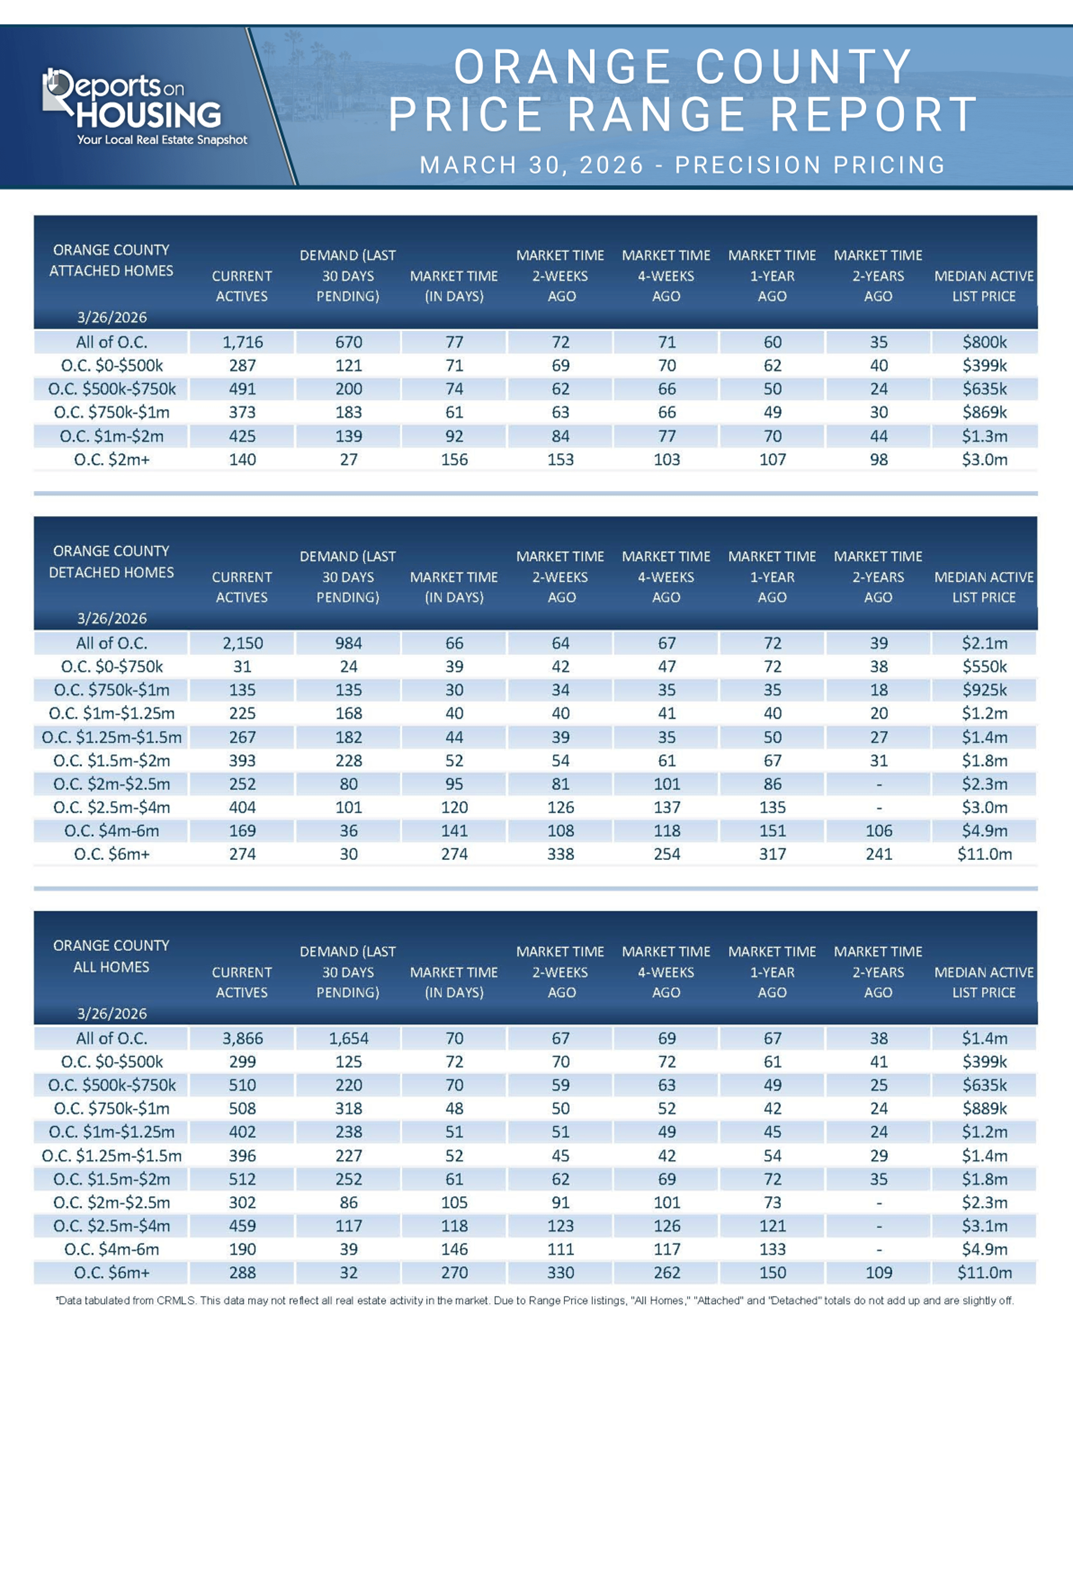
Luxury End
The luxury market remained unchanged over the past couple of weeks.
In the past couple of weeks, the luxury inventory of homes priced above $2.5 million (the top 10% of the Orange County housing market) increased from 900 to 937 homes, up 37 or 4%. Luxury demand increased by 8 pending sales, up 4%, to 188, its highest level since last May. With supply and demand rising at a similar pace, the Expected Market Time for luxury homes priced above $2 million remained unchanged at 150 days. With increased economic uncertainty, the luxury market could slow from here.
Year over year, the active luxury inventory is down by 101 homes (10%), and luxury demand is unchanged. Last year’s Expected Market Time was 166 days, slightly slower than today.
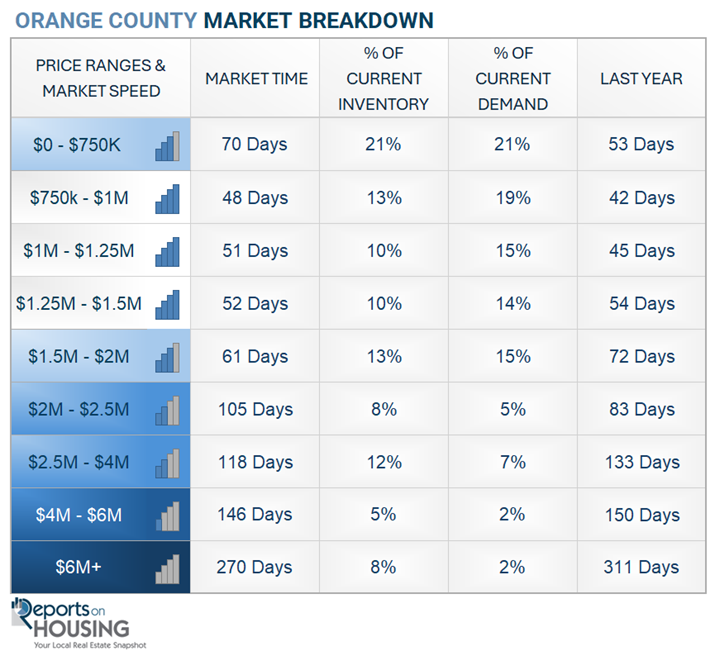
In the past two weeks, the Expected Market Time for homes priced between $2.5 million and $4 million decreased from 123 to 118 days. For homes priced between $4 million and $6 million, the Expected Market Time increased from 111 to 146 days. For homes priced above $6 million, the Expected Market Time decreased from 330 to 270 days. Luxury is at 150 days overall. At this pace, a seller would be looking at becoming a pending sale around August 2026.
Orange County Housing Summary
- INVENTORY: The active listing inventory in the past couple of weeks increased by 179 homes, up 5%, and now stands at 3,866. Last year, there were 3,681 homes on the market, 185 fewer homes, or 5% less. The 3-year average before COVID (2017 to 2019) was 5,533, which is 43% higher. From January through February, 22% fewer homes came on the market than the 3-year average before COVID (2017 to 2019), 1,383 fewer. There were 238 fewer than last year, 684 more than in 2024, and 1,331 more than in 2023.
- DEMAND: Buyer demand, the number of pending sales over the prior month, increased by 15 in the past two weeks, up 1%, and now stands at 1,654. It appears as if demand may be reaching, or may have reached, its annual peak. Last year, there were 1,649 pending sales, nearly identical to today. The 3-year average before COVID (2017 to 2019) was 2,668, which is 61% higher.
- MARKET TIME: With supply increasing much faster than demand, the Expected Market Time, the number of days to sell all Orange County listings at the current buying pace, increased from 67 to 70 days in the past couple of weeks, its highest level since the end of January. Last year, it was 67 days, similar to today. The 3-year average before COVID (2017-2019) was 63 days, slightly quicker than today.
- LUXURY: In the past two weeks, the Expected Market Time for homes priced between $2.5 million and $4 million decreased from 123 to 118 days. For homes priced between $4 million and $6 million, the Expected Market Time increased from 111 to 146 days. For homes priced above $6 million, the Expected Market Time decreased from 330 to 270 days.
- DISTRESSED HOMES: Short sales and foreclosures combined, comprised only 0.2% of all listings and 0.2% of demand. Four foreclosures and five short sales are available today in Orange County, bringing the total of distressed homes on the active market to nine, up two from two weeks ago. Last year, seven distressed homes were on the market, similar to today.
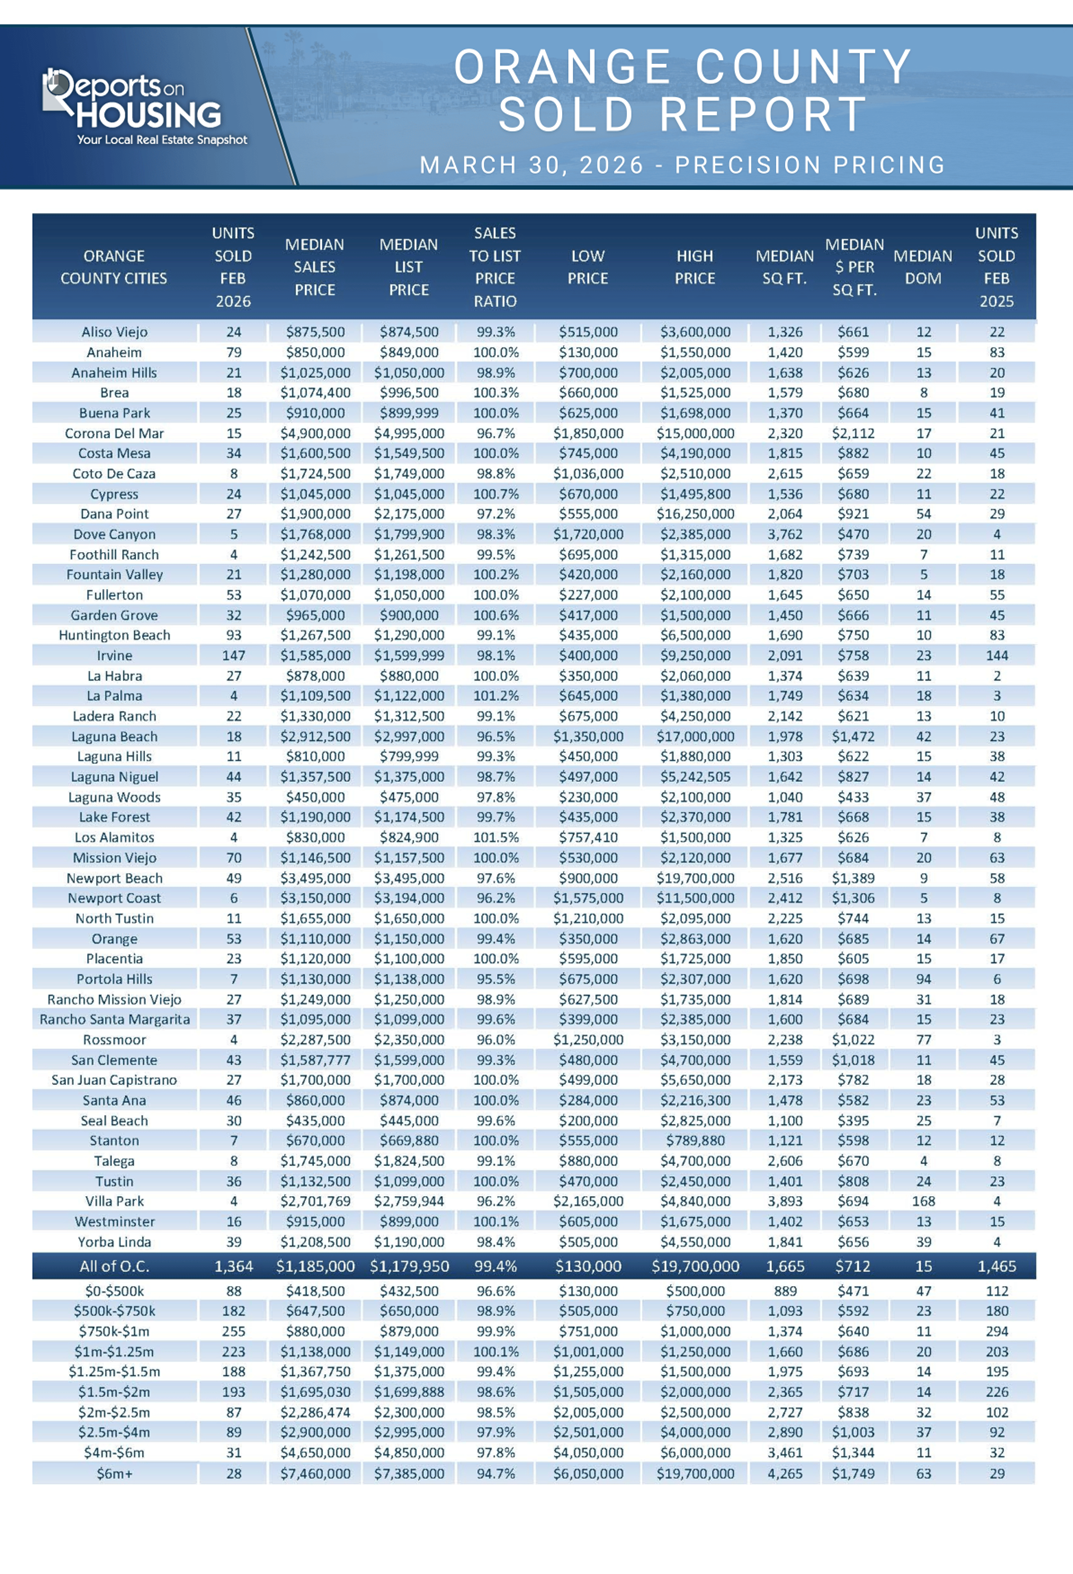
- CLOSED SALES: There were 1,364 closed residential resales in February, down 7% compared to February 2025’s 1,465 sales, and up 12% from January 2026. The sales-to-list price ratio in Orange County was 99.4%. Foreclosures accounted for 0.2% of all closed sales, and there were no short sales. That means that 99.8% of all sales were sellers with equity.
Have a great week.
Sincerely,
Steven Thomas
Quantitative Economics and Decision Sciences
Copyright 2026—Steven Thomas, Reports On Housing—All Rights Reserved. This report may not be reproduced in whole or in part without express written permission from the author.