February 17, 2026
With the spring market right around the corner, homeowners looking to sell must rely on data, statistics, and market trends to set realistic expectations and achieve success.
Relying on Data
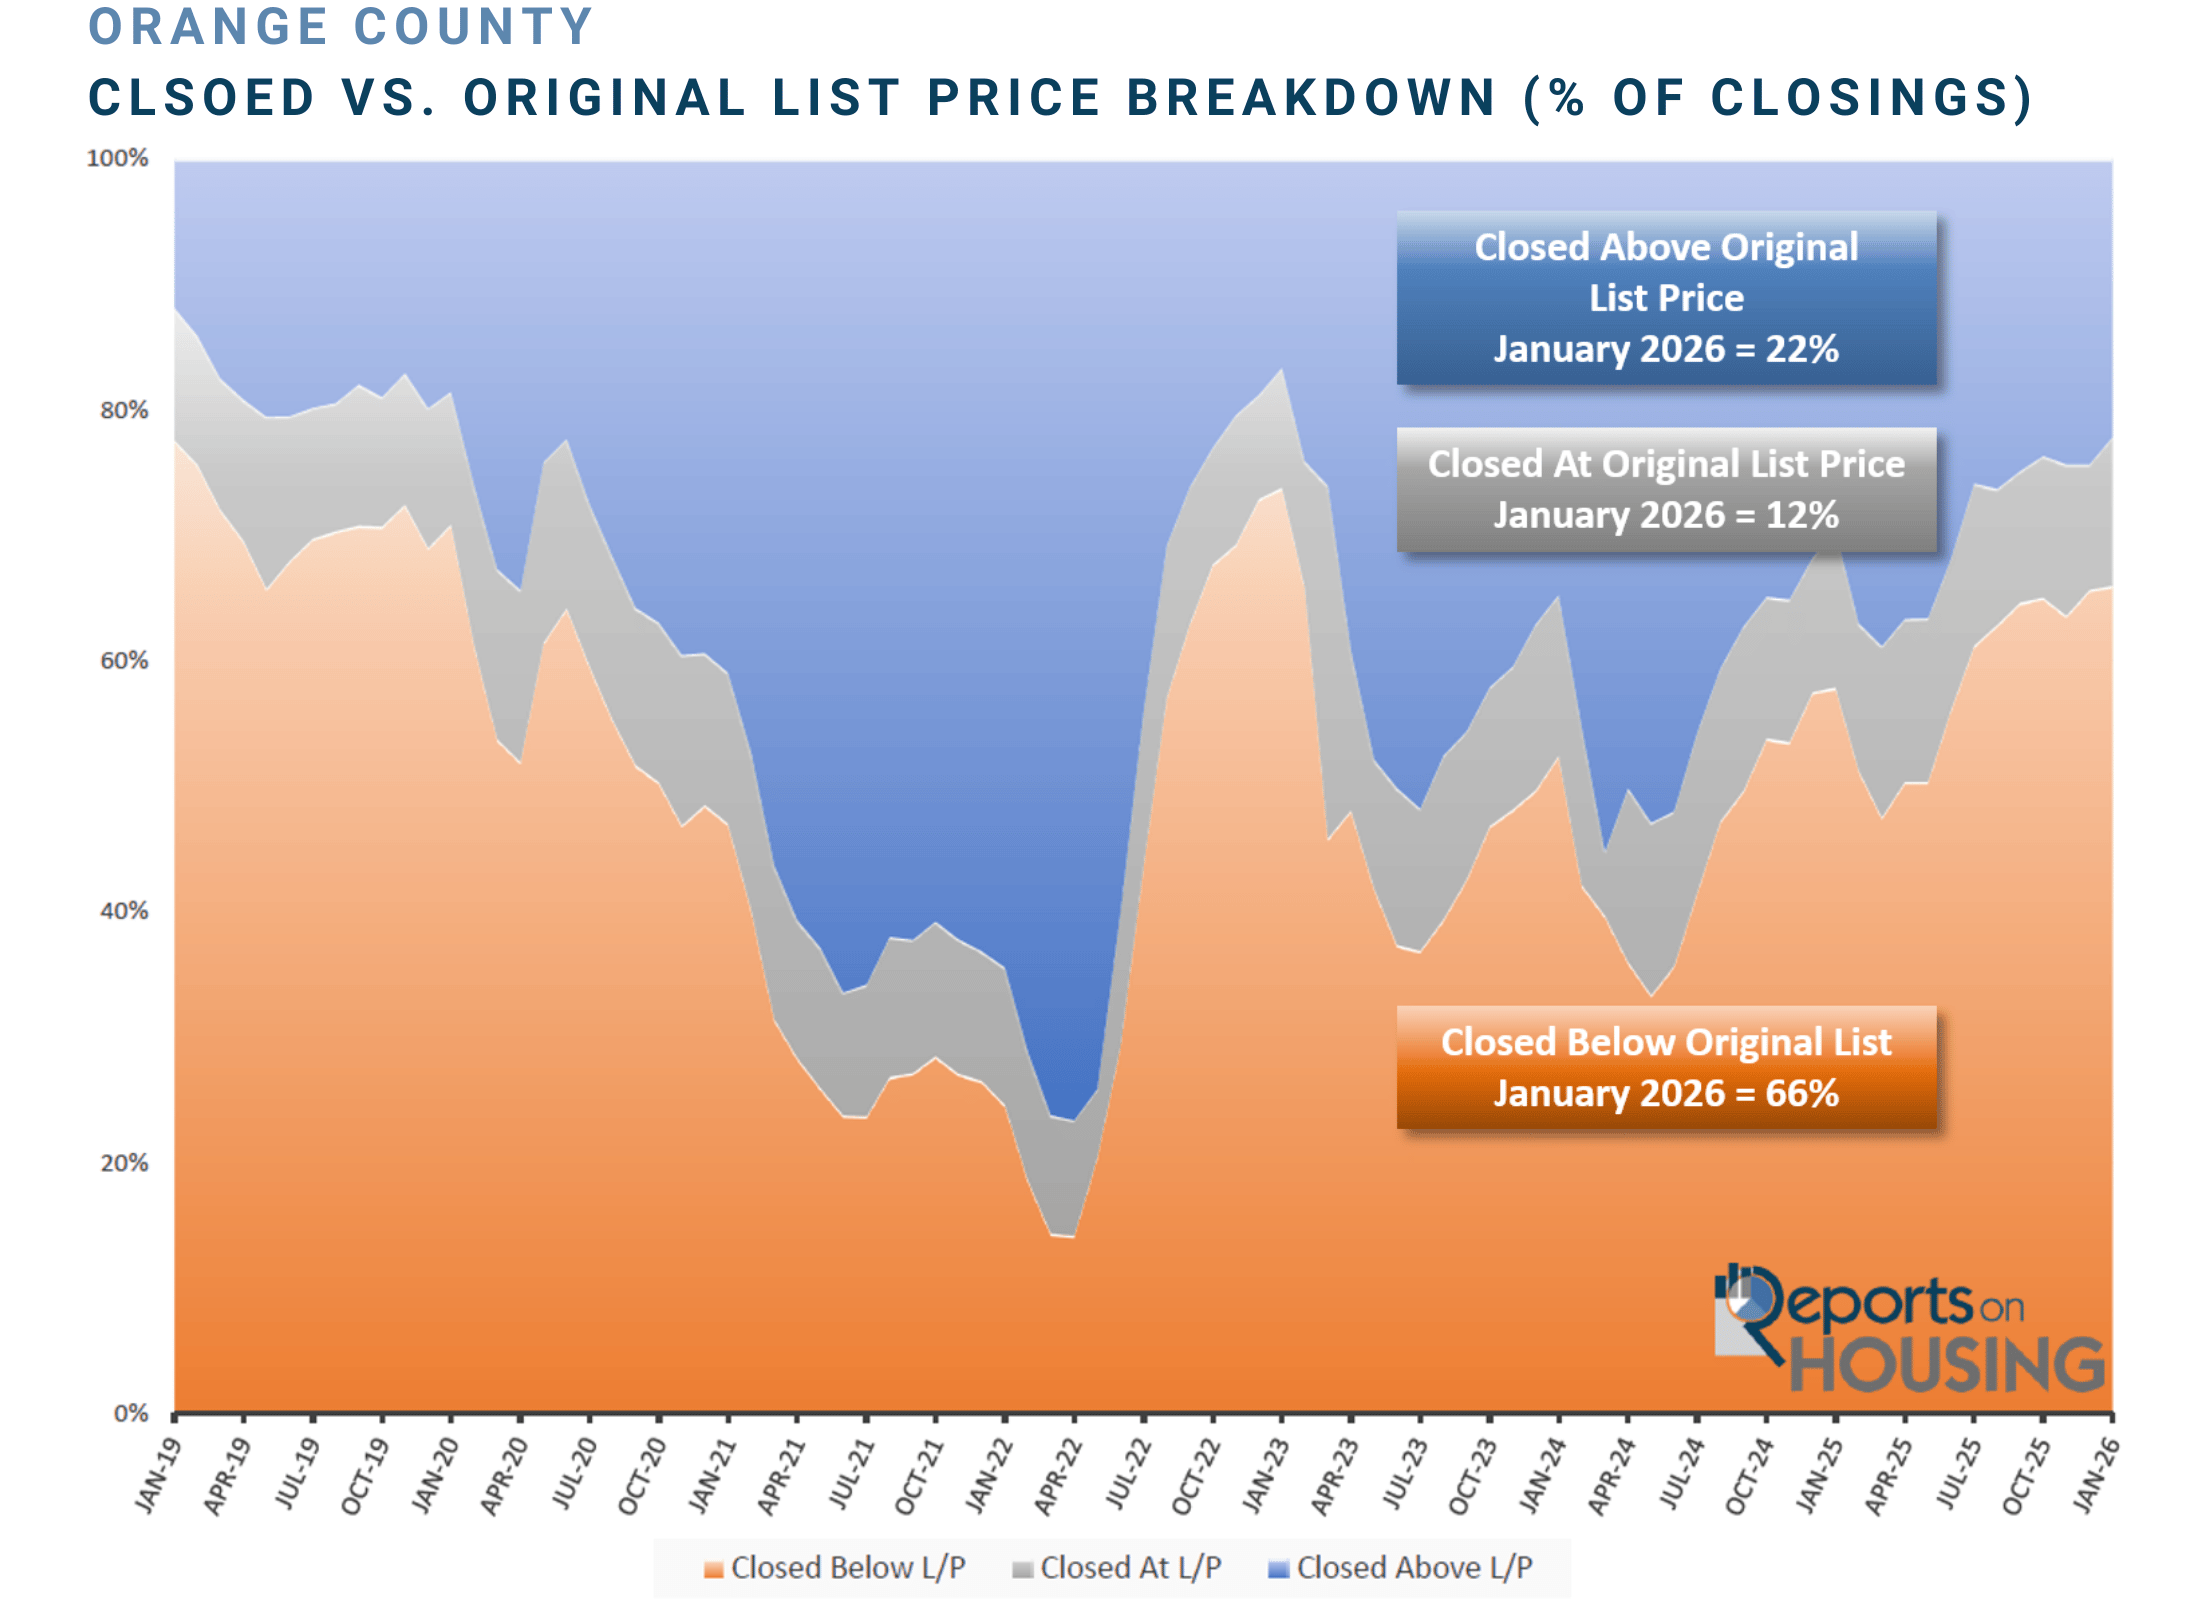
In January, 66% of all Orange County closed sales sold below their original list price, the highest level since January 2023.
Navigation apps have made it incredibly easy to reach a destination, even in unfamiliar areas. Google Maps, Waze, and Apple Maps are now used by just about everyone to get from one place to another. It was not until 2007, with the release of the iPhone and the introduction of mobile friendly GPS services, that navigation apps gained widespread popularity. Before then, drivers relied on paper maps, and the Thomas Guide was by far the most widely used. This old school, legendary resource was a spiral bound collection of highly detailed street maps covering major metropolitan areas. Its unique page and grid system, paired with a comprehensive index, was remarkably accurate and allowed navigators to confidently arrive at their intended destination.
Just as good navigation depends on understanding the full map, the complete picture, not just the destination, successfully coming on the market requires considering all the details. Pricing and timing decisions should be guided by facts, data, current trends, not headlines, narratives, or assumptions from the past. Inventory levels, buyer demand, interest rates, and local market conditions all matter and will help sellers reach their intended destination: a closed sale.
Precision pricing is one of the most important factors in successfully approaching the housing market. Far too many sellers initially price their homes without properly considering every single recent comparable closed and pending sale to arrive at the Fair Market Value, the most probable price the market is willing to pay for a home, considering a home’s condition, upgrades, location, and amenities. Buyers are shrewd and carefully weigh all the factors in arriving at a price. Given today’s higher prices, they are unwilling to overpay for a home.
In January, 66% of all Orange County closed sales sold below their original asking price. That is the highest level since January 2023, at 74%, right after rates skyrocketed in 2022, rising from 3.25% in January to 7.37% in October. The inventory climbed, demand plunged due to affordability constraints, and only 17% of sellers closed above their asking price. In January of this year, 22% of closed sales sold above their original price, and 12% closed at their asking price. Even though the housing market finished the year sluggishly, 34% closed at or above the list price.
(the number of days it takes to sell all Orange County listings at the current buying pace) is typically between March and April. Even though the Spring Market is the busiest time of the year in terms of buyer demand, it is also when many new sellers hit the market. In fact, the Expected Market Time typically begins to rise slowly in April and continues to rise through both the Spring and Summer Markets. There is more seller competition the longer a seller waits to come on the market. Additionally, higher price ranges are slower than lower ranges, and there is typically a difference between attached and detached as well.
To achieve the highest possible price in the shortest amount of time, sellers must evaluate current data, market trends, seasonality, price the home strategically, and present it as move in ready. Sellers who take the time to look at the complete picture are better positioned to navigate today’s market with clarity and confidence.
Active Listings
The inventory increased by 6% in the past couple of weeks.
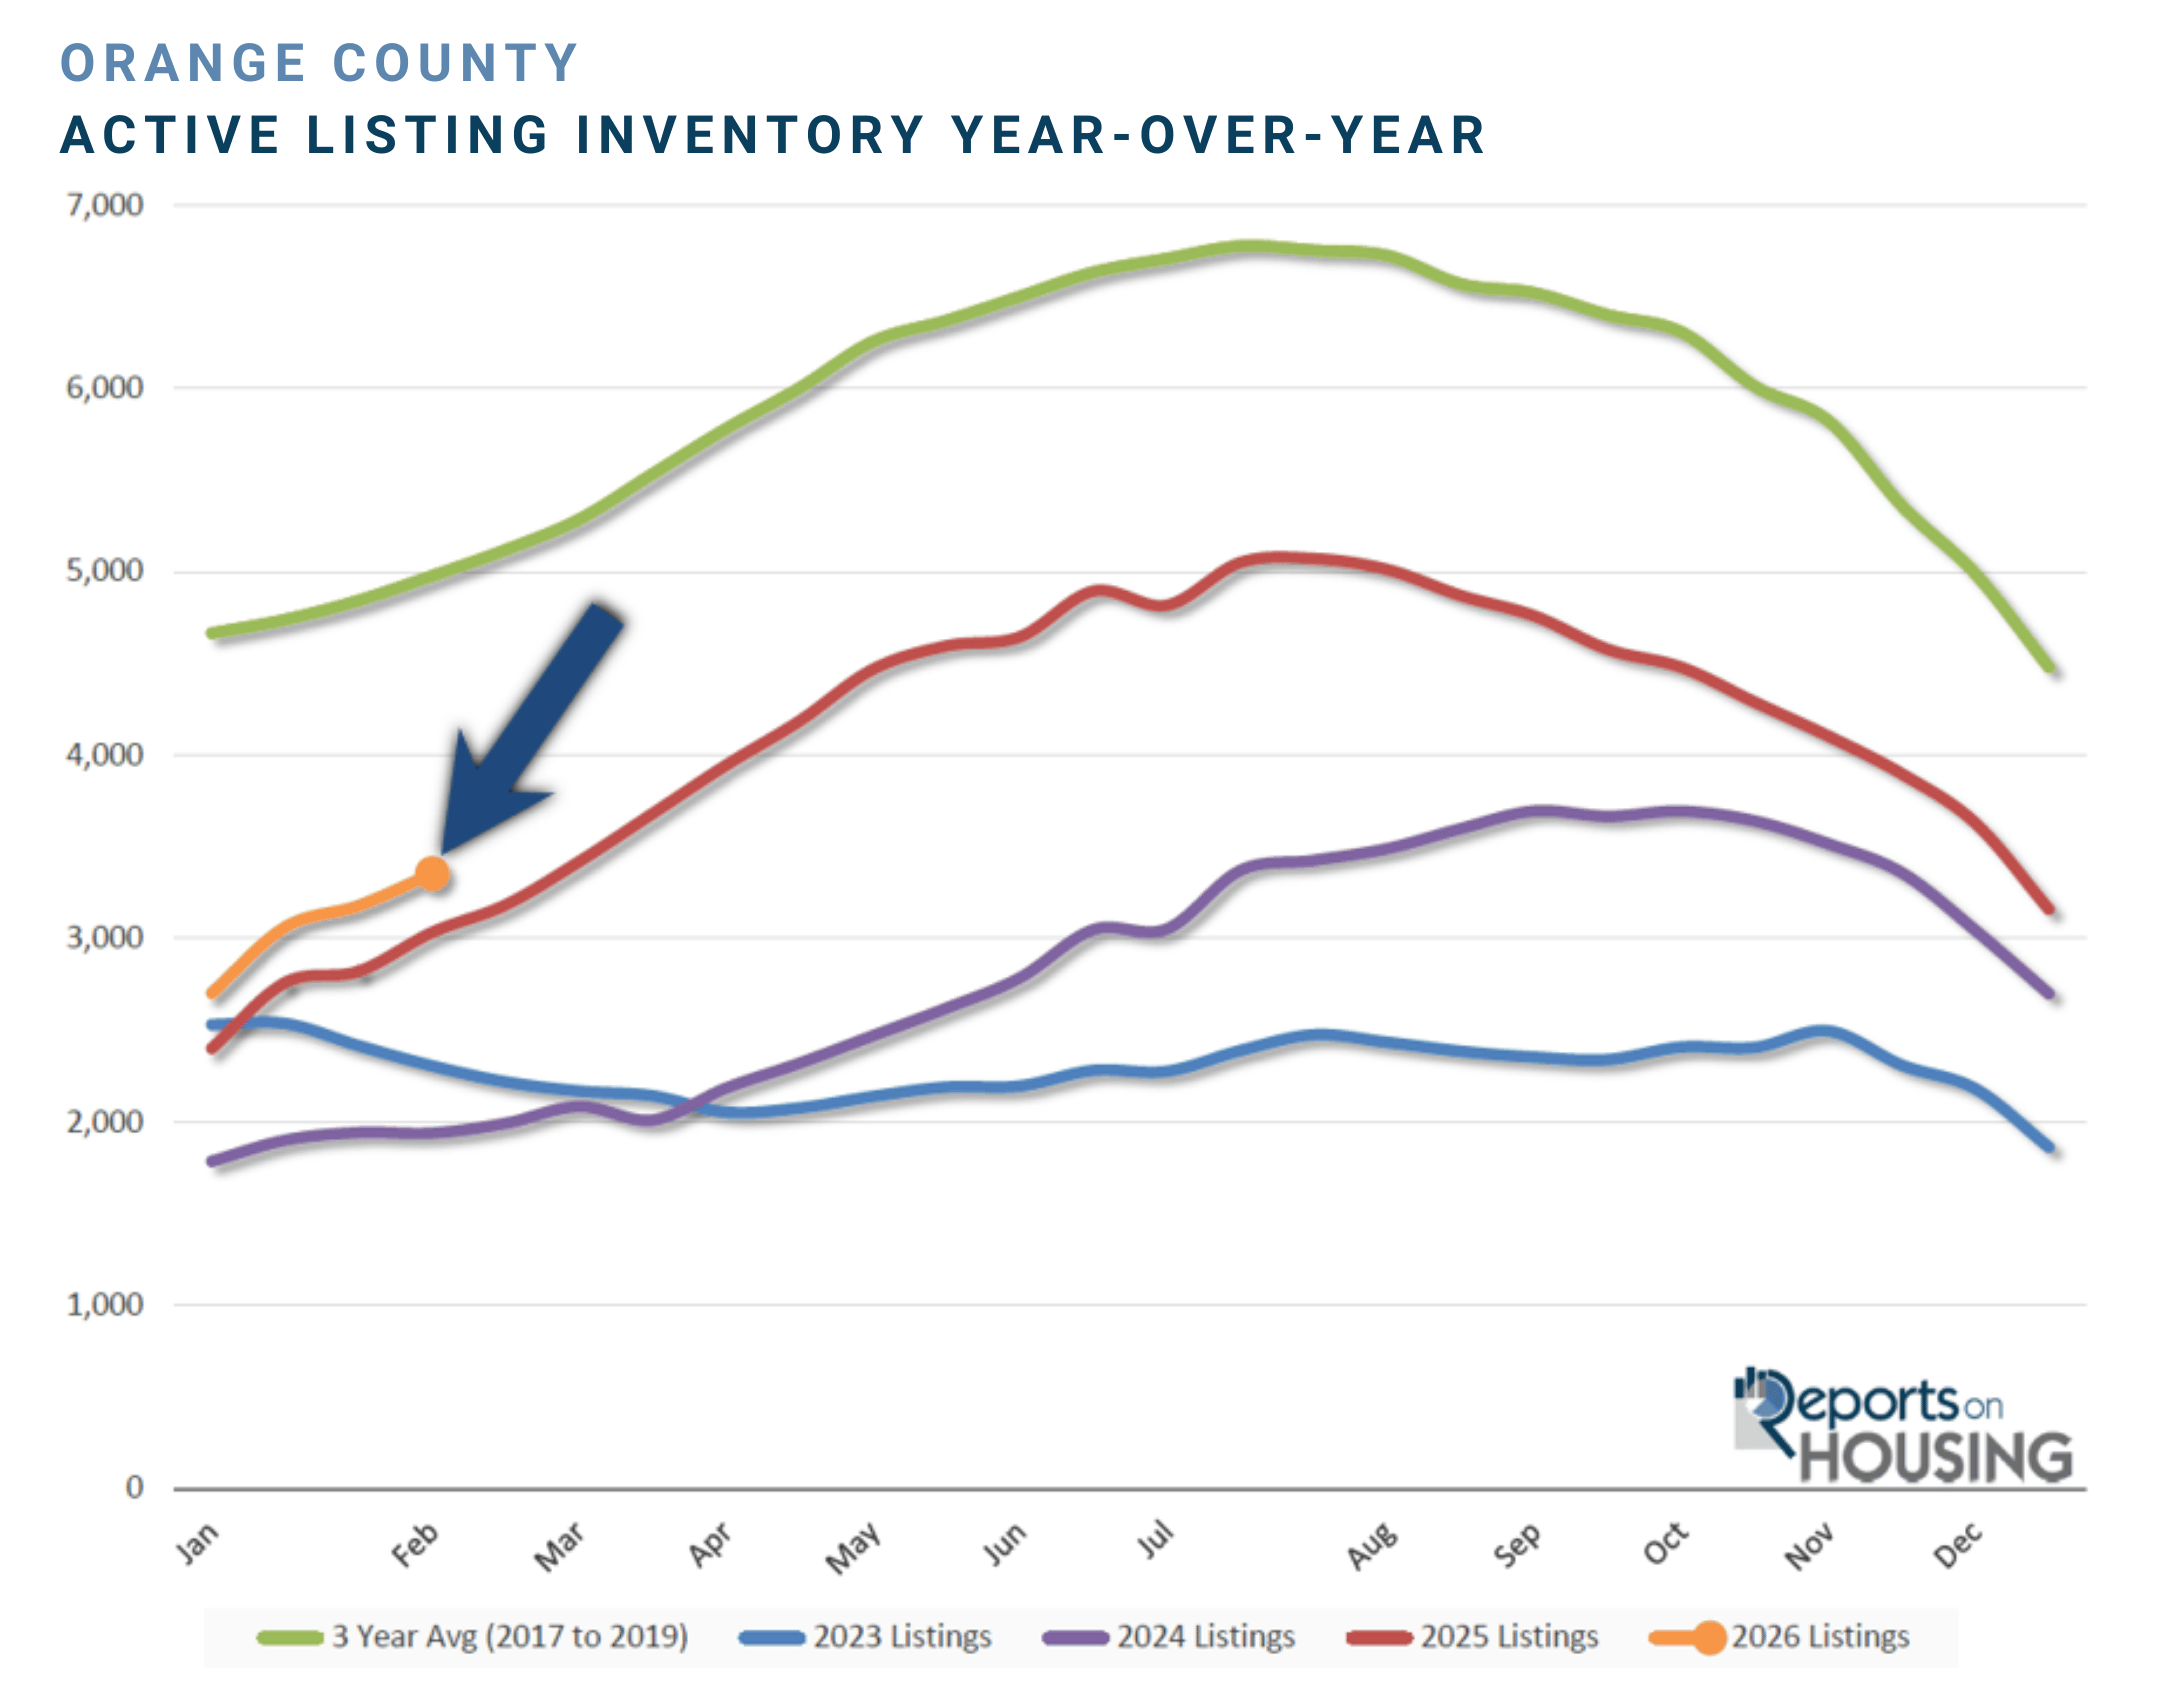
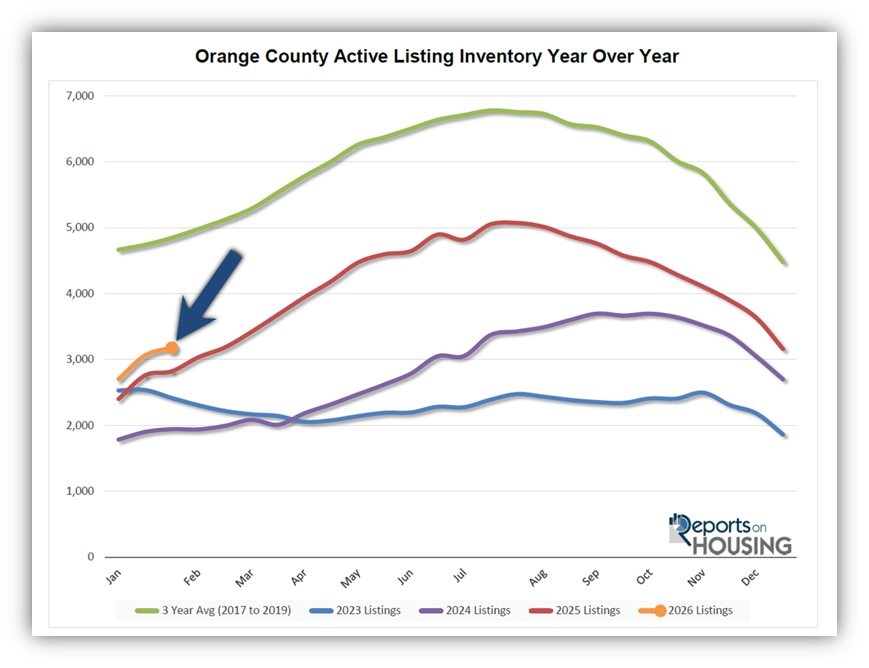
The active listing inventory increased by 175 homes over the past two weeks, up 6%, and now sits at 3,354, its highest mid February level since 2020, when it reached 4,030. The inventory is slightly above last year’s level and has so far mirrored the week to week changes. Last year, the active listing inventory was rising rapidly, and year over year differences were quite large. This year is completely different, and the inventory is not much different from last year’s. And, a similar number of homes have been coming on the market compared to last year. If demand were to continue to pick up steam and outperform 2025, the active inventory would not rise as quickly and would most likely dip under last year’s level. Only time will tell.
Last year, the inventory was at 3,033 homes, 10% lower, or 321 fewer. The 3-year average before COVID (2017 through 2019) was 4,834, an additional 1,480 homes, or 44% more.
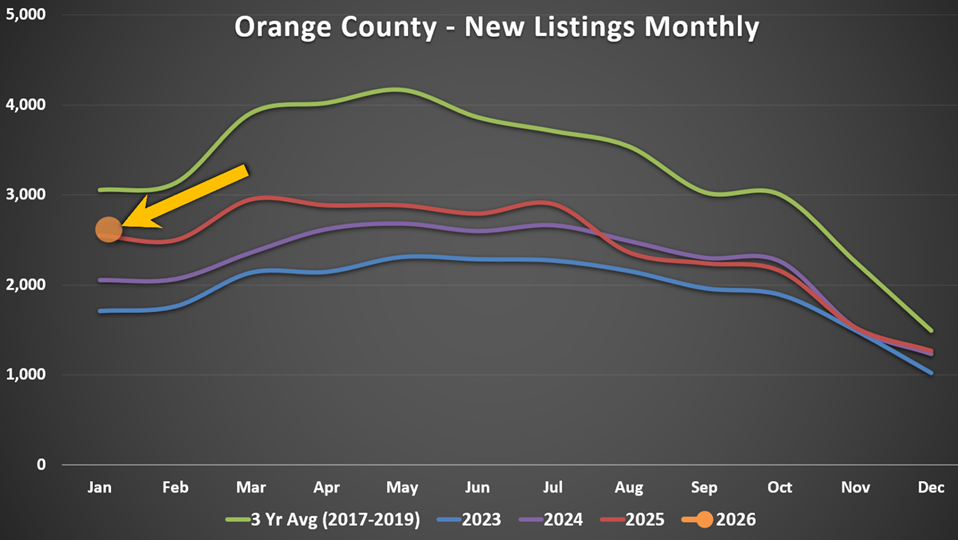
Homeowners continue to “hunker down” in their homes, unwilling to move because of their current, underlying, locked in, low fixed rate mortgage. This trend has been easing from the lows established in 2023. In January, 2,588 homes were placed on the market in Orange County, 466 fewer than the 3-year average before COVID (2017 to 2019), 15% less. In 2025, 2,545 homes entered the market, compared to 2,054 in 2024, and 1,710 in 2023. A similar number of homes are coming on the market this year compared to last.
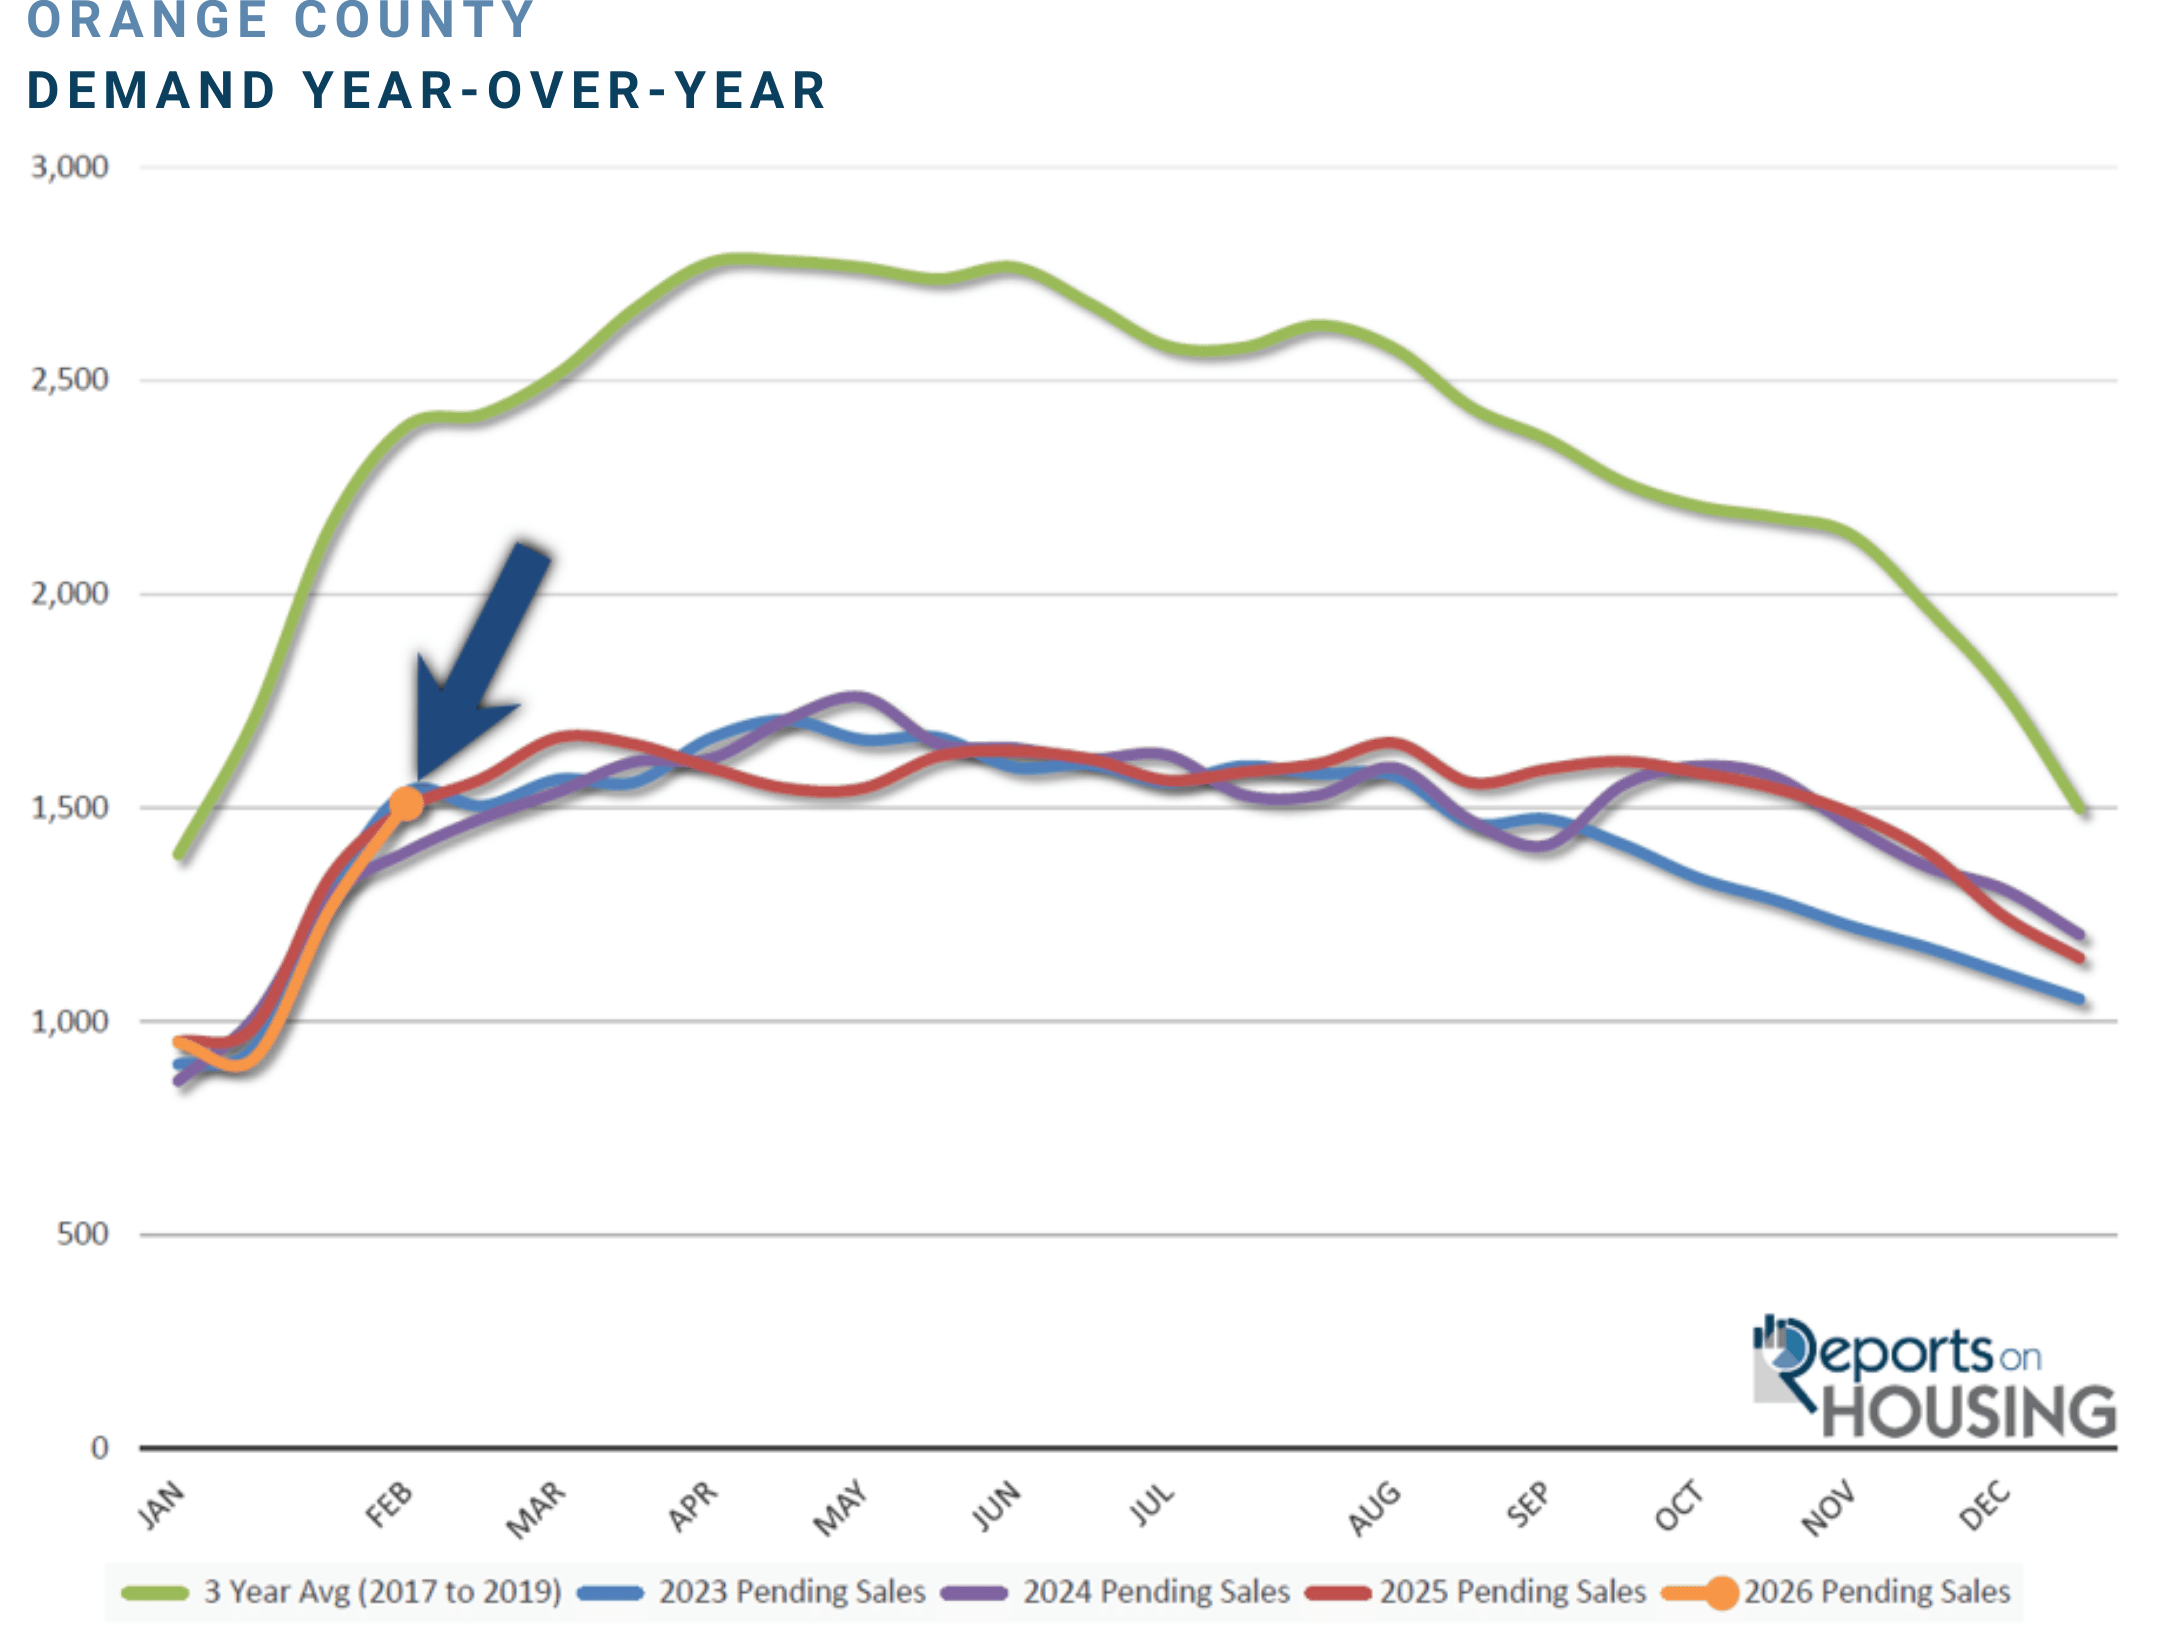
Demand
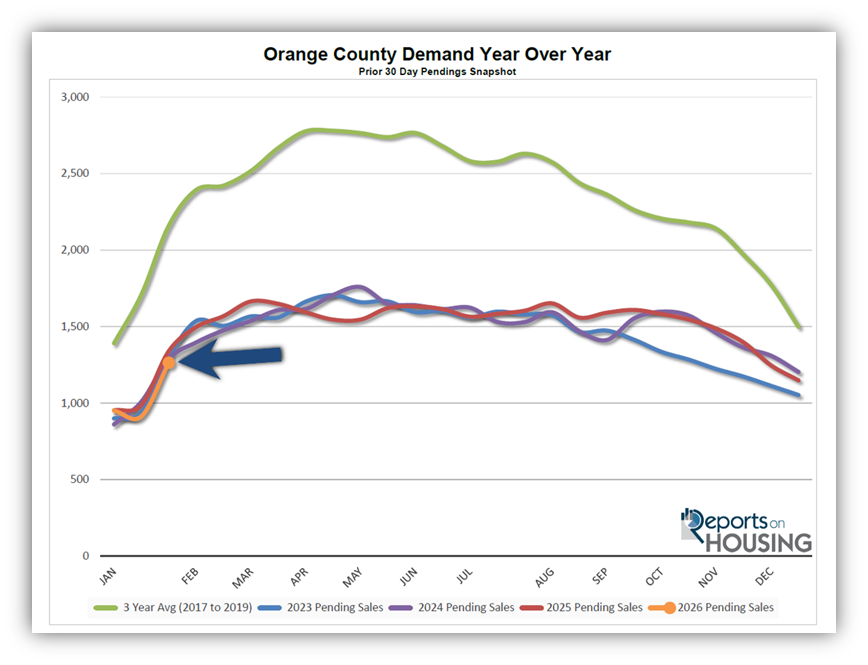
Demand surged by 19% in the past couple of weeks.Demand, a snapshot of the number of new pending sales over the prior month, surged from 1,264 to 1,510 in the past couple of weeks, up 246 pending sales, or 19%, the highest mid February reading since 2023’s 1,537 (only 27 more). The lower mortgage rate environment is slowly improving demand. It has yet to break from the 3-year low demand stalemate, but rates just fell to 6.04% according to Mortgage News Daily, their second lowest level since February 2023. Mortgage rates were at 7.02% a year ago. That 1% drop represents a 10% jump in buyers’ purchasing power. The improved affordability is projected to increase buyer demand as housing transitions to the Spring Market.
Last year, demand was 1,497, with 13 fewer pending sales, or 1% less. It was 76 more just two weeks ago. The 3-year average before COVID (2017 to 2019) was 2,336 pending sales, 55% more than today, or an additional 826.
As the Federal Reserve has indicated, it is essential to watch all economic releases for signs of slowing. That is the only path to lower mortgage rates at this time. These releases can cause mortgage rates to rise or fall, depending on how they compare with market expectations. This week, the Personal Consumption Expenditures Price Index (PCE), the Fed’s preferred inflation gauge, will be released on Friday. This week also marks the release of the S&P Global Manufacturing and Services Purchasing Managers Index (PMI), which tracks the strength of the U.S. manufacturing and services sectors.
Expected Market Time
In the past two weeks, the market time dropped by another 8 days.
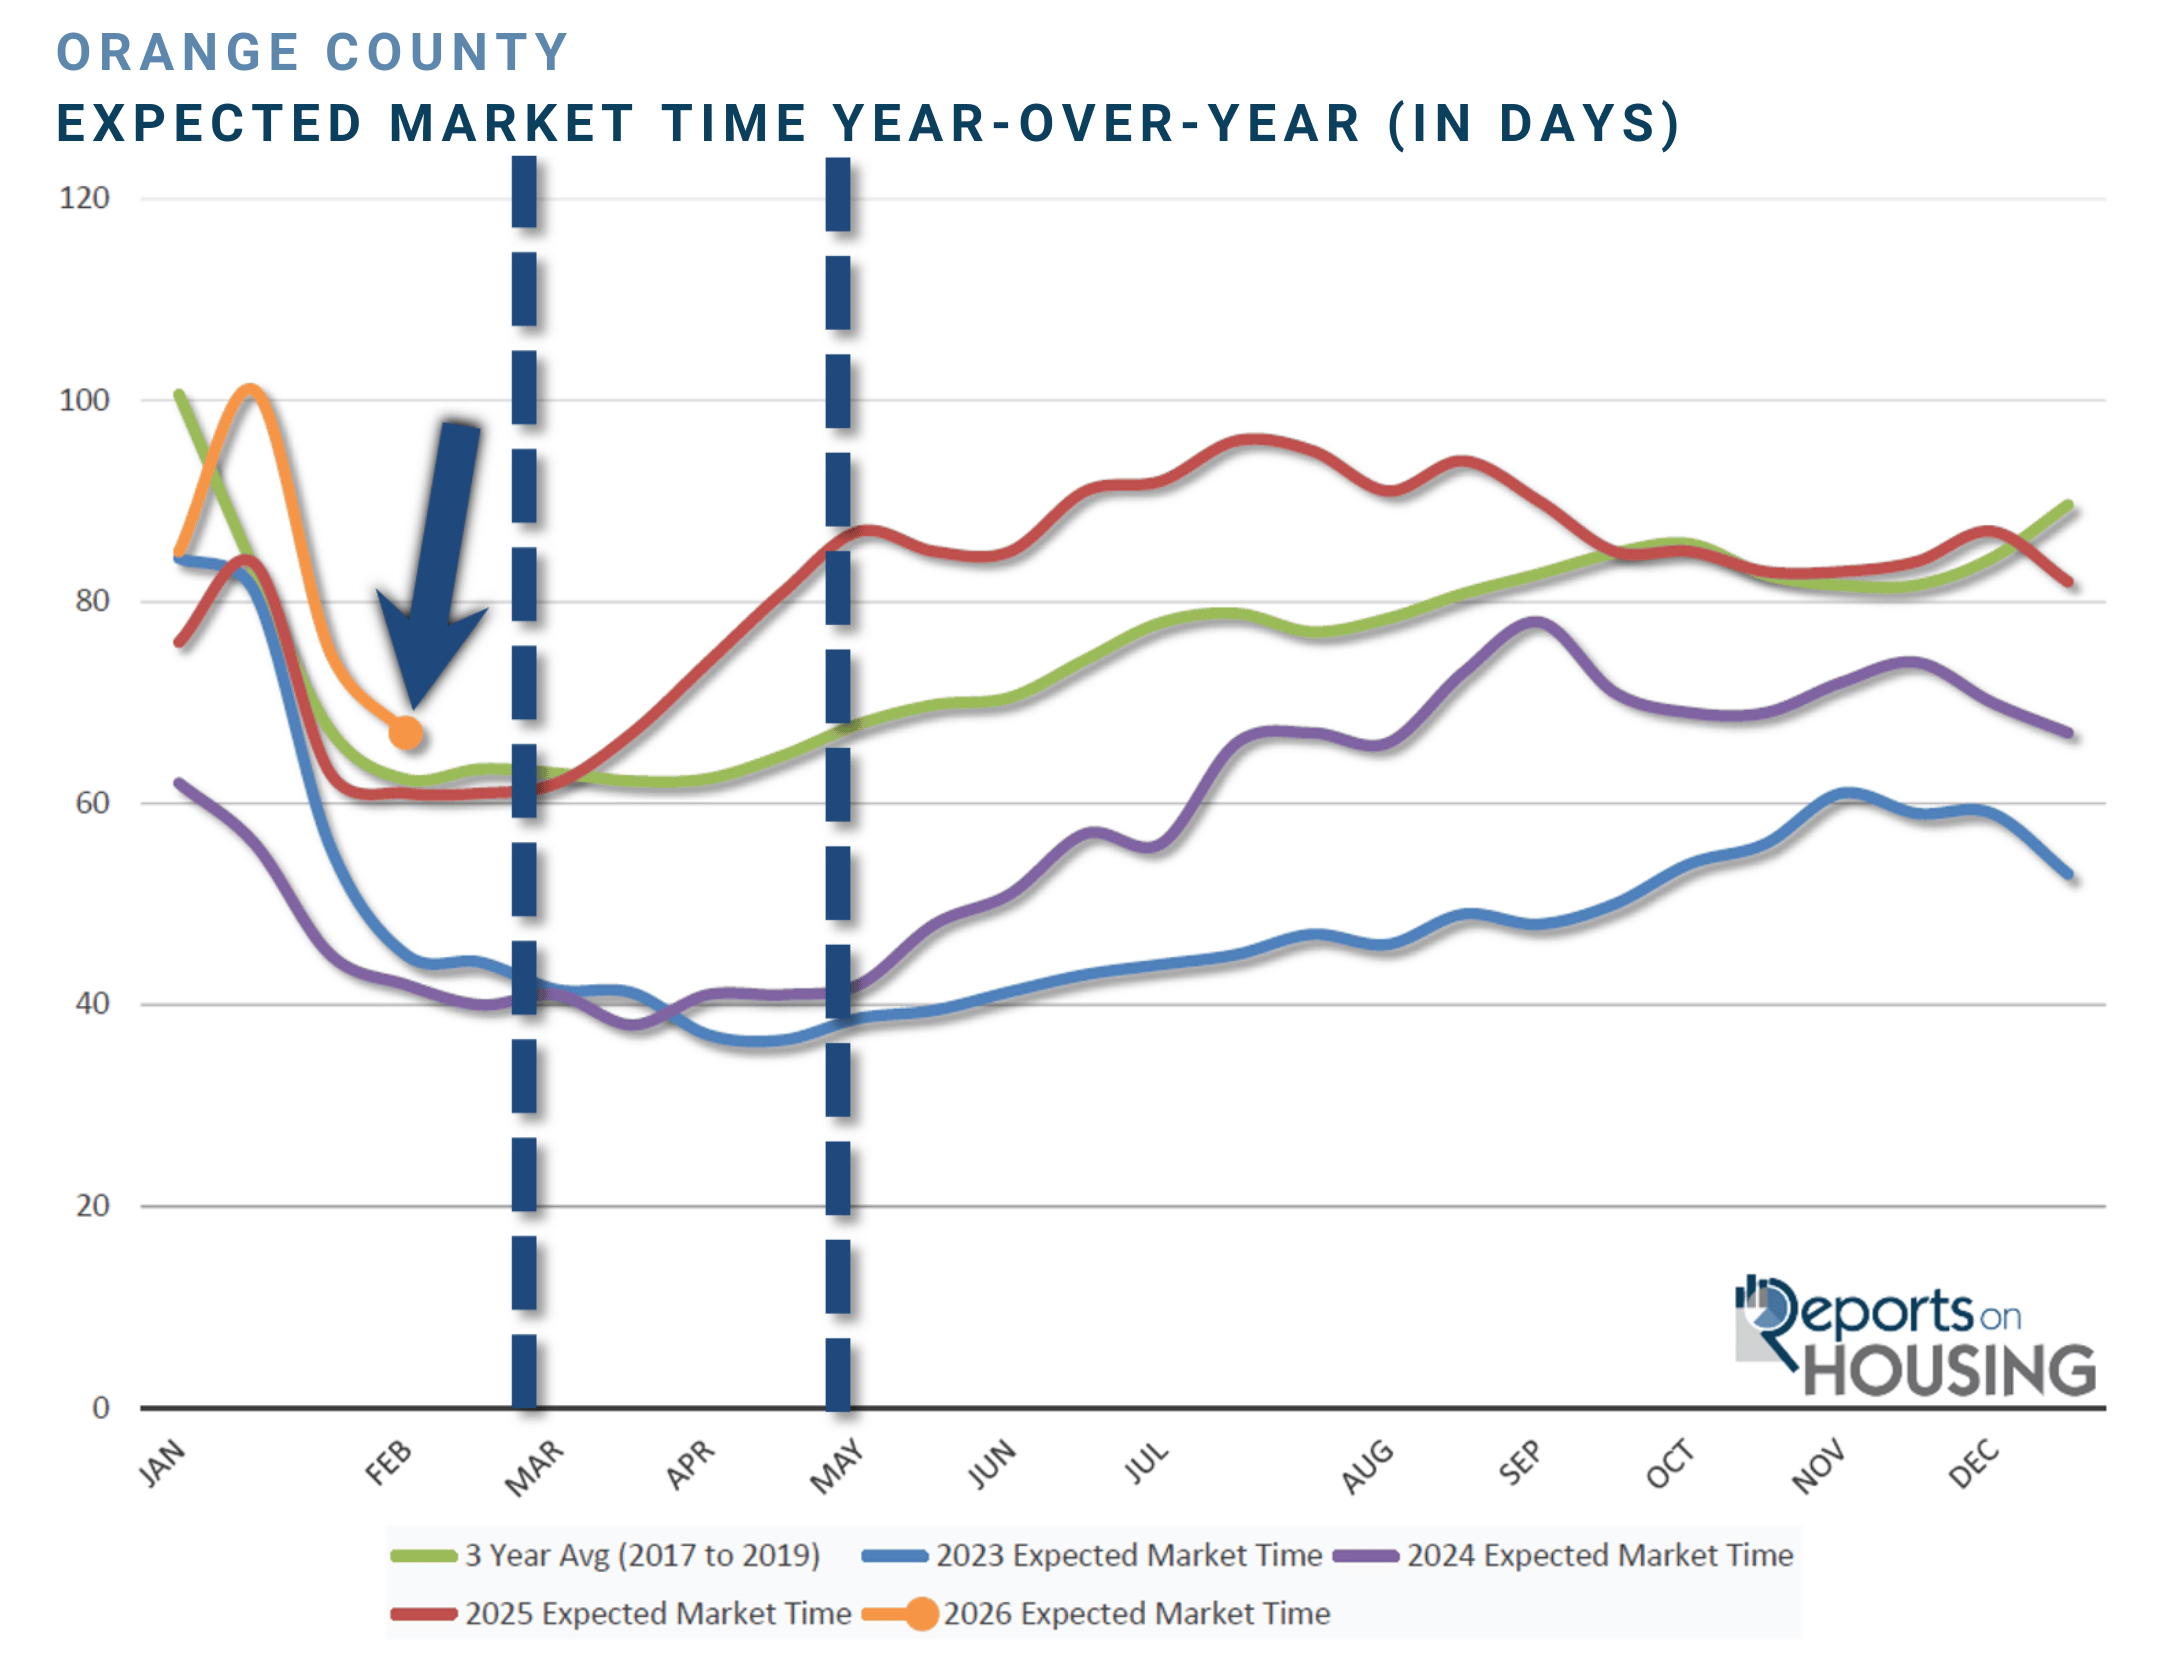
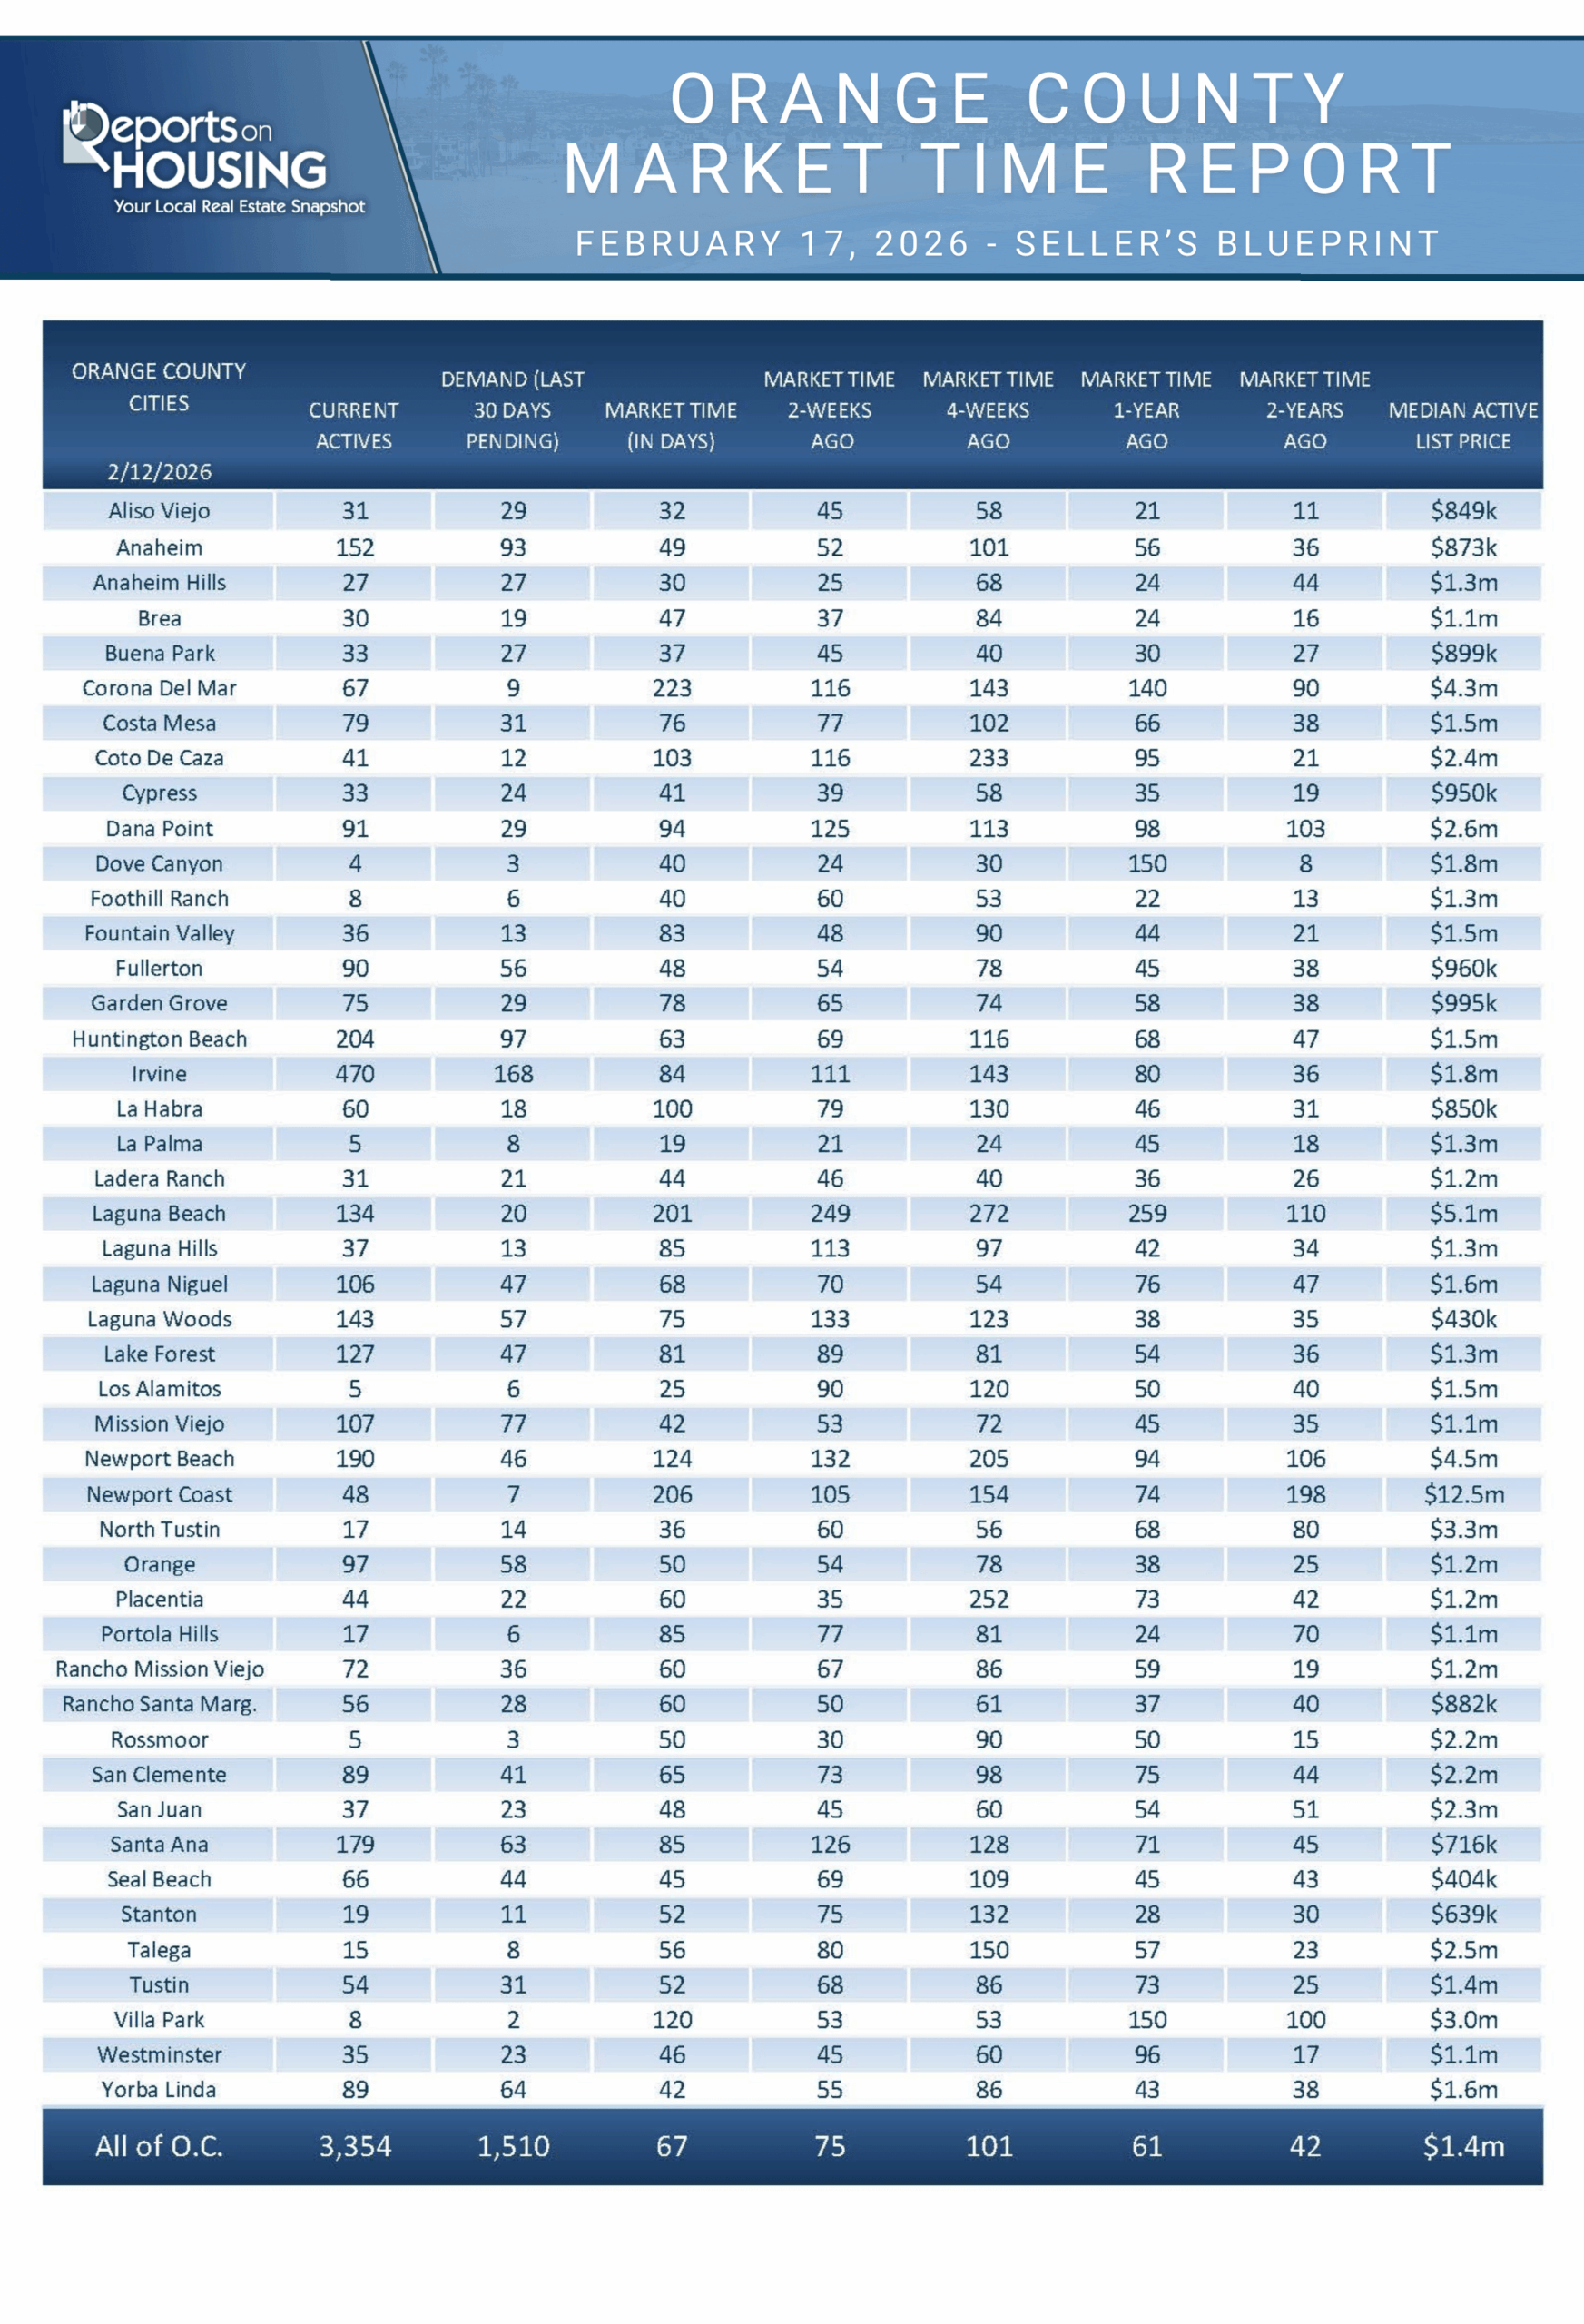
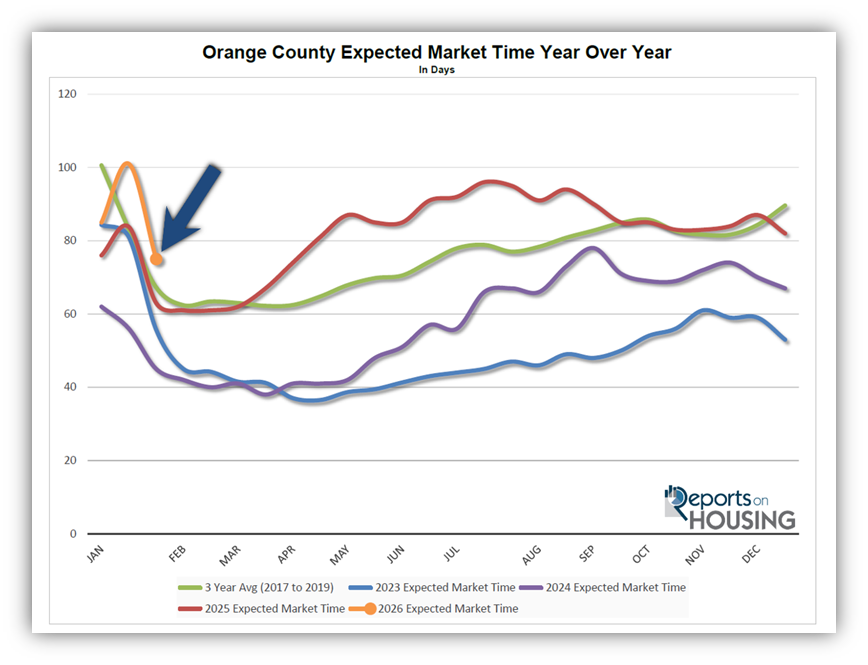
With the supply of available homes rising by 175 homes, up 6%, and demand surging by 246 pending sales, up 19%, the Expected Market Time (the number of days it takes to sell all Orange County listings at the current buying pace) dropped from 75 to 67 days in the past couple of weeks, its fastest pace since March of last year.
Last year, it was 61 days, slightly faster than today. The 3-year average before COVID (2017 to 2019) was 63 days, similar to today.
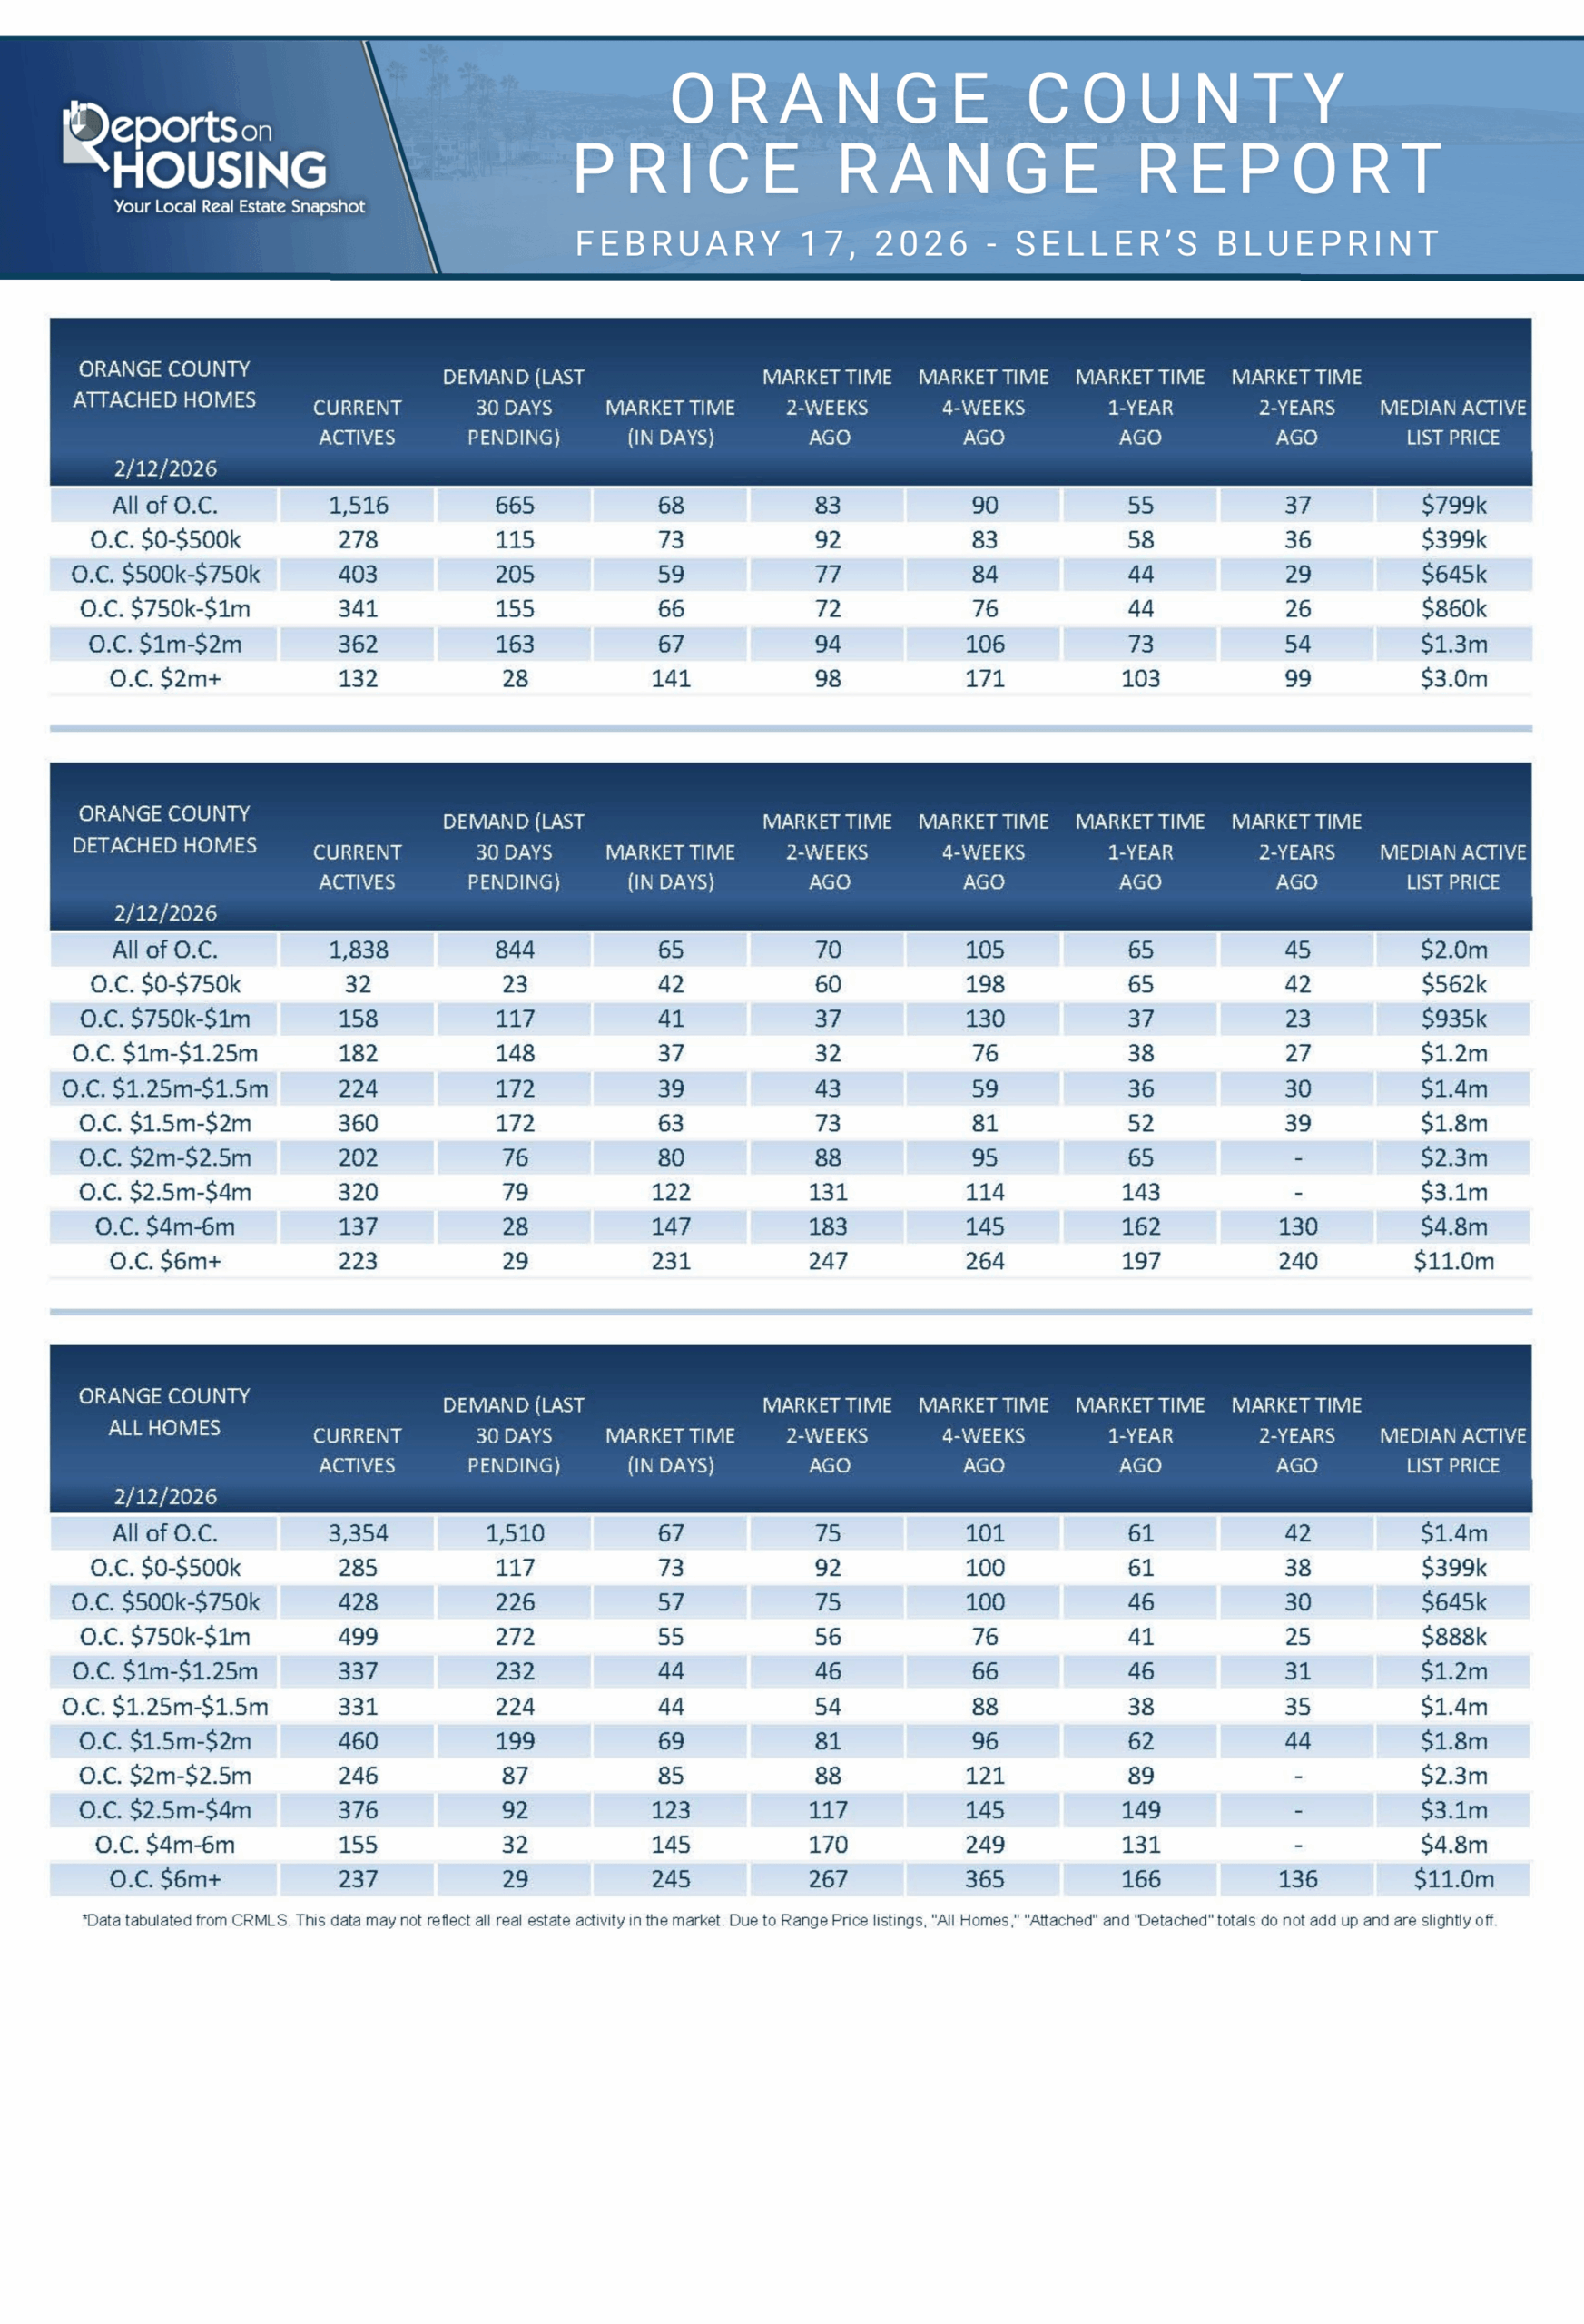
The Expected Market Time for condominiums and townhomes plunged from 83 to 68 days in the past two weeks. It was at 55 days last year. For detached homes, the Expected Market Time dropped from 70 to 65 days. It was 65 days a year ago, identical to today. The detached home market is similar to the attached home market.
Luxury End
The luxury market improved slightly over the past couple of weeks.
In the past couple of weeks, the luxury inventory of homes priced above $2.5 million, the top 10% of the Orange County housing market, increased from 731 to 768 homes, up 37 or 5%. Luxury demand increased by 11 pending sales, up 8%, to 153. With demand slightly outpacing supply, the Expected Market Time for luxury homes priced above $2 million decreased from 154 to 151 days, its fastest reading since March of last year. This might be the fastest reading for the year for luxury.
Year over year, the active luxury inventory is down by 117 homes, or 13%, and luxury demand is down by 17 pending sales, or 10%. Last year’s Expected Market Time was 156 days, similar to today.
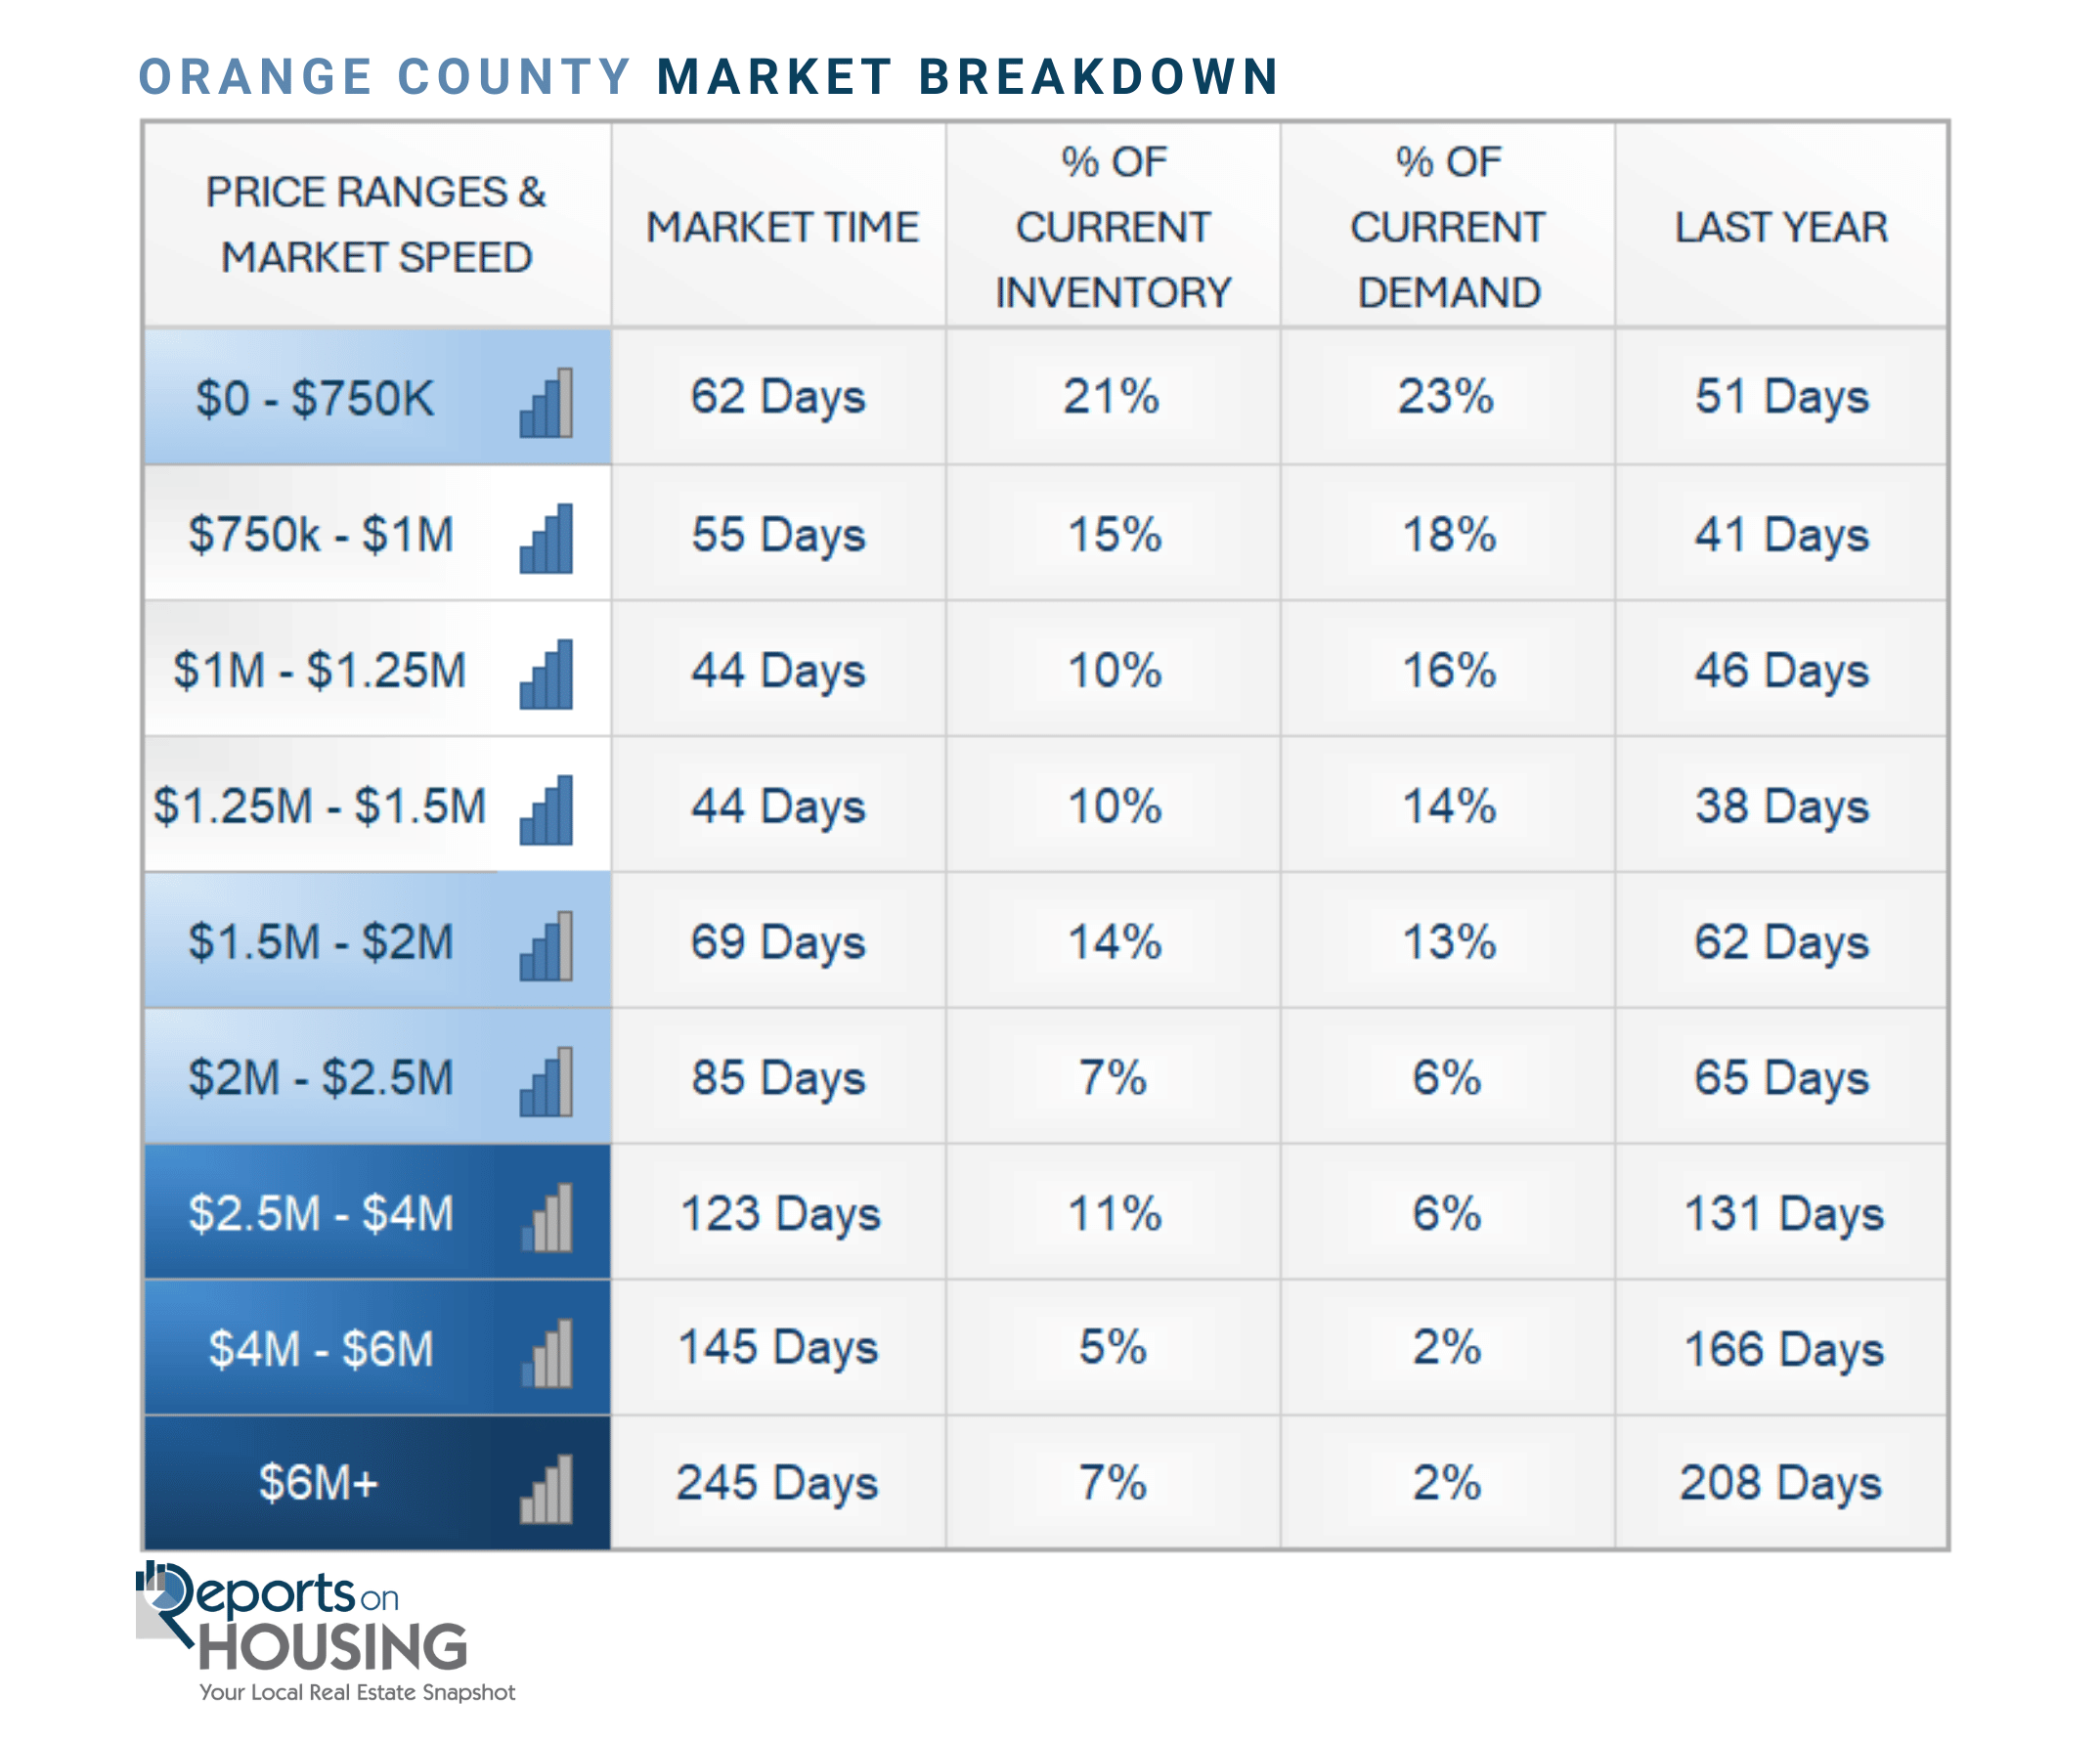
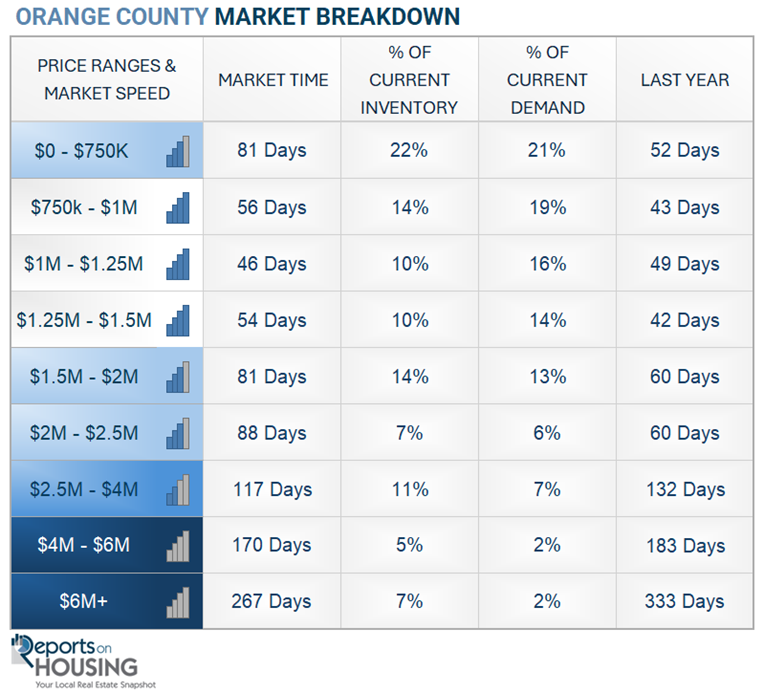
In the past two weeks, the Expected Market Time for homes priced between $2.5 million and $4 million increased from 117 to 123 days. For homes priced between $4 million and $6 million, the Expected Market Time decreased from 170 to 145 days. For homes priced above $6 million, the Expected Market Time decreased from 267 to 245 days. Luxury is at 151 days overall. At this pace, a seller would be looking at becoming a pending sale around July 2026.
Orange County Housing Summary
- INVENTORY: The active listing inventory in the past couple of weeks increased by 175 homes, up 6%, and now stands at 3,354. Last year, there were 3,033 homes on the market, 321 fewer homes, or 10% less. The 3-year average before COVID (2017 to 2019) was 4,834, which is 44% higher. In January, 15% fewer homes came on the market than the 3-year average before COVID (2017 to 2019), 466 fewer. Only 43 more sellers came on the market this January compared to January of last year, 534 more than in 2024, and 878 more than in 2023.
- DEMAND: Buyer demand, the number of pending sales over the prior month, surged by 246 in the past two weeks, up 19%, and now stands at 1,510. Last year, there were 1,497 pending sales, 1% less than today. The 3-year average before COVID (2017 to 2019) was 2,336, which is 55% higher.
- MARKET TIME: With demand surging compared to the smaller rise in supply, the Expected Market Time, the number of days to sell all Orange County listings at the current buying pace, plunged from 75 to 67 days in the past couple of weeks. Nonetheless, it is the highest mid-February since 90 days. Last year, it was 61 days, slightly faster than today. The 3-year average before COVID (2017 to 2019) was 63 days, similar to today.
- LUXURY: In the past two weeks, the Expected Market Time for homes priced between $2.5 million and $4 million increased from 117 to 123 days. For homes priced between $4 million and $6 million, the Expected Market Time decreased from 170 to 145 days. For homes priced above $6 million, the Expected Market Time decreased from 267 to 245 days.
- DISTRESSED HOMES: Short sales and foreclosures combined, comprised only 0.1% of all listings and 0.2% of demand. Two foreclosures and one short sale are available today in Orange County, bringing the total of distressed homes on the active market to three, down one from two weeks ago. Last year, six distressed homes were on the market, similar to today.
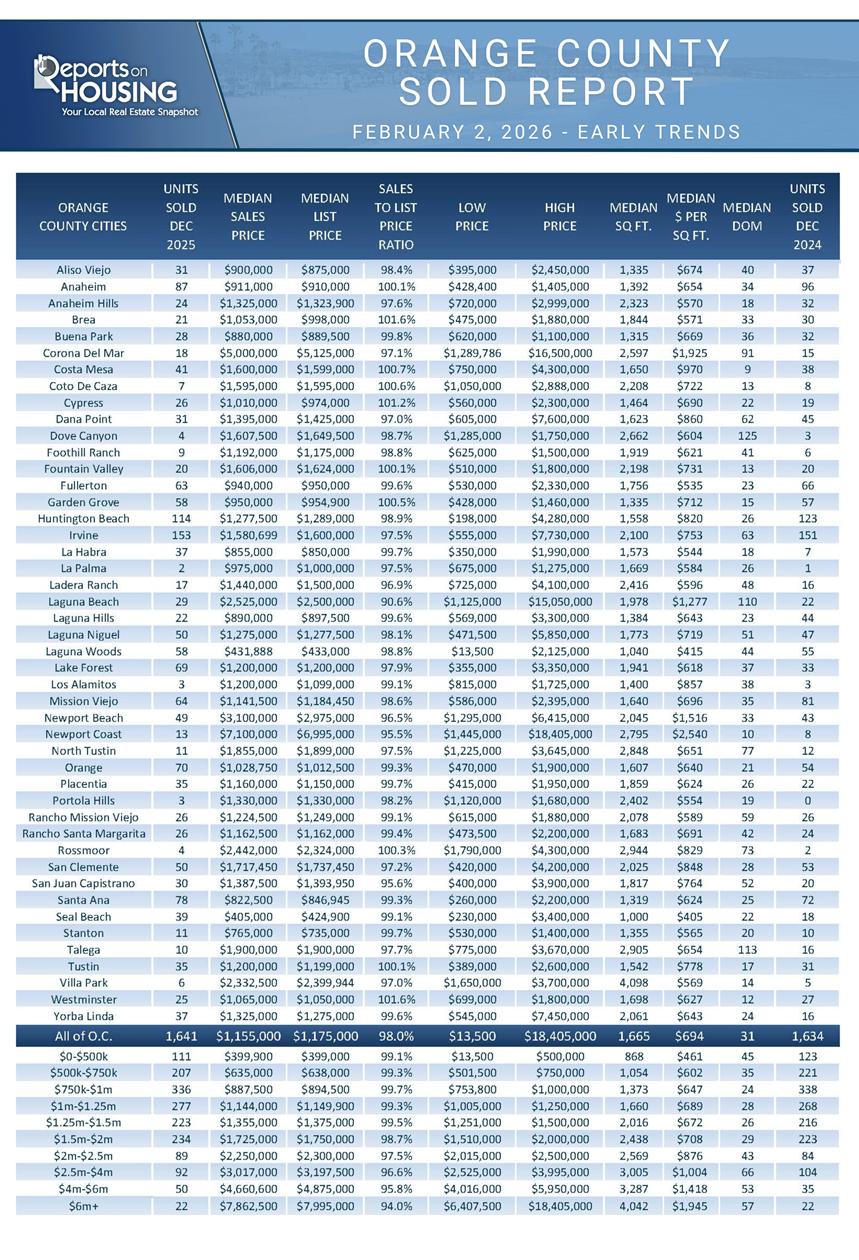
- CLOSED SALES: There were 1,214 closed residential resales in January, down 4% compared to January 2025’s 1,268 sales, and down 26% from December 2025. The sales to list price ratio in Orange County was 96.8%. Foreclosures accounted for 0.2% of all closed sales, and short sales accounted for 0.1%. That means that 99.7% of all sales were sellers with equity.
Have a great week.
Sincerely,
Steven Thomas
Quantitative Economics and Decision Sciences
Copyright 2026—Steven Thomas, Reports On Housing—All Rights Reserved. This report may not be reproduced in whole or in part without express written permission from the author.

February 2, 2026
It is best to step back from the narratives, opinions, and noise surrounding the housing market and focus on the underlying trends.
Market Signals
With January in the rearview mirror, trends are already emerging to better understand what lies ahead.
Growing up, nearly everyone has encountered the playground spinner, or merry-go-round, the classic park apparatus that kids love to push to its limits. A friend, sibling, or parent runs around, building momentum, then whips it in an attempt to break a world record for speed or revolutions per minute. Once the ride comes to a complete stop, all its occupants disembark as the world spins around them. Disoriented, it is almost impossible to walk, until finally everything comes into clear focus.
The housing market starts each year as if everyone just got off a playground spinner, a bit disoriented after all of the distractions and festivities of the holiday season. Initially, it is hard to navigate, not knowing what to expect, until the end of January, when the direction of the housing market becomes clearer. The 2026 trends are already emerging, shedding light on future supply, demand, and market speed.
Here are the early Orange County housing trends:
- New Listings – There are not as many homes coming on the market as initially expected. Homeowners continue to “hunker down” in their homes, unwilling to move because of their underlying, locked-in, low fixed-rate mortgage. This trend has been easing from the lows established in 2023, leading to more homes placed on the market in January than the year before. In January 2023, a low was established with only 1,710 new sellers. The 3-year average before the pandemic (2017-2019) was 3,054, 79% higher than the January 2023 figure. In 2024, there were 2,054 new sellers, up 20% from the year before, yet still 33% below the 3-year average. In January 2025, it grew to 2,545 new FOR SALE signs, up 24% from 2024 and 49% from 2023. It was still 17% below the 3-year average. With more and more homeowners inclined to place their homes on the market each year, slowly returning to a “normal” number of market participants, it would be reasonable to expect this trend to continue. However, there were 2,588 new sellers this January, up only 1.7% from last year and down 15% from the 3-year average before COVID.
The supply of available homes is determined by the number of homes placed on the market each month. Demand did not change much from 2023 through 2025, but the number of homes coming on the market increased year over year. With more FOR SALE signs in 2024 compared to 2023, the inventory methodically grew weekly. There were even more new sellers in 2025, so the inventory grew at an even swifter pace. Yet, if 2026 continues at a similar pace to last year, how much inventory grows depends on the direction of demand, which could accelerate in today’s lower-rate environment. That would make it more challenging to expand the inventory beyond last year’s levels.
- Inventory – Unlike this time last year, when the inventory surged sharply year-over-year, the number of available homes in 2026 is increasing at a pace similar to last year. In 2023, the inventory uncharacteristically dropped from January through mid-April before slowly rising. In 2024, with more new sellers, the inventory grew slightly through March, then picked up steam and steadily climbed to a late peak in September at 3,695 homes, up 57% or 1,342 homes from September 2023. In 2025, with even more homeowners participating in the market, the inventory grew at a much swifter pace, peaking at 5,071 homes at the end of July, up 48% or 1,645 from July 2024. Currently, there are 3,179 homes on the market, up 13% from last year, or an extra 358 homes. Last year, it was up 45% year over year, or an additional 879 homes. The current trend is for inventory to grow at a similar rate to last year. Still, it could dip below the previous year’s level if today’s improved mortgage rate environment triggers additional demand, as is projected.
- Demand – Buyer demand has been underperforming in Orange County, unlike all other markets in Southern California. Mortgage rates have been below 6.5% for five months now, since September 3rd. They have not stayed at these levels for very long over the past three years. In both 2024 and 2025, mortgage rates did not drop below 6.5% until the Fall Market. This year, however, the lower rate environment appears more long-lasting, significantly improving affordability. Last year, mortgage rates were over 7%. According to Mortgage News Daily, the 30-year rate is 6.17% today. A $1 million loan at 7% is $6,653 per month. At 6%, it drops to $5,996, a $653 monthly improvement or nearly $8,000 annually. This improved mortgage rate environment aligns perfectly with the Winter and Spring Markets, which should ultimately result in increased buyer demand, as it has in so many other markets.
Now that the playground merry-go-round has come to a complete stop, the 2026 trends are beginning to emerge, indicating a strengthening market as housing makes its way through the Winter Market.
Active Listings
The inventory increased by 4% in the past couple of weeks.
The active listing inventory increased by 117 homes over the past two weeks, up 4%, and now sits at 3,179, its highest end-of-January level since 2020, when it reached 4,005. The inventory had surged in the first couple of weeks of January as many sellers who delisted during the holidays reemerged and placed their homes back on the market. That surge has subsided. The inventory will grow methodically from here, but the pace is yet to be determined. The lower mortgage rate environment should spark an increase in buyer demand, preventing the inventory from growing at the same pace as last year. So far, the inventory has been mirroring 2025. The next few weeks will determine whether that continues or breaks out on its own unique trajectory.
Last year, the inventory was at 2,821 homes, 11% lower, or 358 fewer. The 3-year average before COVID (2017 through 2019) was 4,695, an additional 1,866 homes, or 48% more.
Homeowners continue to “hunker down” in their homes, unwilling to move because of their current, underlying, locked-in, low fixed-rate mortgage. This trend has been easing from the lows established in 2023. In January, 2,588 homes were placed on the market in Orange County, 466 fewer than the 3-year average before COVID (2017-2019), 15% less. In 2025, 2,545 homes entered the market, compared to 2,054 in 2024, and 1,710 in 2023. A similar number of homes are coming on the market this year compared to last.
Demand
Demand surged by 38% in the past couple of weeks.
Demand, a snapshot of the number of new pending sales over the prior month, surged from 914 to 1,264 in the past couple of weeks, up 350 pending sales, or 38%, its lowest end-of-January reading since tracking began in 2004, yet very similar to 2024’s 1,290 pending sales reading. This two-week period is typically the steepest rise of the year. Today’s lower mortgage rates, nearly 1% lower than last year, are projected to boost demand in the coming weeks due to increased affordability. With more available choices and lower rates, it is a much more favorable environment for buyers than in the past several years.
Last year, demand was 1,340, with 76 additional pending sales, or 6% more. The 3-year average before COVID (2017 to 2019) was 2,083 pending sales, 65% more than today, or an additional 819.
As the Federal Reserve has indicated, it is essential to watch all economic releases for signs of slowing. That is the only path to lower mortgage rates at this time. These releases can cause mortgage rates to rise or fall, depending on how they compare with market expectations. It is anticipated that the latest partial government shutdown, which began on Saturday, will end on Tuesday, February 3rd. Nonetheless, it will impact government data and delay the release of this Friday’s January Jobs Report. Until this is officially resolved, everyone will turn their attention to the private sector. On Wednesday, the ADP Employment Change will be released, which could impact mortgage rates.
Expected Market Time
The market is heating up with a 26-day drop in market time.
With the supply of available homes rising by 117 homes, up 4%, and demand surging by 350 pending sales, up 38%, the Expected Market Time (the number of days it takes to sell all Orange County listings at the current buying pace) plunged from 101 to 75 days in the past couple of weeks, its fastest pace since April of last year.
Last year, it was 63 days, faster than today. The 3-year average before COVID (2017 to 2019) was 70 days, similar to today.
The Expected Market Time for condominiums and townhomes decreased from 90 to 83 days in the past two weeks. It was at 58 days last year. For detached homes, the Expected Market Time plunged from 105 to 70 days. It was 67 days a year ago, similar to today. The detached-home market is much faster than the attached-home market.
Luxury End
The luxury market has improved dramatically over the past couple of weeks.
In the past couple of weeks, the luxury inventory of homes priced above $2.5 million (the top 10% of the Orange County housing market) increased from 699 to 731 homes, up 32 or 5%. Luxury demand increased by 37 pending sales, up 35%, to 142. With demand skyrocketing while inventory rose only slightly, the Expected Market Time for luxury homes priced above $2 million plunged from 200 to 154 days, its fastest reading since March of last year. Expect the luxury market to continue to improve over the coming weeks.
Year over year, the active luxury inventory is down by 98 homes, or 12%, and luxury demand is up by 2 pending sales, or 1%. Last year’s Expected Market Time was 178 days, slower than today.
In the past two weeks, the Expected Market Time for homes priced between $2.5 million and $4 million decreased from 145 to 117 days. For homes priced between $4 million and $6 million, the Expected Market Time decreased from 249 to 170 days. For homes priced above $6 million, the Expected Market Time decreased from 365 to 267 days. Luxury is at 154 days overall. At this pace, a seller would be looking at becoming a pending sale around July 2026.
Orange County Housing Summary
- INVENTORY: The active listing inventory in the past couple of weeks increased by 117 homes, up 4%, and now stands at 3,179. Last year, there were 2,821 homes on the market, 358 fewer homes, or 11% less. The 3-year average before COVID (2017 to 2019) was 4,695, which is 48% higher. In January, 15% fewer homes came on the market than the 3-year average before COVID (2017 to 2019), 466 fewer. Only 43 more sellers came on the market this January compared to January of last year, 534 more than in 2024, and 878 more than in 2023.
- DEMAND: Buyer demand, the number of pending sales over the prior month, surged by 350 in the past two weeks, up 38%, and now stands at 1,264. Last year, there were 1,340 pending sales, 6% more than today. The 3-year average before COVID (2017 to 2019) was 2,083, which is 65% higher.
- MARKET TIME: With demand surging compared to the smaller rise in supply, the Expected Market Time, the number of days to sell all Orange County listings at the current buying pace, plunged from 101 to 75 days in the past couple of weeks. Nonetheless, it is the highest end-of-January level since 2019. Last year, it was 63 days, faster than today. The 3-year average before COVID (2017-2019) was 70 days, similar to today.
- LUXURY: In the past two weeks, the Expected Market Time for homes priced between $2.5 million and $4 million decreased from 145 to 117 days. For homes priced between $4 million and $6 million, the Expected Market Time decreased from 249 to 170 days. For homes priced above $6 million, the Expected Market Time decreased from 365 to 267 days.
- DISTRESSED HOMES: Short sales and foreclosures combined, comprised only 0.1% of all listings and 0.5% of demand. Two foreclosures and two short sales are available today in Orange County, bringing the total of distressed homes on the active market to four, down two from two weeks ago. Last year, seven distressed homes were on the market, similar to today.
- CLOSED SALES: There were 1,641 closed residential resales in December, nearly identical to December 2024’s 1,634 sales, and up 10% from November 2025. The sales-to-list price ratio in Orange County was 98.0%. Foreclosures accounted for 0.1% of all closed sales, and short sales accounted for 0.1%. That means that 99.8% of all sales were sellers with equity.
Have a great week.
Sincerely,
Steven Thomas
Quantitative Economics and Decision Sciences
Copyright 2026—Steven Thomas, Reports On Housing—All Rights Reserved. This report may not be reproduced in whole or in part without express written permission from the author.