January 19, 2026
It is officially the start of the Winter Market when buyer demand surges higher, inventory rises at a slower pace, and the market speeds up noticeably.
The Winter Market
After an exceptionally chilly start to the year, the Orange County housing market is about to heat up with soaring buyer demand.
So many are anticipating the return of the summer Olympics to Los Angeles in 2028. The opening ceremonies, track and field, swimming, basketball, soccer, gymnastics, cycling, volleyball, and a variety of other sports are all converging on Southern California in 2½ years. Just about everyone has their favorite. For those who want to attend one of the events in person, the presale registration opened up on January 14th at 7 a.m. There were over 1.5 million ticket registrations in the first 24 hours, the most in Olympic history. There was so much interest that wait times exceeded an hour. Demand for tickets surged, and the LA28 Olympic Committee expects to sell 14 million tickets, breaking the record set at the Paris 2024 Games.
Now that housing has reached mid-January, it feels like tickets just went on sale for buyers to tour houses, write offers, and secure their next home. While the Orange County housing market is not going to set any sales records, housing demand will surge higher over the next several weeks. Housing is transitioning from the Holiday Market, which runs from mid-November through the first couple of weeks of the New Year, the slowest time of the year with very little buyer activity, to the Winter Market, running from mid-January through mid-March, when buyer demand explodes higher. The supply of available homes increases, but at a slower pace than demand, leading the market to accelerate noticeably.
Regardless of the year or economic conditions, the housing market always improves dramatically starting in mid-January. Buyer demand (a snapshot of the number of new pending sales over the prior month) rockets higher. It started the Winter Market last year with 988 pending sales, and by mid-March, demand had grown to 1,665, an increase of 677, or 69%. In 2023, it jumped by 67%, and in 2024, it grew by 52%. The 3-year average before COVID (2017-2019) was a 47% rise.
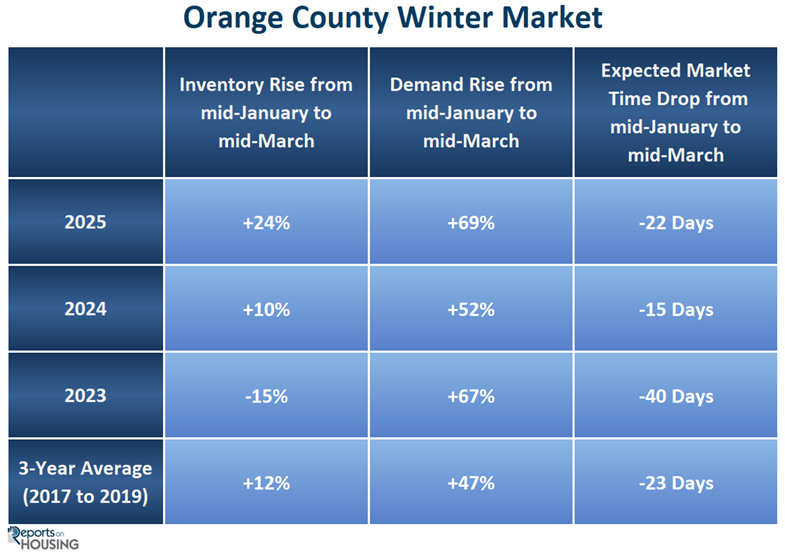
The supply of available homes, on the other hand, rises much more slowly than demand. The inventory to start the Winter Market last year was 2,759, and by mid-March, it had grown to 3,419, an increase of 660 homes, up 24%. In 2023, it dropped by 15%; in 2024, it rose by 10%. The 3-year average before COVID was a 12% increase.
With demand soaring while inventory climbs more slowly, the market accelerates rapidly from week to week. Last year, the Expected Market Time (the number of days it takes to sell all Orange County listings at the current buying pace) was 84 days in mid-January and decreased to 62 days in mid-March, a noticeable 22-day drop. In 2023, it plunged by 40 days, and in 2024, it dropped by 15 days. The 3-year average decline before COVID was 23 days.
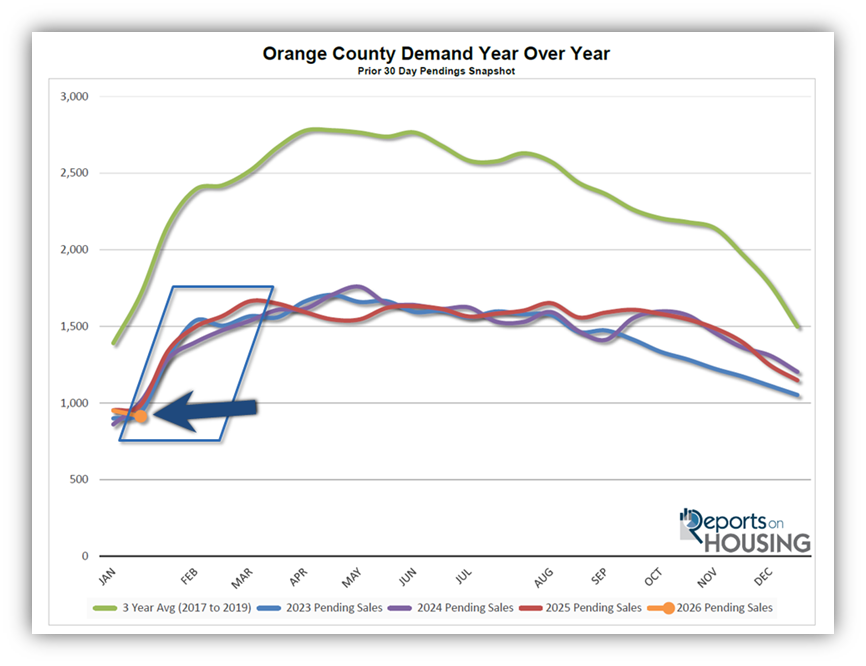
Demand will increase substantially from now through mid-March. Today’s 914 demand reading is the lowest since tracking began in 2004. It is very close to the 2023 level of 939 pending sales. The pre-pandemic average was 1,710, a sizable 87% more than today. Nonetheless, there willbe a lot more activity. An increasing number of buyers will begin searching for a home. The number of new prospective buyers will outpace the number of homes coming on the market, even at these muted levels.
Many wonder why the market improves so rapidly in January and February. It all boils down to supply and demand. The hordes of buyers who placed their home searching efforts on hold to enjoy the holidays reemerge and jump right back into the housing market in mid-January. With today’s lower mortgage rate environment, between 6% and 6.5% since September 3rd of last year, affordability has dramatically improved compared to 2025, when it was stuck above 7% to start the year. Today’s 6.07% rate is a whole percentage point better than last year’s 7.07%. In fact, rates have not been at these levels for a duration since the Federal Reserve began increasing the Federal Funds rate in 2022.
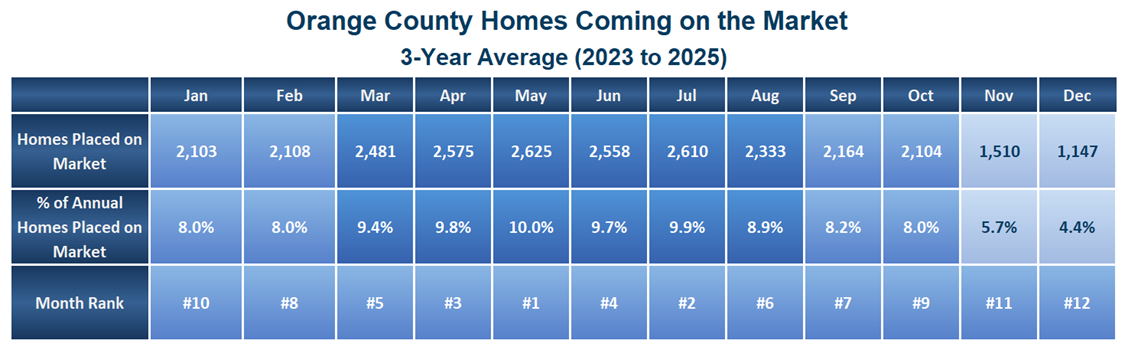
Yet, the inventory does not increase as rapidly as demand. Many sellers wait until the Spring Market, when demand hits its annual peak, the busiest time of the year. It is also when more homes are listed for sale. January and February are slower months for new sellers. January is the third-lowest month of the year for new FOR SALE signs, only behind November and December. February is not much different. The pace of homes coming on the market does not really accelerate until March, the start of spring.
The Winter Market has officially arrived. Buyers are finally back, and they are matched up with a limited number of available homes to start the year. Prepare for launch!
Active Listings
The inventory increased by 13% in the past couple of weeks.
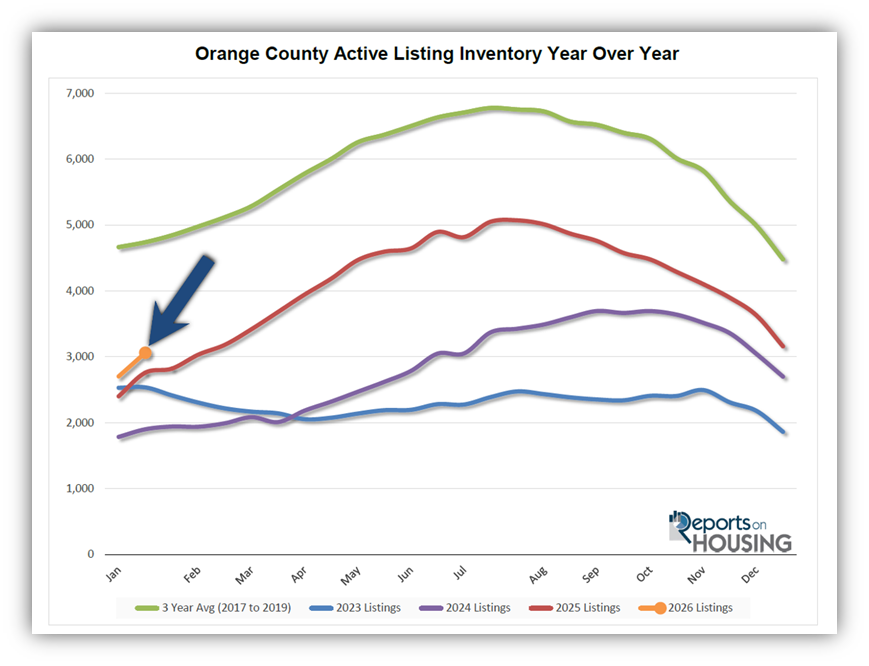
The active listing inventory increased by 359 homes in the past two weeks, up 13%, and now sits at 3,062, its highest mid-January level since 2020 when it reached 4,023. The two-week rise was higher than usual. The 3-year average rise before COVID (2017-2019) was 3% or 133 homes. The sharper increase also occurred last year and is most likely due to the large number of homes that delisted during the holiday, only to come back on over the past couple of weeks. Similar to last year, expect the rise over the next two weeks to be only slight as demand surges, making it much harder to build inventory for the remainder of January. The inventory should rise faster in February and continue growing until peaking sometime during the summer.
Last year, the inventory was at 2,759 homes, 10% lower, or 303 fewer. The 3-year average before COVID (2017 through 2019) was 4,665, an additional 1,962 homes, or 73% more.
Homeowners continue to “hunker down” in their homes, unwilling to move because of their current, underlying, locked-in, low fixed-rate mortgage. This trend has been easing from the lows established in 2023. Through December, 28,949 homes were placed on the market in Orange County, 10,215 fewer than the 3-year average before COVID (2017-2019), 26% less. In 2024, 26,860 homes entered the market, compared to 23,141 in 2023. More sellers opted to sell in 2025. Yet, fewer homes were placed on the market year over year from August through December. In December, 1,187 homes came on the market, 3.5% less than last year’s 1,230.
Demand
Demand decreased by 4% in the past couple of weeks.
Demand, a snapshot of the number of new pending sales over the prior month, decreased from 951 to 914 in the past couple of weeks, down 37 pending sales, or 4%. The two-week drop was highly unusual. Last year it rose by 4%, and in 2024 it jumped by 17%. That is all about to change as buyers finally reemerge from their holiday slumber. Expect demand to surge over the next several weeks, far outpacing the rise in inventory. It will continuously rise until peaking between April and May. It will be interesting to see the year-over-year demand difference as momentum builds and mortgage rates remain substantially lower than they were at this time last year.
Last year, demand was 988, with 74 additional pending sales, or 8% more. The 3-year average before COVID (2017 to 2019) was 1,634 pending sales, 79% more than today, or an additional 720.
As the Federal Reserve has indicated, it is essential to watch all economic releases for signs of slowing. That is the only path to lower mortgage rates at this time. These releases can cause mortgage rates to rise or fall, depending on how they compare with market expectations. This week marks the release of the S&P Global Manufacturing and Services Purchasing Managers Index (PMI), which tracks the strength of the U.S. manufacturing and services sectors. Next week, the Federal Reserve meets and will conduct a press conference to announce its decision on the Federal Funds rate. Finally, the Personal Consumption Expenditures – Price Index (PCE), the Fed’s preferred inflation gauge, will be released on Friday, January 30th.
Expected Market Time
The market has cooled substantially over the past couple of weeks.
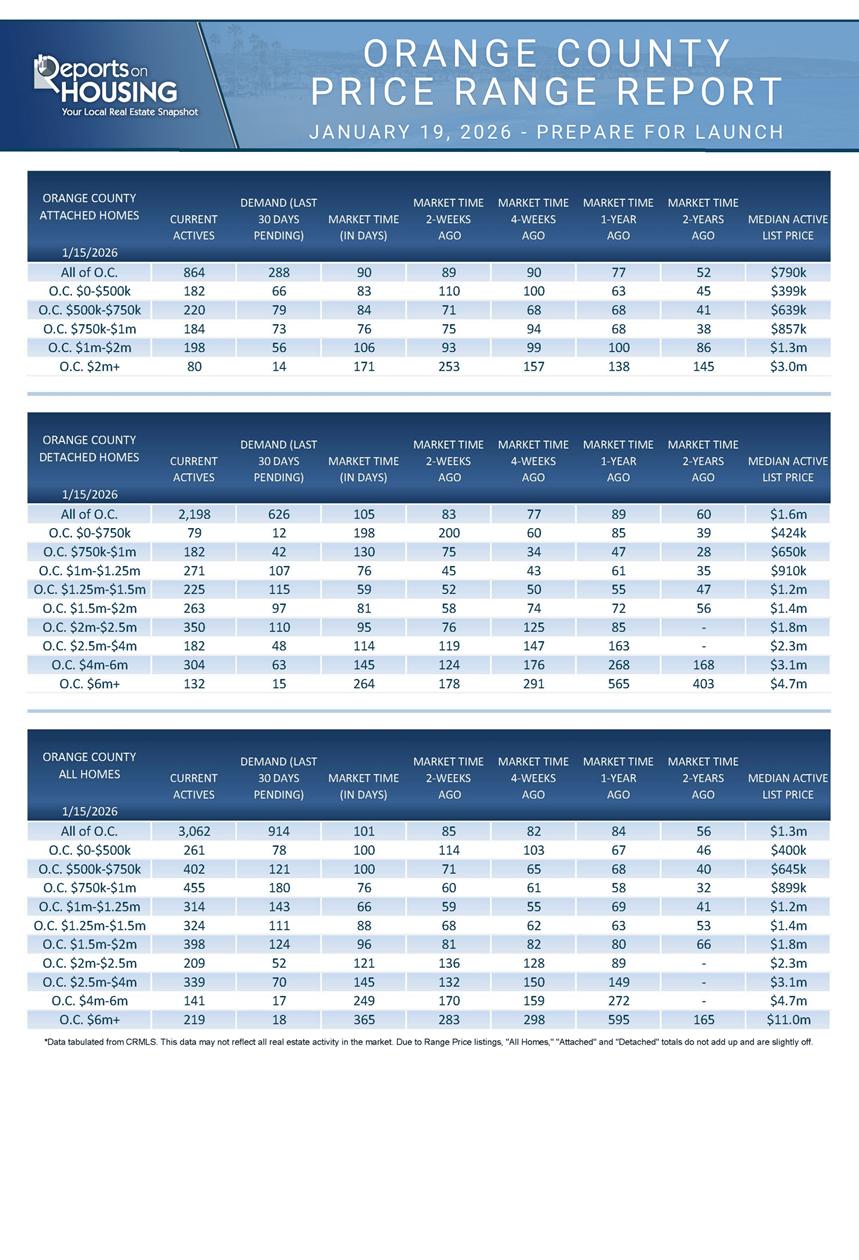
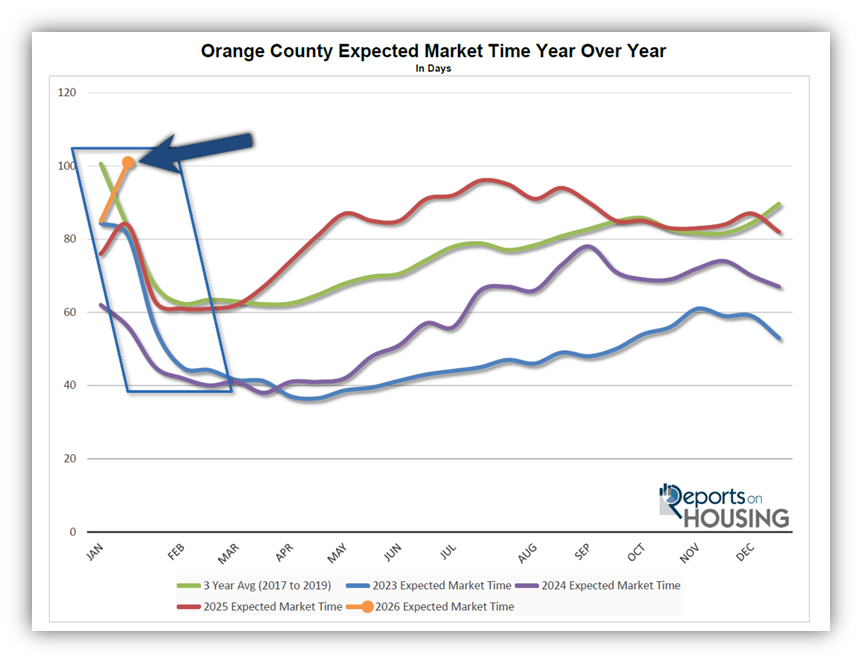
With the supply of available homes rising by 359 homes, up 13%, and demand dropping by 37 pending sales, down 4%, the Expected Market Time (the number of days it takes to sell all Orange County listings at the current buying pace) jumped from 85 to 101 days in the past couple of weeks. It is the highest mid-January level since 2019.
Last year, it was 84 days, faster than today. The 3-year average before COVID (2017 to 2019) was 88 days, much quicker than today.
The Expected Market Time for condominiums and townhomes increased from 89 to 90 days in the past two weeks. It was at 77 days last year. For detached homes, the Expected Market Time increased from 83 to 105 days. It was 89 days a year ago, faster than today. In a reversal, the detached-home market is slower than the attached-home market.
Luxury End
The luxury market slowed considerably in the past couple of weeks.
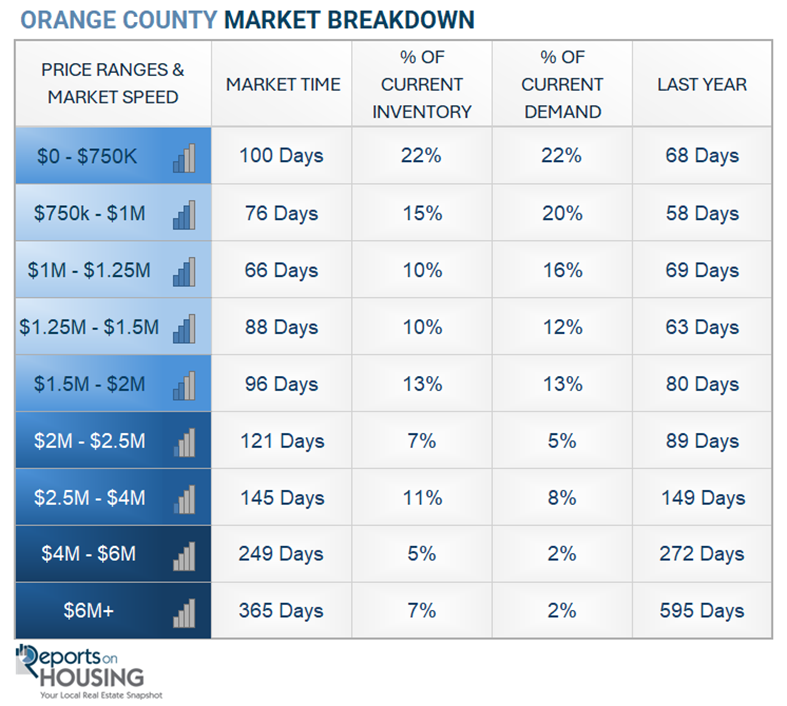
In the past couple of weeks, the luxury inventory of homes priced above $2.5 million (the top 10% of the Orange County housing market) increased from 632 to 699 homes, up 67 or 151. Luxury demand decreased by eight pending sales, down 7%, and now sits at 105, its lowest level since the start of January 2025. With inventory rising and demand falling, the Expected Market Time for luxury homes priced above $2 million increased from 168 to 200 days, the highest since September. Expect substantial improvement each week for the next six weeks.
Year over year, the active luxury inventory is down by 38 homes or 5%, and luxury demand is up by eight pending sales or 8%. Last year’s Expected Market Time was 228 days, slower than today.
In the past two weeks, the Expected Market Time for homes priced between $2.5 million and $4 million increased from 132 to 145 days. For homes priced between $4 million and $6 million, the Expected Market Time increased from 170 to 249 days. For homes priced above $6 million, the Expected Market Time increased from 283 to 365 days. Luxury is at 200 days overall. At this pace, a seller would be looking at becoming a pending sale around August 2026.
Orange County Housing Summary
- INVENTORY: The active listing inventory in the past couple of weeks increased by 359 homes, up 13%, and now stands at 3,062. Last year, there were 2,759 homes on the market, 303 fewer homes, or 10% less. The 3-year average before COVID (2017 to 2019) was 4,640, which is 52% higher. From January through December, 26% fewer homes came on the market compared to the 3-year average before COVID, 10,215 less. Yet 2,089 more sellers came on the market this year than last year, and 5,808 more than in 2023.
- DEMAND: Buyer demand, the number of pending sales over the prior month, decreased by 37 in the past two weeks, down 4%, and now stands at 914. Last year, there were 988 pending sales, 8% more than today. The 3-year average before COVID (2017 to 2019) was 1,634, which is 79% higher.
- MARKET TIME: With the supply rising and demand falling, the Expected Market Time, the number of days to sell all Orange County listings at the current buying pace, increased from 85 to 101 days in the past couple of weeks. It is the highest mid-January level since 2019. Last year, it was 84 days, faster than today. The 3-year average before COVID (2017-2019) was 88 days, quicker than today.
- LUXURY: In the past two weeks, the Expected Market Time for homes priced between $2.5 million and $4 million increased from 132 to 145 days. For homes priced between $4 million and $6 million, the Expected Market Time increased from 170 to 249 days. For homes priced above $6 million, the Expected Market Time increased from 283 to 365 days.
- DISTRESSED HOMES: Short sales and foreclosures combined, comprised only 0.2% of all listings and 0.7% of demand. Three foreclosures and three short sales are available today in Orange County, bringing the total of distressed homes on the active market to six, up one from two weeks ago. Last year, six distressed homes were on the market, similar to today.
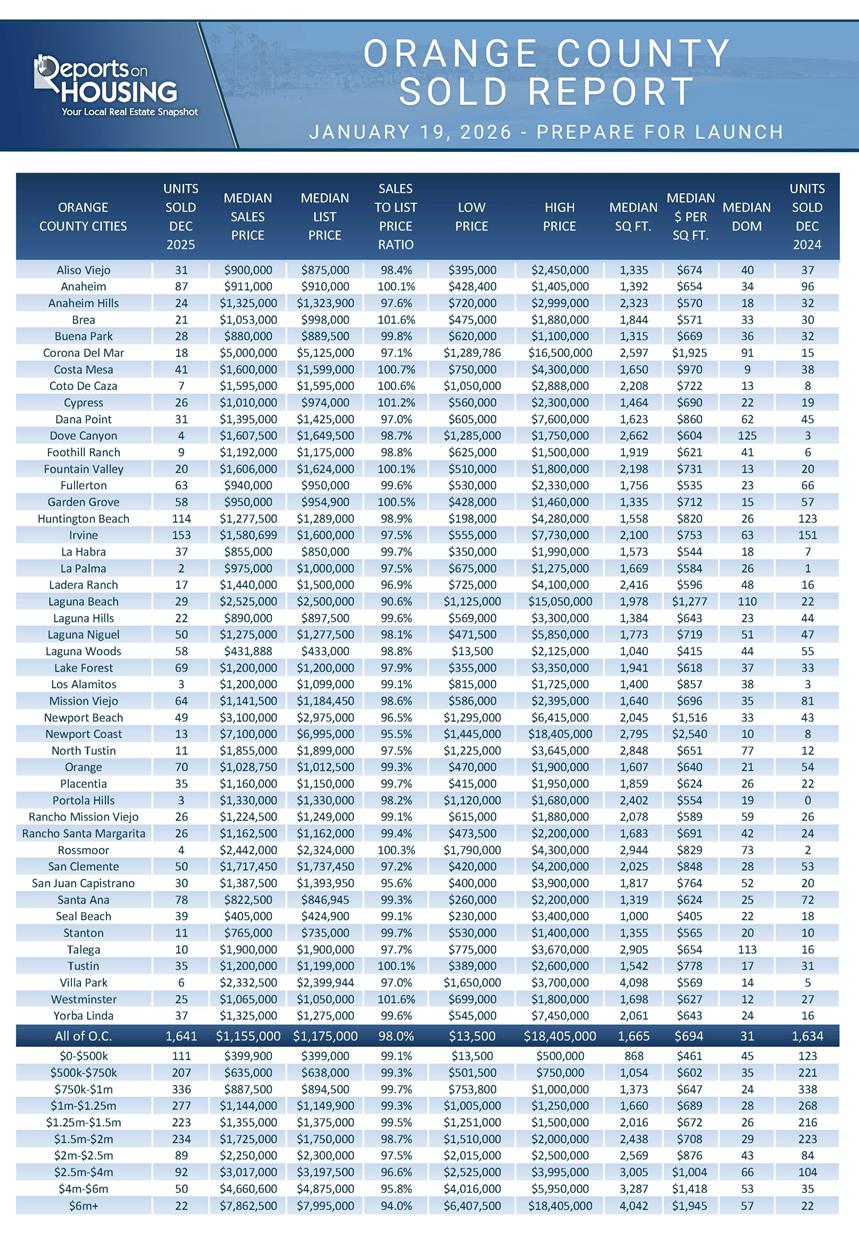
- CLOSED SALES: There were 1,641 closed residential resales in November, nearly identical to December 2024’s 1,634 sales, and up 10% from November 2025. The sales-to-list price ratio in Orange County was 98.0%. Foreclosures accounted for 0.1% of all closed sales, and short sales accounted for 0.1%. That means that 99.8% of all sales were sellers with equity.
Have a great week.
Sincerely,
Steven Thomas
Quantitative Economics and Decision Sciences
Copyright 2026—Steven Thomas, Reports On Housing—All Rights Reserved. This report may not be reproduced in whole or in part without express written permission from the author.