January 5, 2026
This year’s start is the slowest start to a year since 2019, yet the lower mortgage rate environment and improved affordability has the ability to jumpstart demand in 2026.
The 2026 Start
With the highest inventory at the start of the year since 2020, the market is the slowest since 2019.
Trader Joe’s Chocolate Croissants have become a popular breakfast choice for shoppers. Their description showcases how they sell so many: “Made with creamy butter and filled with rich, semisweet Belgian chocolate, Trader Joe’s Chocolate Croissants bring high-end bakery quality to your home kitchen with minimal effort.” They are initially frozen solid. After placing them on a cookie sheet and allowing them to proof overnight, many wonder how in the world the small, hard squares will turn into something edible. After an hour, they do not change at all and remain frozen. Something magical happens by morning. They triple in size! After popping them into the oven for 20 minutes and letting them cool for 10, the flaky croissant filled with chocolate goo is ready to eat. They are perfect!
This year is exceptionally chilly with the coldest start since 2019, when the Expected Market Time (the number of days it takes to sell all Orange County listings at the current buying pace) reached 152 days. Today’s 85-day Expected Market Time reading is similar to 2017 (84 days), 2020 (82 days), and 2023 (84 days). The speed of the market is determined by supply and demand. Demand has not changed much over the past several years, ever since the Federal Reserve rapidly increased the Federal Funds Rate for 11 consecutive meetings between 2022 and 2023. Demand has been muted due to affordability constraints. The big annual difference in speed has come on the supply side.
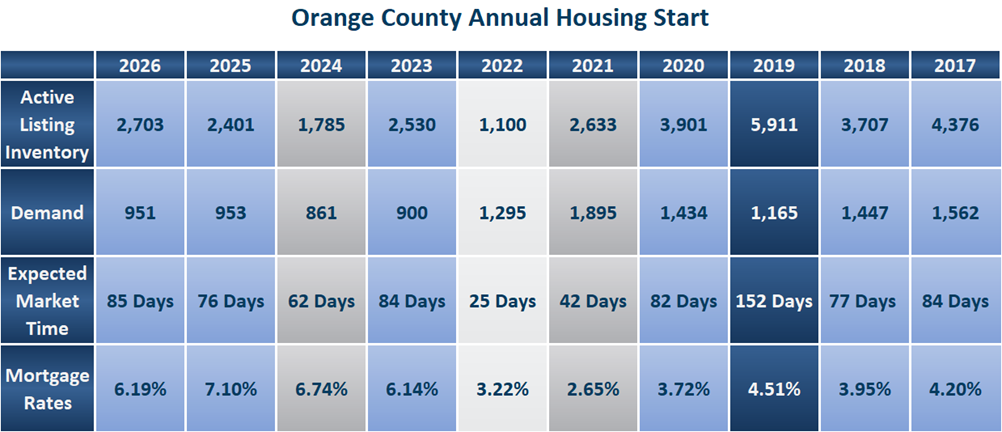
When mortgage rates climbed from 3.25% in January 2022 to 7.37% by October of the same year, not only did demand plunge, but the number of homeowners willing to sell their homes plunged as well. Homeowners “hunkered down” in their homes, unwilling to move due to their current, underlying, locked-in, low fixed-rate mortgage. In 2023, there were 41% fewer FOR SALE signs than the 3-year average before the pandemic (2017 to 2019). As a result, the inventory bucked tradition and did not start to grow until late April. That year, the inventory did not grow much, with far fewer sellers. That resulted in a very low inventory to start 2024, only 1,785 homes. In 2024, there were 31% fewer FOR SALE signs than the 3-year average. That meant that there were 3,719 additional sellers in 2024 compared to 2023. The inventory grew at a faster pace in 2024, as the extra homeowners were matched up against similar year-over-year demand. Consequently, in 2025, the inventory started at 2,401 homes, up 35% over 2024. In 2025, there were 26% fewer FOR SALE signs than the 3-year average. That meant that there were 2,089 additional sellers in 2025 compared to 2024, and 5,808 more than in 2023. The inventory in 2025 grew at an even faster rate as the additional signs were matched up against unyielding, low demand.
Many expect 2026 to be a similar story, with even more FOR SALE signs than last year, pitted against unchanging demand. They are partly correct; there will be more homeowners selling this year. But buyer demand will begin to thaw if mortgage rates remain between 6% and 6.5% over the Winter and Spring Markets, from mid-January through the start of June. The lower the rate, the larger the increase in year-over-year demand. From 2023 to 2025, mortgage rates have not fallen between 6% and 6.5% for a substantial period during the winter and spring. In 2023, from January 5th to February 9th, 36 days, rates were cooperating, but they quickly reversed course and breached 7% by March 2nd. And, the Federal Reserve was cranking up the Federal Funds rate in the background with four quarter-point increases in February, March, May, and July. In 2024 and 2025, mortgage rates remained above 6.5% throughout the Winter and Spring Markets.
Today, mortgage rates are at 6.19% according to Mortgage News Daily. They have remained below 6.5% for 124 days since September 3rd, the longest period since the Federal Reserve finished raising the Federal Funds Rate in July 2023. Most housing economists project that rates will remain between 6% and 6.5% for the year, meaning that the lower mortgage rate environment will match up with the Winter and Spring Markets, allowing demand to improve due to increased affordability. That is assuming that the job market will remain weak and inflation does not suddenly spike higher. In fact, there is a case to be made that the job market may break in the coming months. If that occurs, the Federal Reserve will change its tune and indicate more rate cuts to come. Subsequently, mortgage rates would fall between 5.75% and 6%, and demand will rise even higher year-over-year.
The Orange County housing market remains rate-sensitive. As mortgage rates migrate higher, demand slows, and the market speed slows. When rates fall, affordability improves, demand rises, and the housing market speeds up. A buyer looking at a $5,000 per month payment (principal and interest only with 20% down) can afford a $940,000 home at 7%. At 6.25%, it increases to $1,015,000. At 5.5%, it increases to $1,101,250. Lower rates are the key to unlocking an increase in demand.
ATTENTION BUYERS: Do NOT be fooled by the sluggish housing market at the start of the year. In January, the inventory will grow week over week, but buyer demand will grow at a faster pace. There will be increased competition among buyers, especially in the entry-level price range. The market will continue to pick up steam from now through mid-March. There are very few sellers who are desperate to sell, especially with the dawn of a new year and the anticipation of the Spring Market, the best time of the year to sell. Unlike post-holiday retail shopping, this is not the time of year to search for a “deal.”
ATTENTION SELLERS: Even if demand increases, it still boils down to proper pricing. Today’s buyers are savvy and understand value. They scrutinize every photo and soak in all the details: bedrooms, bathrooms, square footage, condition, upgrades, location, lot size, amenities, year built, garages, storage, view, etc. Yet, price is the most critical factor. It is the differentiator between a buyer choosing to see the home in person or waiting for the next home to hit the market. A realistic price will allow a seller to attract immediate interest. Overprice and waste valuable market time with far less activity before ultimately reducing. Sellers only get one shot at a first impression, so analyze every recent comparable pending and closed sale to properly arrive at an accurate price.
Active Listings
The inventory plunged by 14% to ring in a New Year.
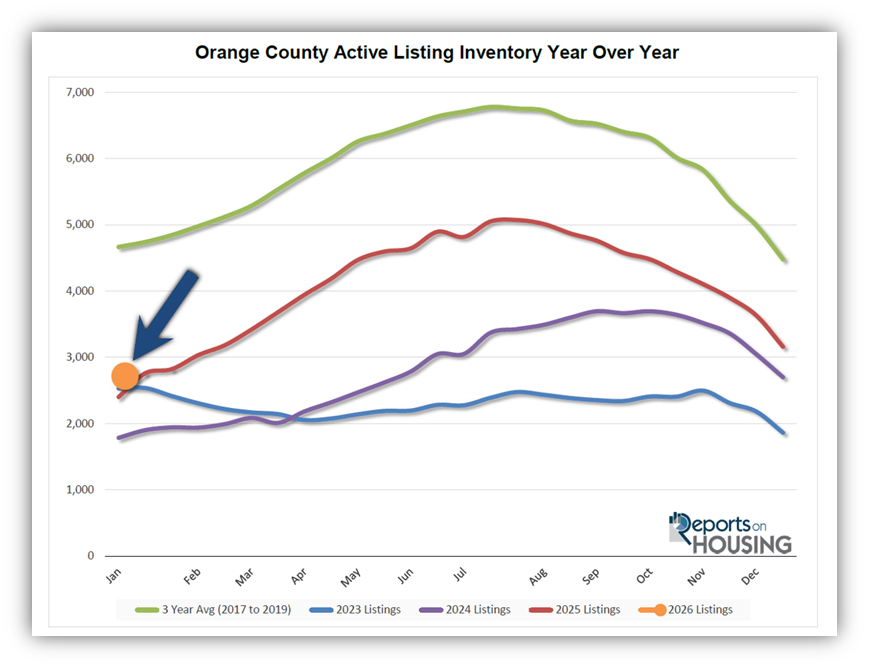
The active listing inventory decreased by 456 homes in the past two weeks, down 14%, and now sits at 2,703, its lowest level since the beginning of January 2025. Within the last month, the inventory has shed 926 homes, down 26%, a cyclical phenomenon as the year closes out. The inventory plunges during the Holiday Market through the end of December due to the fewest homes coming on the market in December and plenty of unsuccessful sellers who throw in the towel to enjoy the holidays. Nonetheless, it was 13% higher than last year’s 2,401 home start, and the highest beginning to a year since 2020 (3,901). Expect the inventory to grow methodically from week to week throughout the Winter and Spring Markets, and then eventually peak during the Summer Market between July and August.
Last year, the inventory was at 2,703 homes, 11% lower, or 302 fewer. The 3-year average before COVID (2017 through 2019) was 4,665, an additional 1,962 homes, or 73% more.
Homeowners continue to “hunker down” in their homes, unwilling to move because of their current, underlying, locked-in, low fixed-rate mortgage. This trend has been easing from the lows established in 2023. Through December, 28,949 homes were placed on the market in Orange County, 10,215 fewer than the 3-year average before COVID (2017-2019), 26% less. In 2024, 26,860 homes entered the market, compared to 23,141 in 2023. More sellers opted to sell in 2025. Yet, fewer homes were placed on the market year over year from August through December. In December, 1,187 homes came on the market, 3.5% less than last year’s 1,230.
Demand
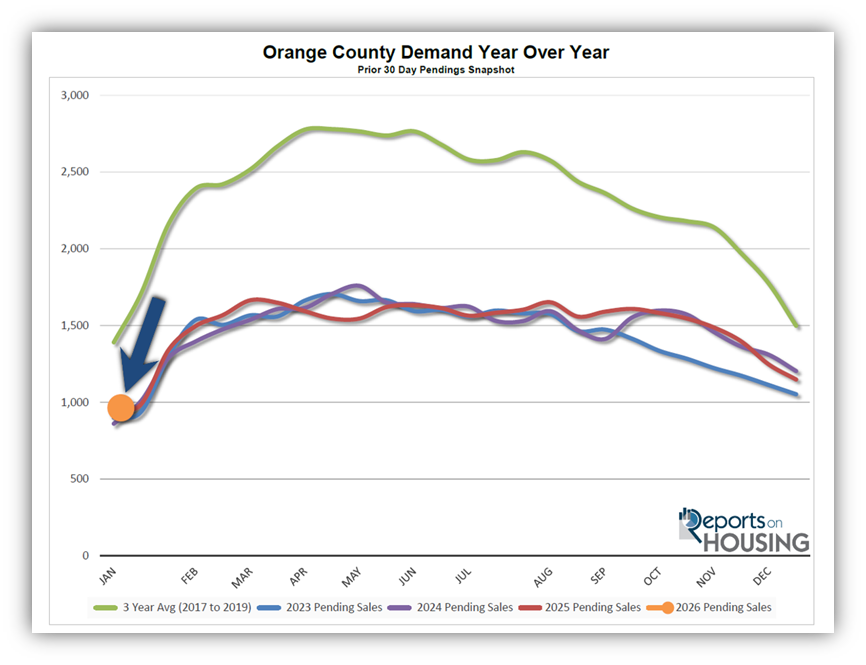
Demand plunged by 17% in the past couple of weeks.
Demand, a snapshot of the number of new pending sales over the prior month, plunged from 1,149 to 951 in the past couple of weeks, down 198 pending sales, or 17%. Since tracking began in 2004, only 2023 and 2024 were slightly lower. During the Holiday Market, from the week before Thanksgiving through the first couple of weeks of January, demand falls. Demand typically plunges at the end of December, and the last two weeks were the largest two-week drop. Today’s reading will be the lowest of the year. Since the market is very interest rate-sensitive, it will be interesting to watch how buyers respond to today’s more favorable mortgage rate environment. It has been below 6.5% since September 3rd, 124 consecutive days, the longest period since August 2022, when the Federal Reserve was in the process of increasing the Federal Funds Rate. There is strong potential for demand to rise substantially higher than last year, but rates need to remain between 6% and 6.5% or drop further during the Spring and Summer Markets. Expect demand to rise substantially through mid-February, then increase slowly until peaking in April or May.
As the Federal Reserve has indicated, it is essential to watch all economic releases for signs of slowing. That is the only path to lower mortgage rates at this time. These releases can cause mortgage rates to rise or fall, depending on how they compare with market expectations. This week is jobs week, which includes the number of job openings, wages, and the number of jobs created or lost, one of the month’s most important economic data points. Next week, the Consumer Price Index (CPI) and the Producer Price Index (PPI) will be released, two key indicators of inflation. It will be a pivotal two weeks for mortgage rates.
Last year, demand was 953, with two additional pending sales, nearly identical to today. The 3-year average before COVID (2017 to 2019) was 1,349 pending sales, 42% more than today, or an additional 398.
Expected Market Time
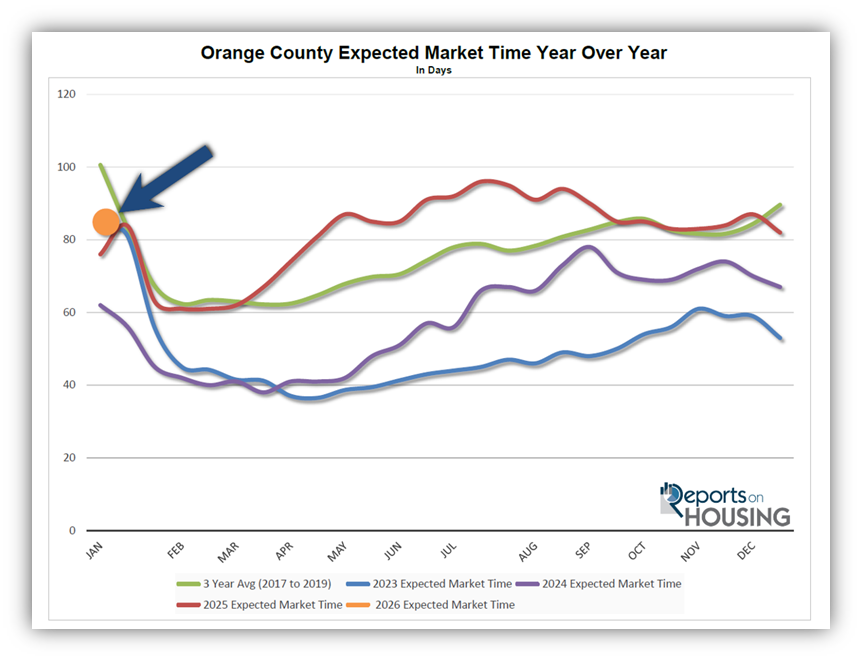
The market continued to cool over the past couple of weeks.
With the supply of available homes falling by 456 homes, down 14%, and demand dropping by 198 pending sales, down 17%, the Expected Market Time (the number of days it takes to sell all Orange County listings at the current buying pace) increased from 82 to 85 days in the past couple of weeks. It is the highest start to January since 2020.
Last year, it was 76 days, faster than today. The 3-year average before COVID (2017 to 2019) was 104 days, slower than today.
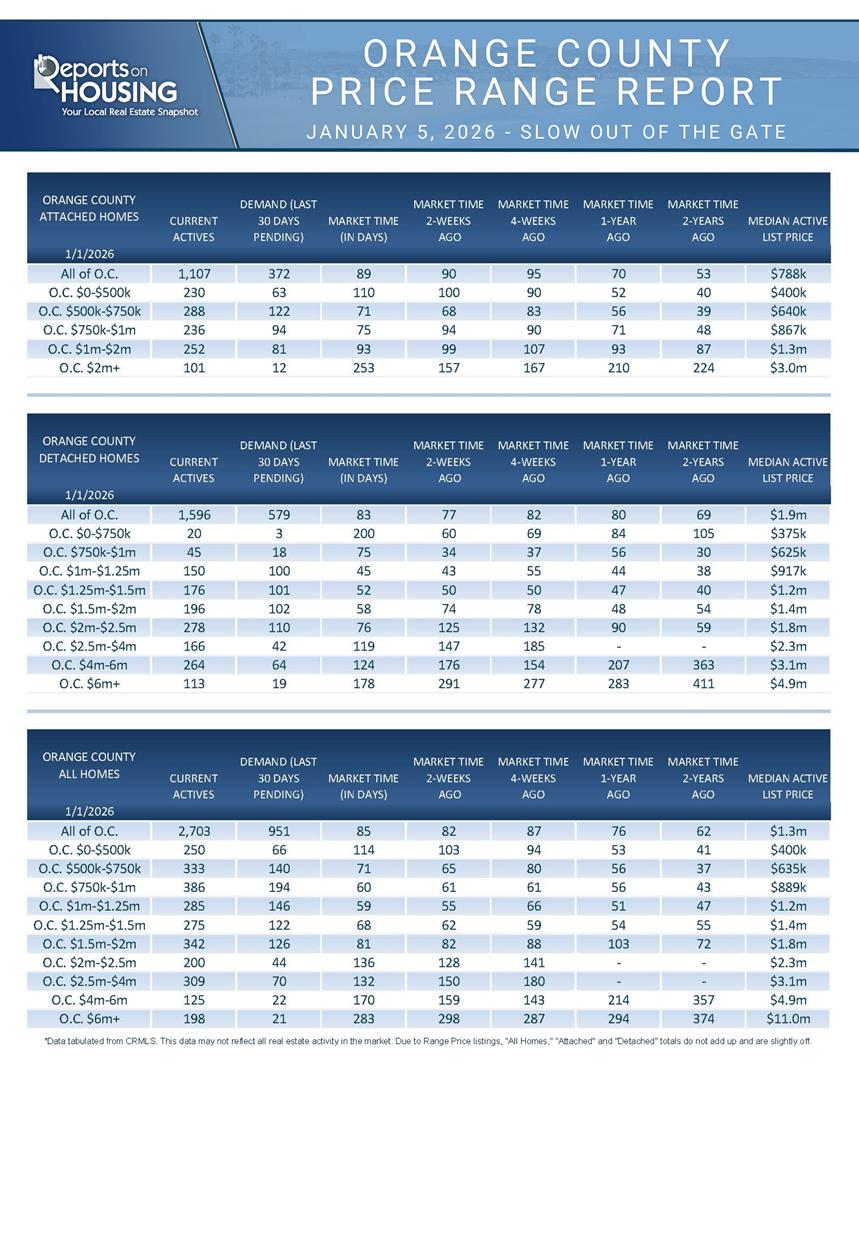
The Expected Market Time for condominiums and townhomes decreased from 90 to 89 days in the past two weeks. It was at 70 days last year. For detached homes, the Expected Market Time increased from 77 to 83 days. It was 80 days a year ago, similar to today. The detached-home market remains stronger than the attached-home market.
Luxury End
The luxury market slowed significantly in the past couple of weeks.
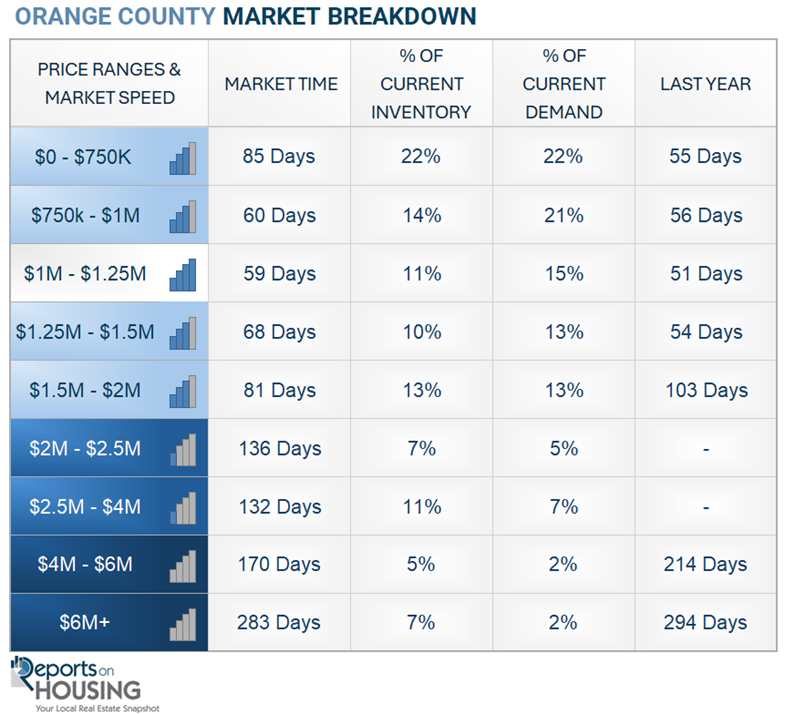
In the past couple of weeks, the luxury inventory of homes priced above $2.5 million (the top 10% of the Orange County housing market) decreased from 741 to 632 homes, down 109 or 15%. Luxury demand plunged by 10 pending sales, down 8%, and now sits at 113, its lowest level since the start of January 2025. With the inventory falling much faster than demand, the Expected Market Time for luxury homes priced above $2 million decreased from 181 to 168 days. The luxury market will improve extensively over the next couple of months.
In the past two weeks, the Expected Market Time for homes priced between $2.5 million and $4 million decreased from 150 to 132 days. For homes priced between $4 million and $6 million, the Expected Market Time increased from 159 to 170 days. For homes priced above $6 million, the Expected Market Time decreased from 298 to 283 days. Luxury is at 168 days overall. At this pace, a seller would be looking at becoming a pending sale around June 2026.
Orange County Housing Summary
- INVENTORY: The active listing inventory in the past couple of weeks plunged by 456 homes, down 14%, and now stands at 2,703. Last year, there were 2,401 homes on the market, 302 fewer homes, or 11% less. The 3-year average before COVID (2017 to 2019) was 4,665, which is 73% higher. From January through December, 26% fewer homes came on the market compared to the 3-year average before COVID, 10,215 less. Yet 2,089 more sellers came on the market this year than last year, and 5,808 more than in 2023.
- DEMAND: Buyer demand, the number of pending sales over the prior month, sank by 198 in the past two weeks, down 17%, and now stands at 951. Last year, there were 953 pending sales, similar to today. The 3-year average before COVID (2017 to 2019) was 1,349, which is 42% higher.
- MARKET TIME: With demand falling faster than supply, the Expected Market Time, the number of days to sell all Orange County listings at the current buying pace, increased from 82 to 85 days in the past couple of weeks. It is the highest start to a year since 2019. Last year, it was 76 days, faster than today. The 3-year average before COVID (2017-2019) was 104 days, more than today.
- LUXURY: In the past two weeks, the Expected Market Time for homes priced between $2.5 million and $4 million decreased from 150 to 132 days. For homes priced between $4 million and $6 million, the Expected Market Time increased from 159 to 170 days. For homes priced above $6 million, the Expected Market Time decreased from 298 to 283 days.
- DISTRESSED HOMES: Short sales and foreclosures combined, comprised only 0.2% of all listings and 0.6% of demand. Three foreclosures and two short sales are available today in Orange County, bringing the total of distressed homes on the active market to five, down two from two weeks ago. Last year, six distressed homes were on the market, similar to today.
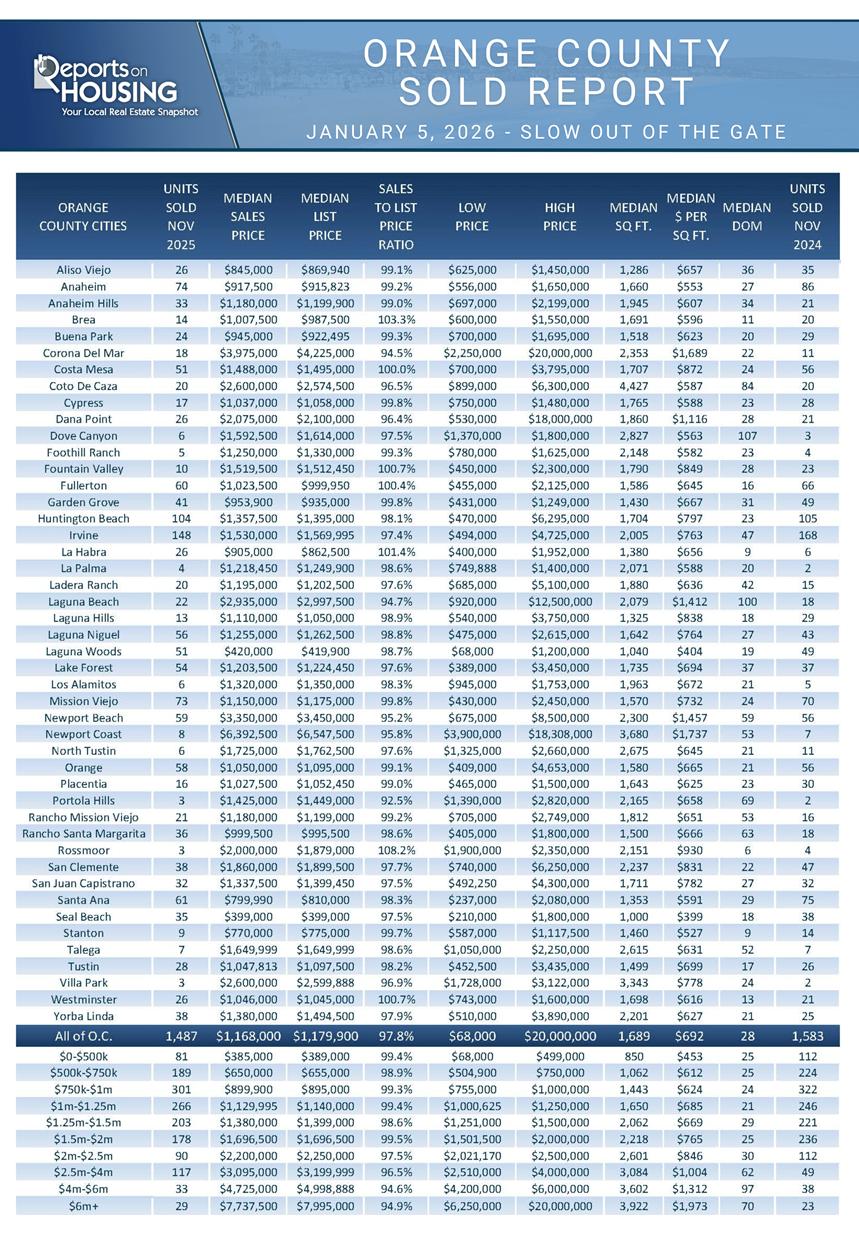
- CLOSED SALES: There were 1,487 closed residential resales in November, 6% lower than November 2024’s 1,583 sales, and down 23% from October 2025. The sales-to-list price ratio in Orange County was 97.8%. Foreclosures accounted for 0.1% of all closed sales, and short sales accounted for 0.1%. That means that 99.8% of all sales were sellers with equity.
Sincerely,
Steven Thomas
Quantitative Economics and Decision Sciences
Copyright 2026—Steven Thomas, Reports On Housing—All Rights Reserved. This report may not be reproduced in whole or in part without express written permission from the author.