December 22, 2025
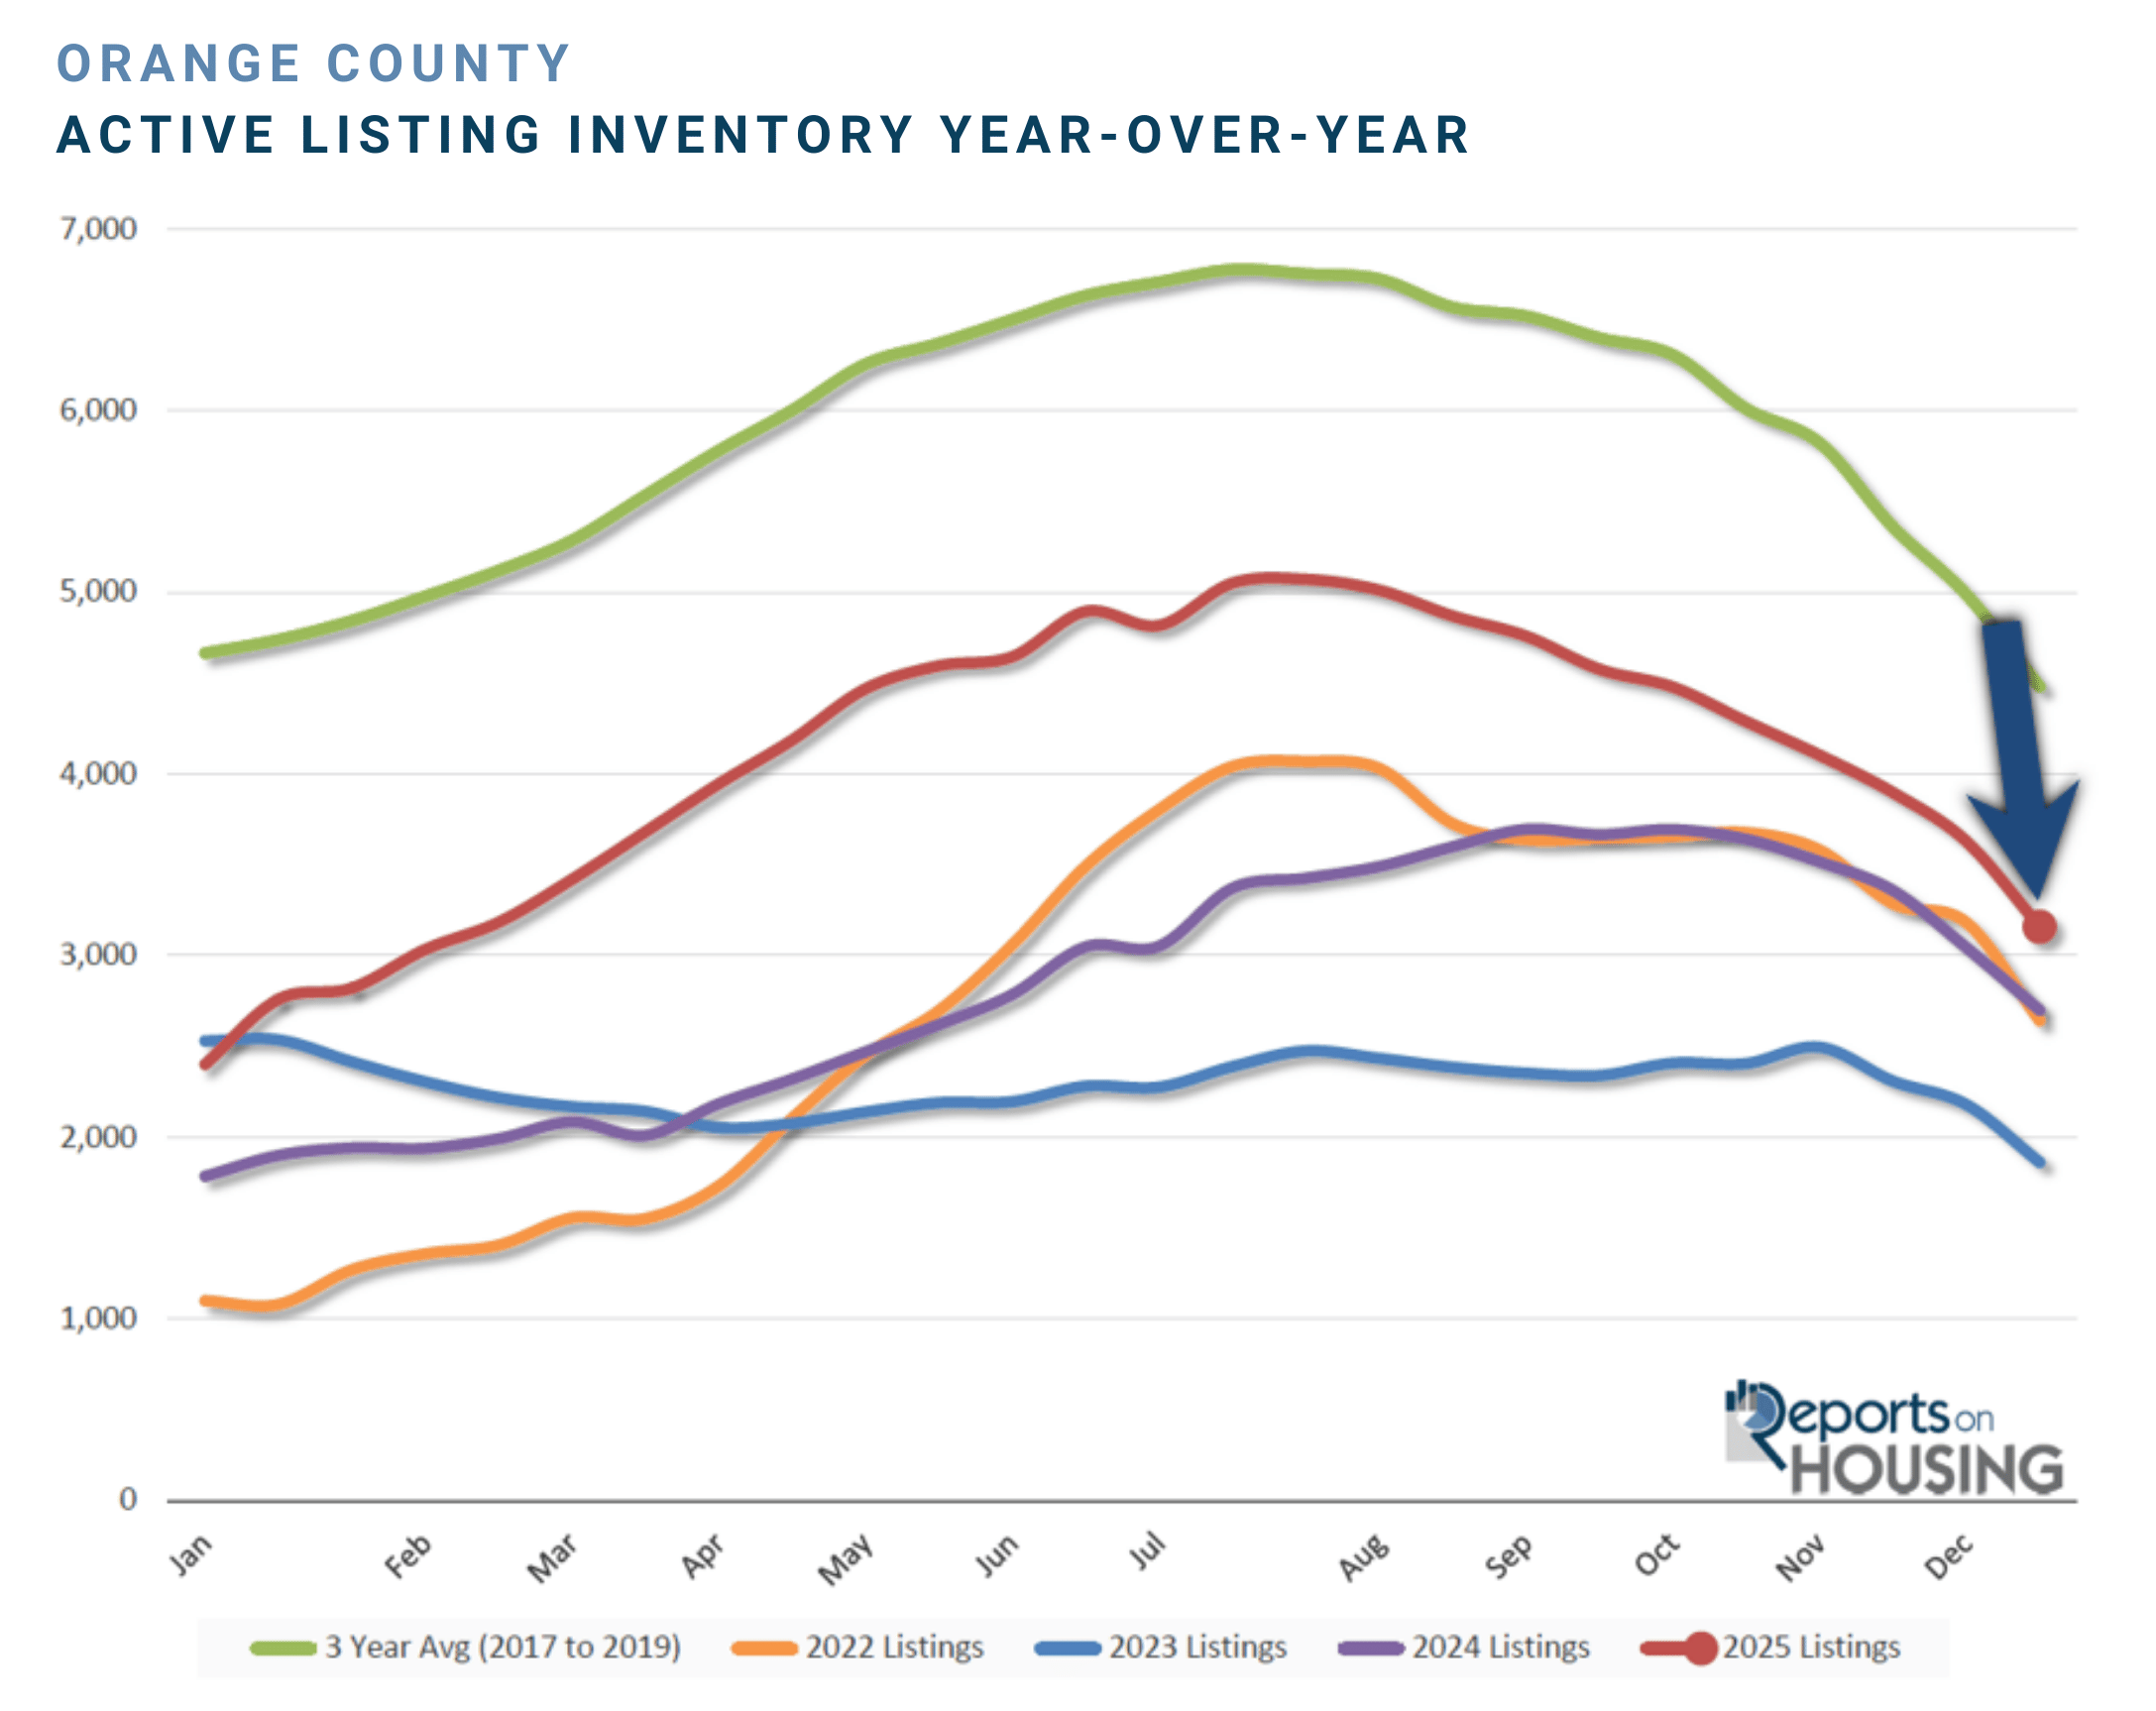
ACTIVE INVENTORY
THE INVENTORY CLIMBED TO ITS HIGHEST LEVEL SINCE 2019 AND EXPERIENCED ITS FIRST NORMAL SUMMER PEAK IN YEARS.
The year started with an active inventory of 2,343 homes, the third-lowest level at the start of a year since tracking began in 2004, behind only 2022 and 2023. The average start before the pandemic (2017 to 2019) was 4,500 homes, a considerable 92% higher. The limited supply has defined the Orange County housing market for years now. Yet in 2025, the number of available homes blossomed, growing by 116% to an end-of-July peak of 5,071 homes, its highest peak since 2019’s 7,601 homes. The annual peak typically occurs between July and August, but over the past couple of years, it has been delayed due to higher rates in the fall.
From July until the year’s end, the number of available homes dropped by 38% to 3,159. The end of 2025 was 29% below the 3-year average end-of-December (2017 to 2019) of 4,479. The beginning of 2026 will be the highest start since 2020, with about 3,000 available homes to purchase.
Homeowners have continued to “hunker down” in their homes ever since mortgage rates skyrocketed higher in 2022 from 3.25% in January to 7.37% in October of the same year. They have been unwilling to move because of their current, underlying, locked-in, low fixed-rate mortgage. A substantial 79% of California homeowners with a loan enjoy a fixed rate at or below 5% (Q2-2025). 63% are at or below 4%, and 28% have a rate at or below 3%. Yet the hunkering-down trend has been easing annually since 2023. Homeowners are tired of waiting for rates to fall so that they can sell and buy a new home. It has been 40 months since rates were last below 6% in August 2022. In 2025, through November, there have been 2,131 additional FOR-SALE signs compared to 2024 (8% more), and 5,643 more than 2023 (26% more). There are 26% fewer signs than the 3-year average, or 9,909 less.
These additional sellers have been matched against demand that has not changed much over the past three years. The extra sellers have accumulated and languished on the market; thus, the higher inventory levels. Nonetheless, the active inventory remains below pre-COVID levels.
DEMAND
DEMAND HAS NOT CHANGED MUCH OVER THE PAST FEW YEARS.
Demand for Orange County homes (a snapshot of new pending sales over the prior month) followed the typical seasonal pattern. Still, it was severely muted once again due to the higher-mortgage-rate environment. While the Spring Market saw the strongest demand, demand did not change much through September.
At the beginning of the year, demand for Orange County homes looked much like the subdued start to 2023 and 2024, with only 953 pending sales. It was slightly higher than 2023’s 900 pending sale start, and 2024’s 861. It was down 31% from the 3-year average before COVID (2017 to 2019), at 1,391. Demand has been muted because higher rates severely impacted home affordability. Considering mortgage rates, home values, and household incomes, affordability has remained at historic lows.
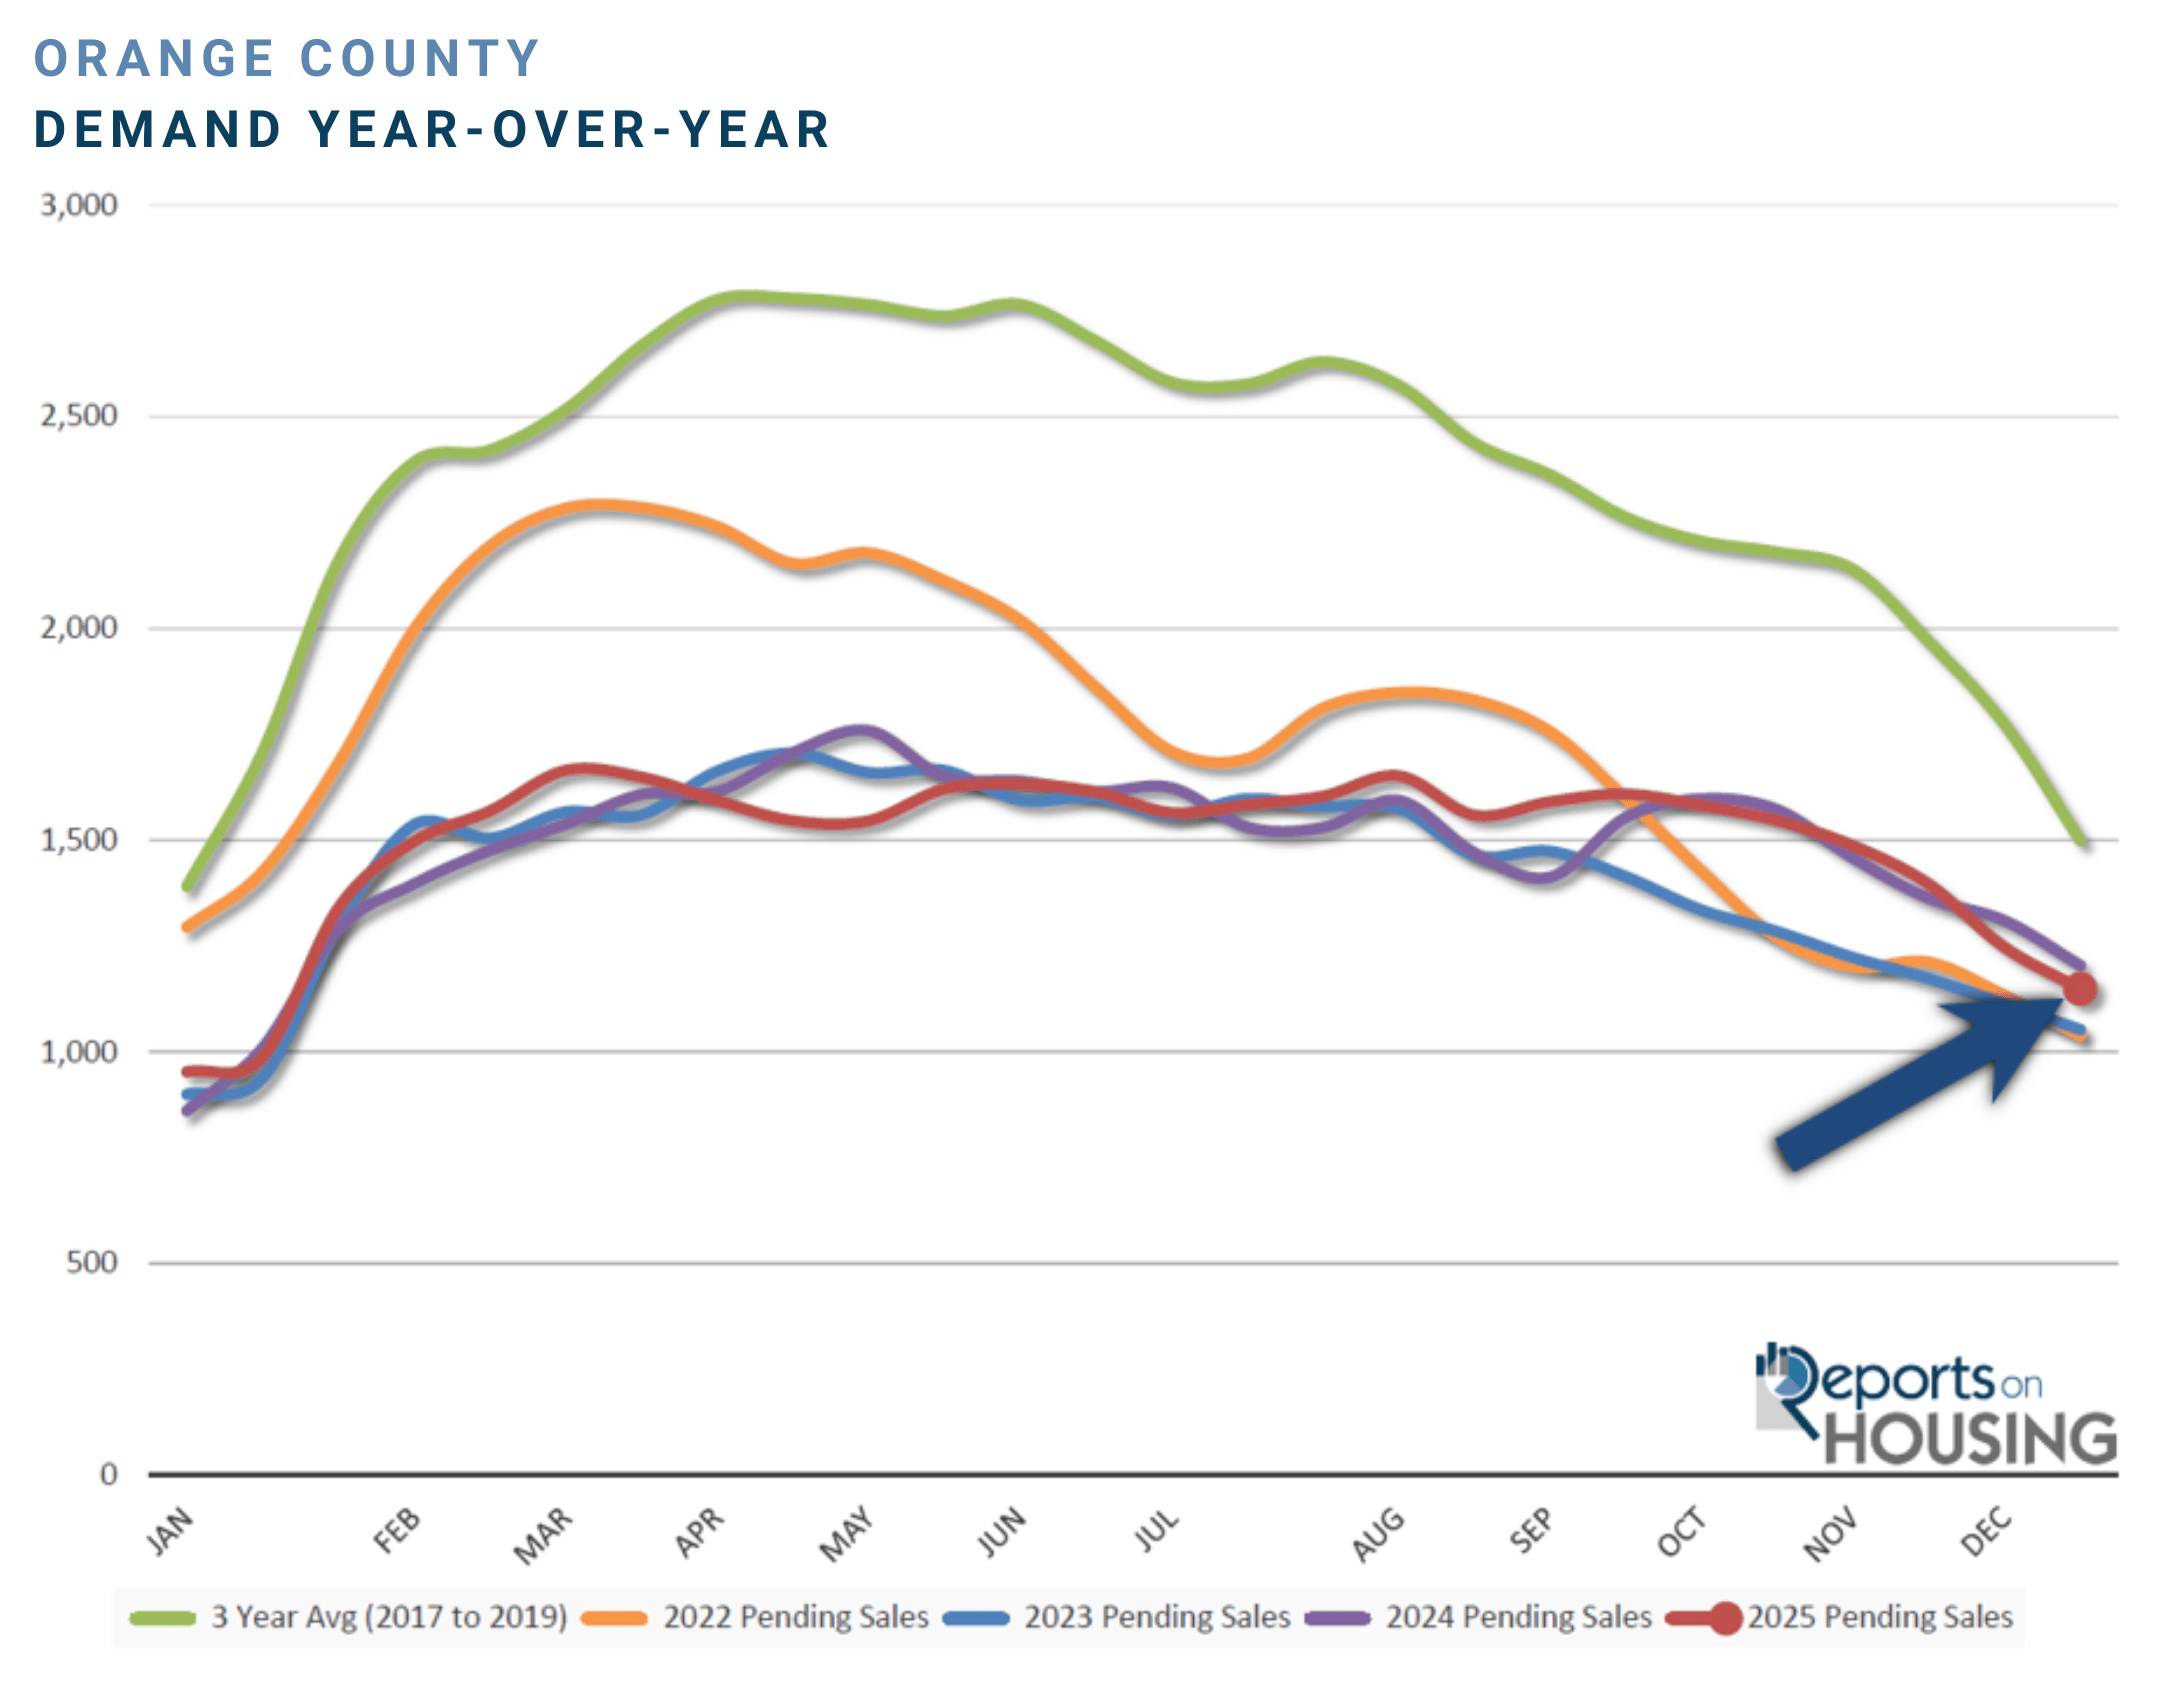
After starting the year with less than 1,000 pending sales, demand peaked in March at 1,665, its lowest peak since tracking began in 2004. It was 41% below the 3-year average peak before COVID (2017 to 2019) of 2,816 pending sales. Mortgage rates started the year above 7% and remained there through the first few weeks of February. They bounced between 6.75% and 7% through the end of May. Rates then slowly eased through September. They dropped below 6.5% on September 3rd and have remained close to 6.25% ever since, nearly four months, the most extended period since August 2022. Rates have eased due to a weakening labor market and an overall improvement in mortgage spreads, indicating mortgage pricing has been improving behind the scenes.
Unfortunately, demand was considerably diminished this year because rates remained above 6.5% throughout the Winter, Spring, and Summer Markets. The more favorable mortgage rate environment came too late, matching up with the Autumn and Holiday Markets, the slowest time of year for housing.
Within the past four weeks, demand dropped by 247 pending sales, or 18%, to 1,149, the lowest reading since January. At the end of December 2024, demand was at 1,204 pending sales, 5% higher than in 2025. The 3-year average end to December before COVID was 1,499 pending sales, 30% higher than in 2025.
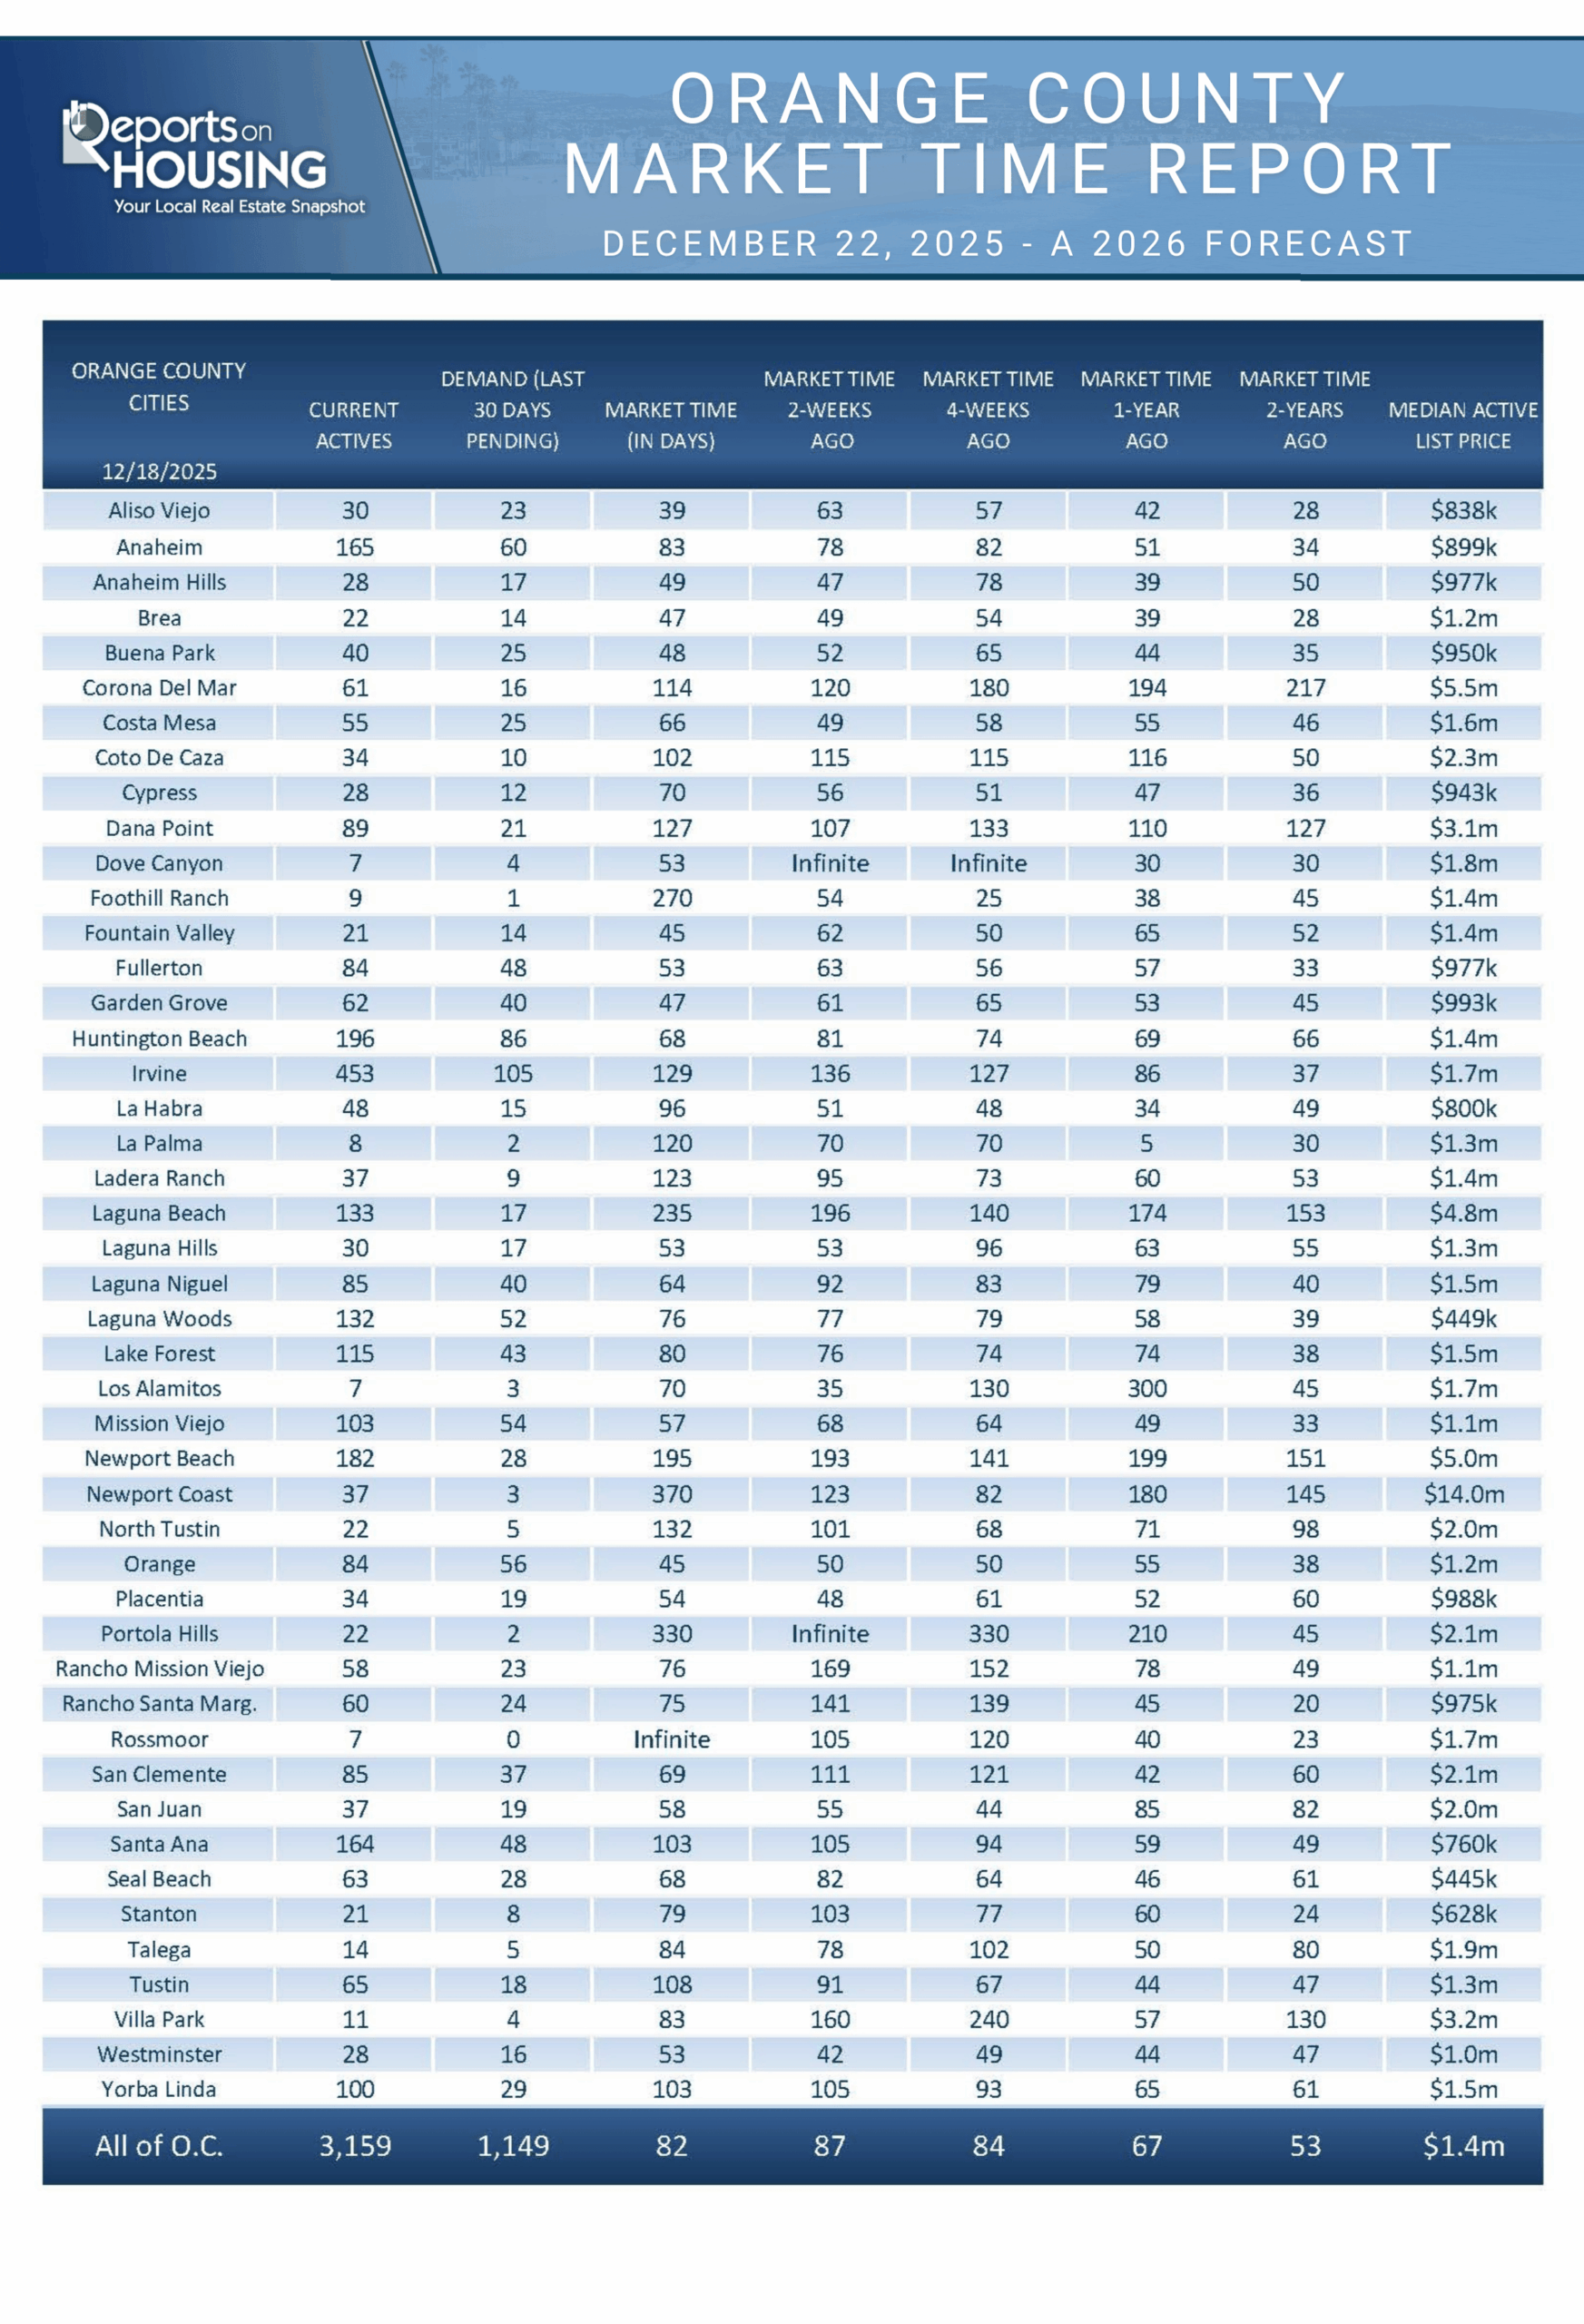
EXPECTED MARKET TIME
THE TIME IT TOOK TO SELL A HOME GREW LONGER AS THE YEAR PROGRESSED, AND THEN IMPROVED DURING THE SECOND HALF OF THE YEAR.
The Expected Market Time, the amount of time it would take to place a home listed today into escrow down the road (based upon current supply and demand), started the year at 74 days, stronger than pre-pandemic levels due to a limited inventory. It dropped to 61 days in February and continued to rise through July. The market slowed, with demand unchanged from the past couple of years, and remained relatively flat throughout the year
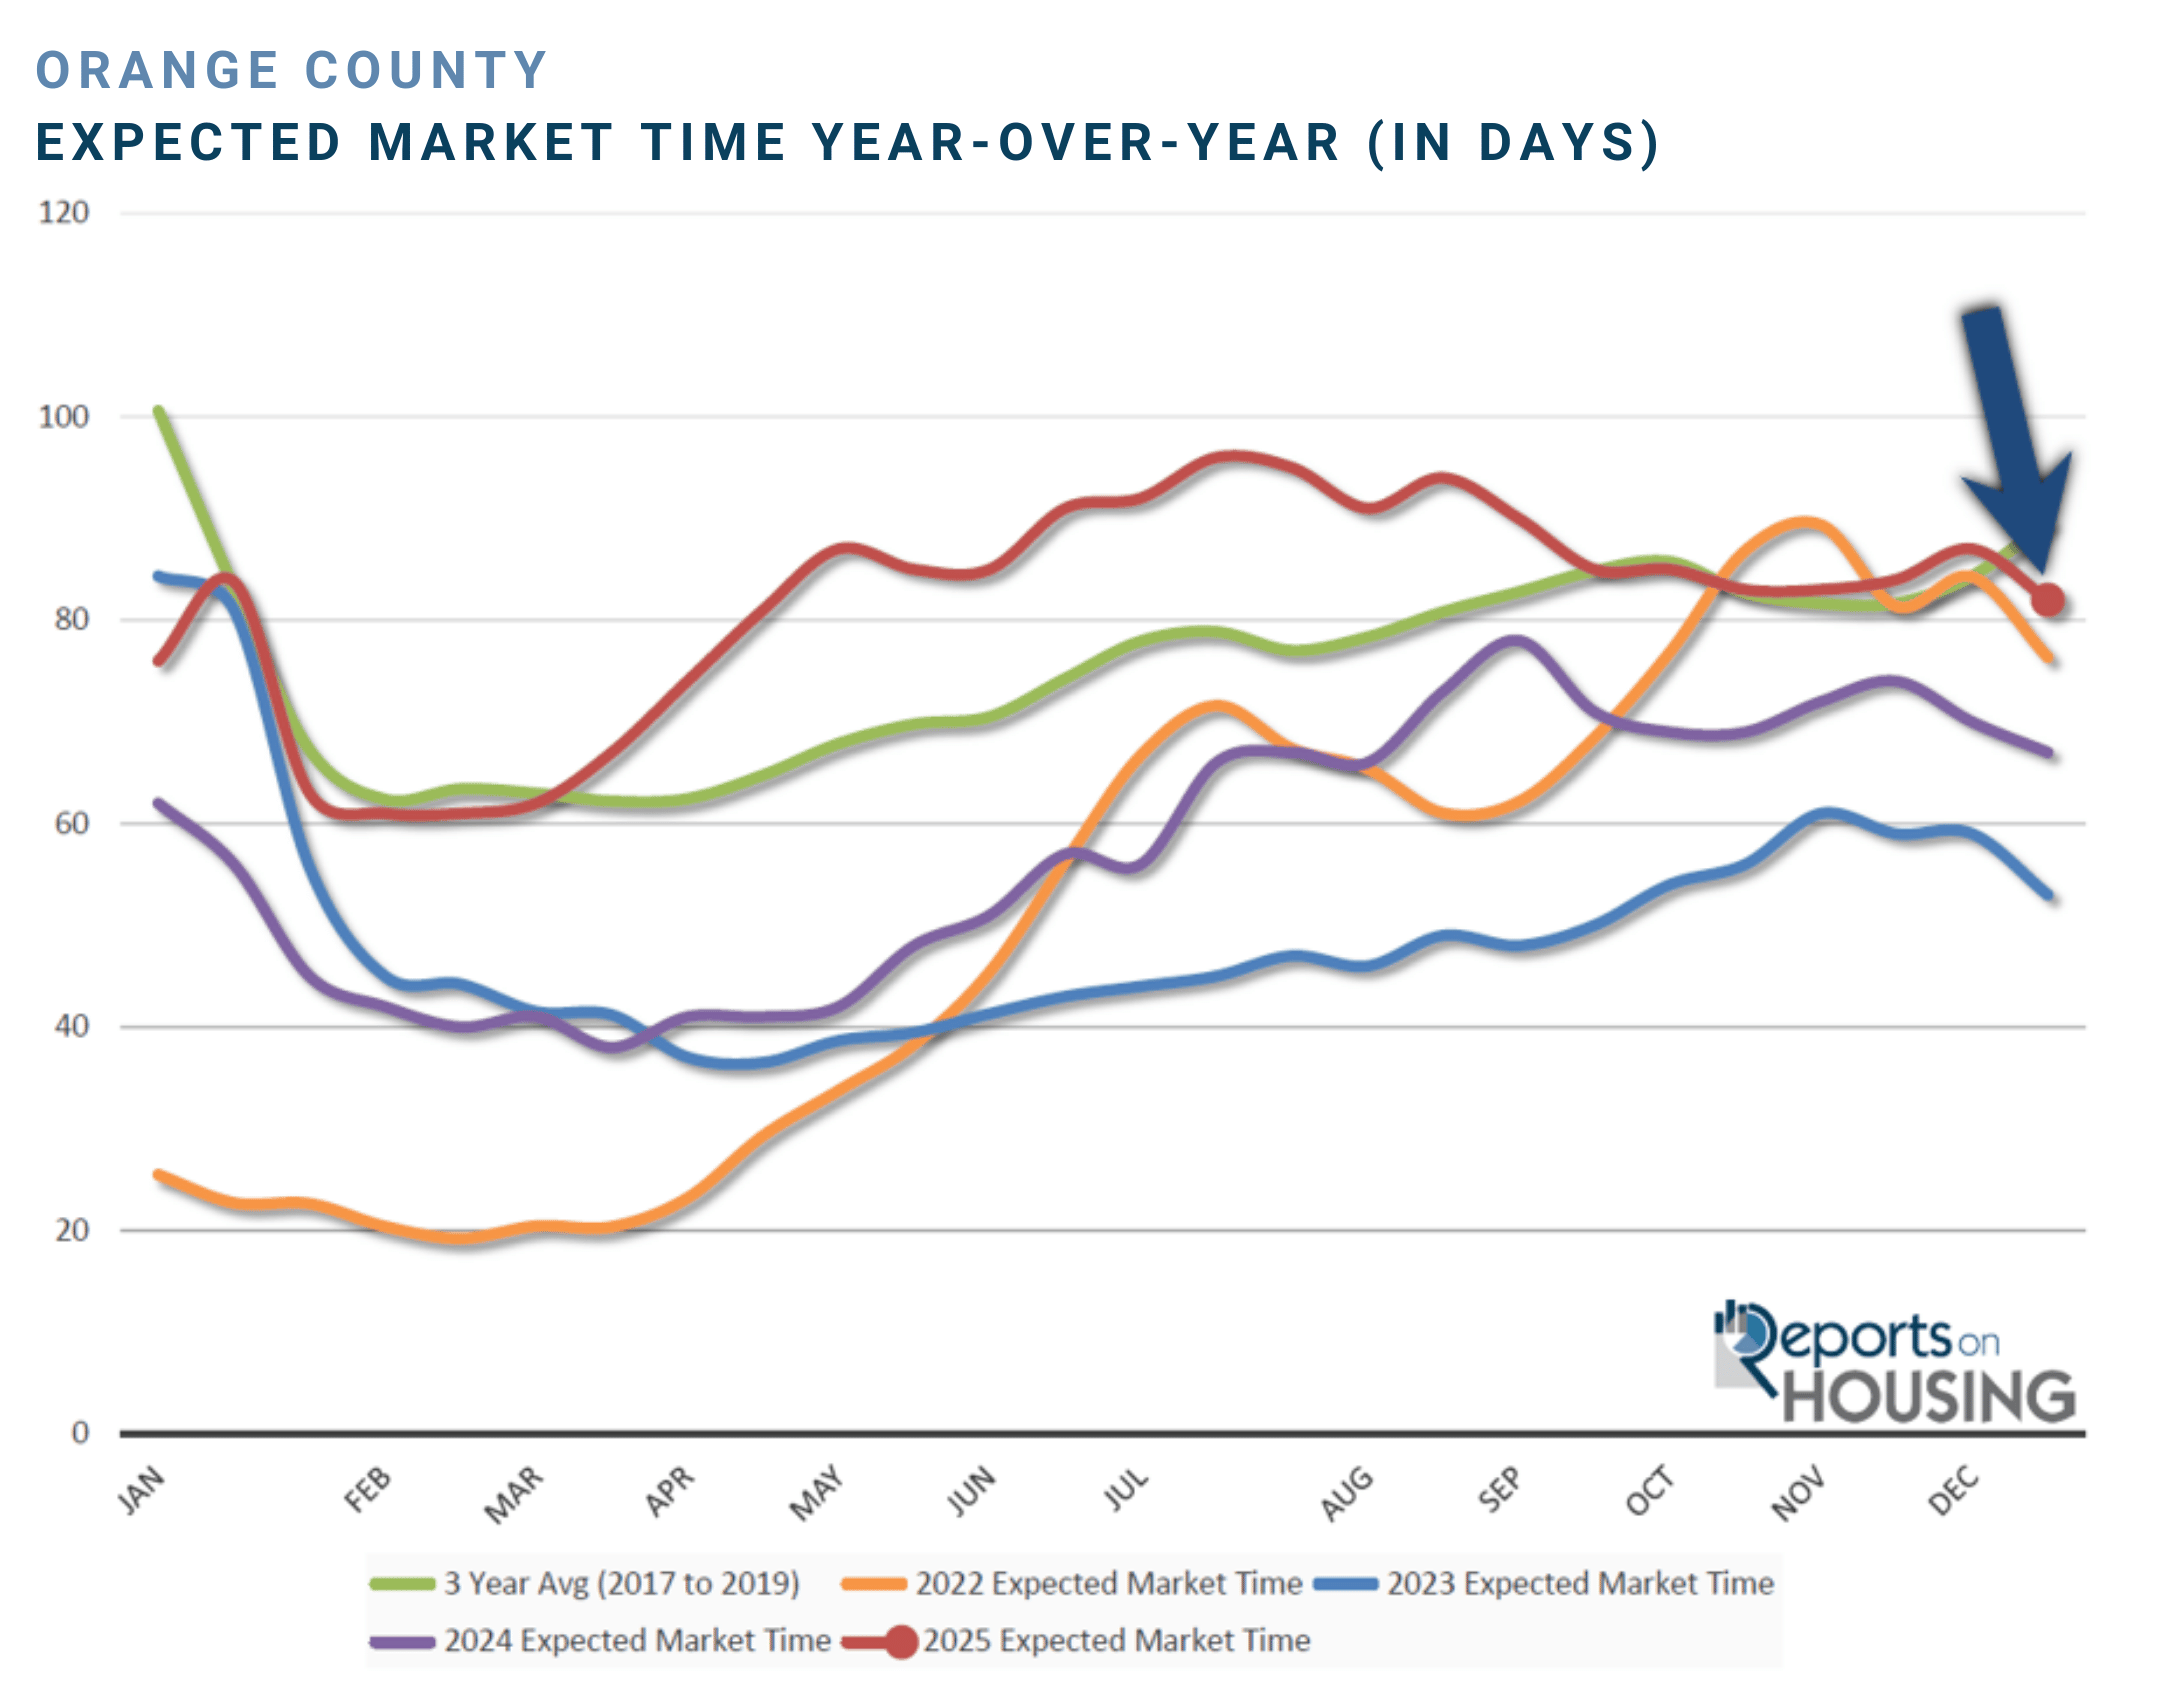
Simultaneously, more sellers hit the market and accumulated weekly. The increased competition among sellers resulted in a market slowdown. It eclipsed 80 days in April and
90 days in June. It hit 96 days in July, but then retreated as the pace of sellers coming on the market slowed during the second half of the year, and the inventory peaked at the end of July. It dropped below 90 days in September and did not look back. In the past two weeks, the Expected Market Time for Orange County dropped from 87 to 82 days, higher than 2024’s year-end at 67 days.
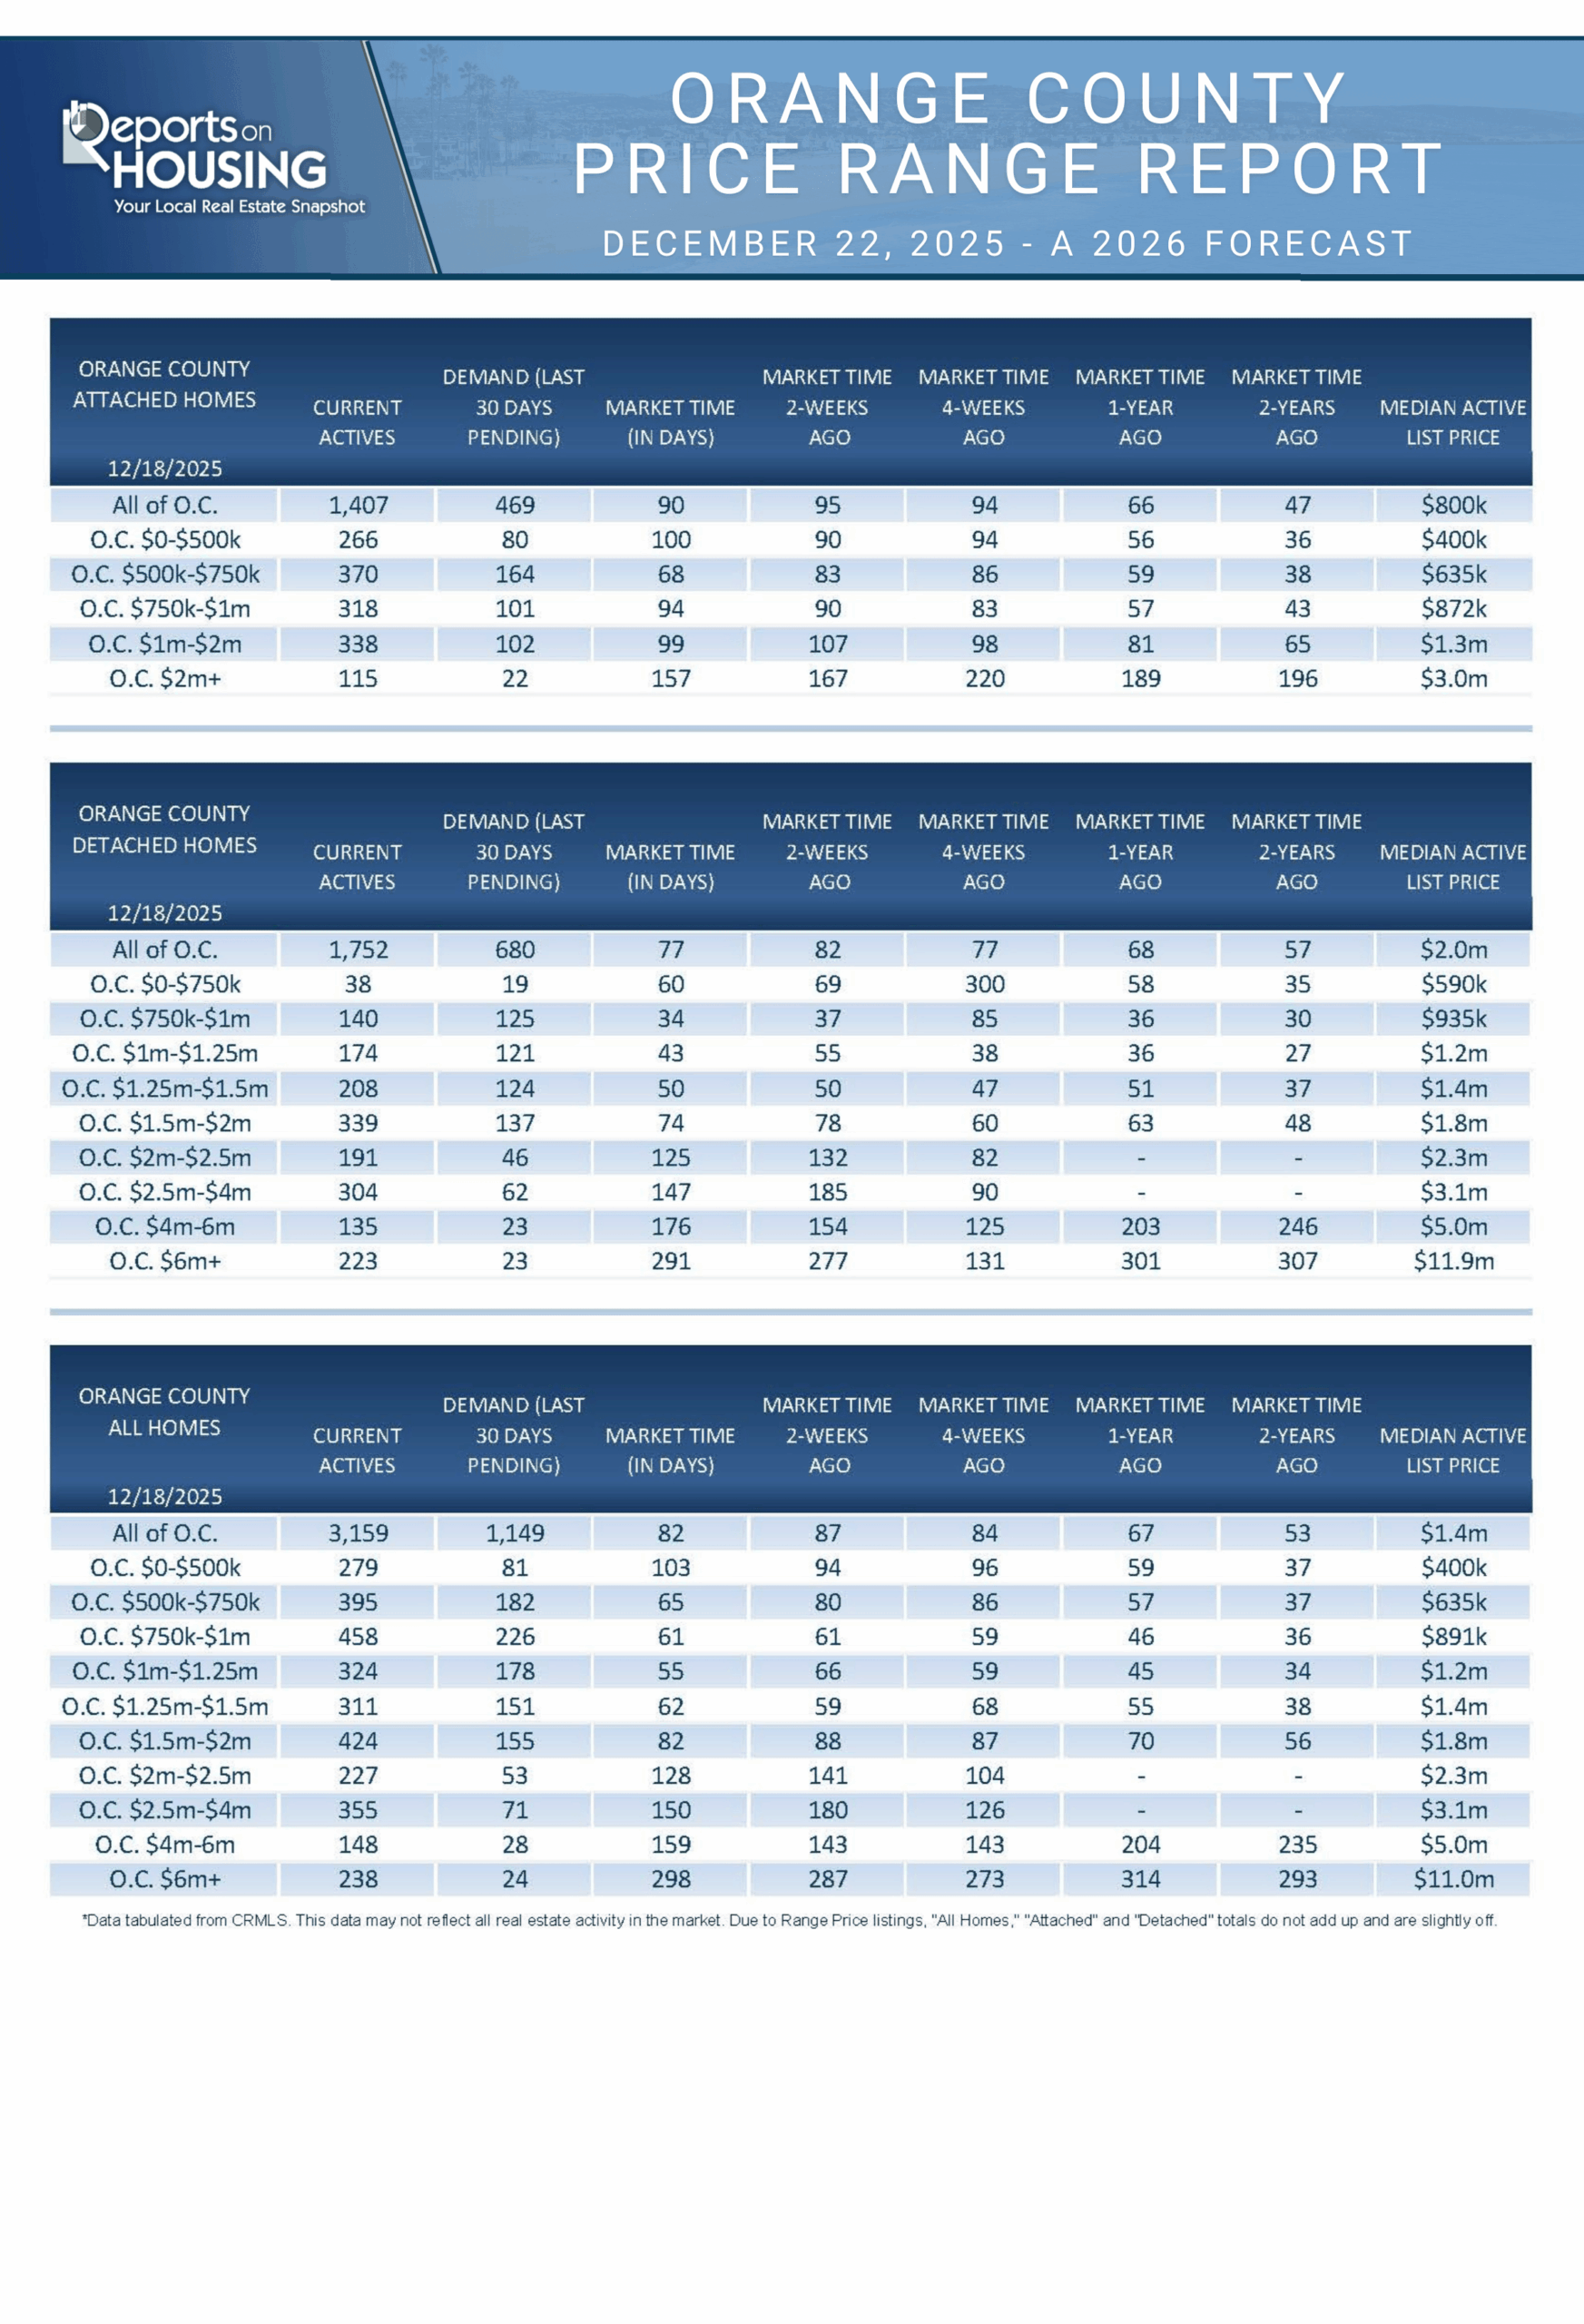
LUXURY END
THE LUXURY HOME MARKET WAS SLIGHTLY HOTTER THAN IN 2024.
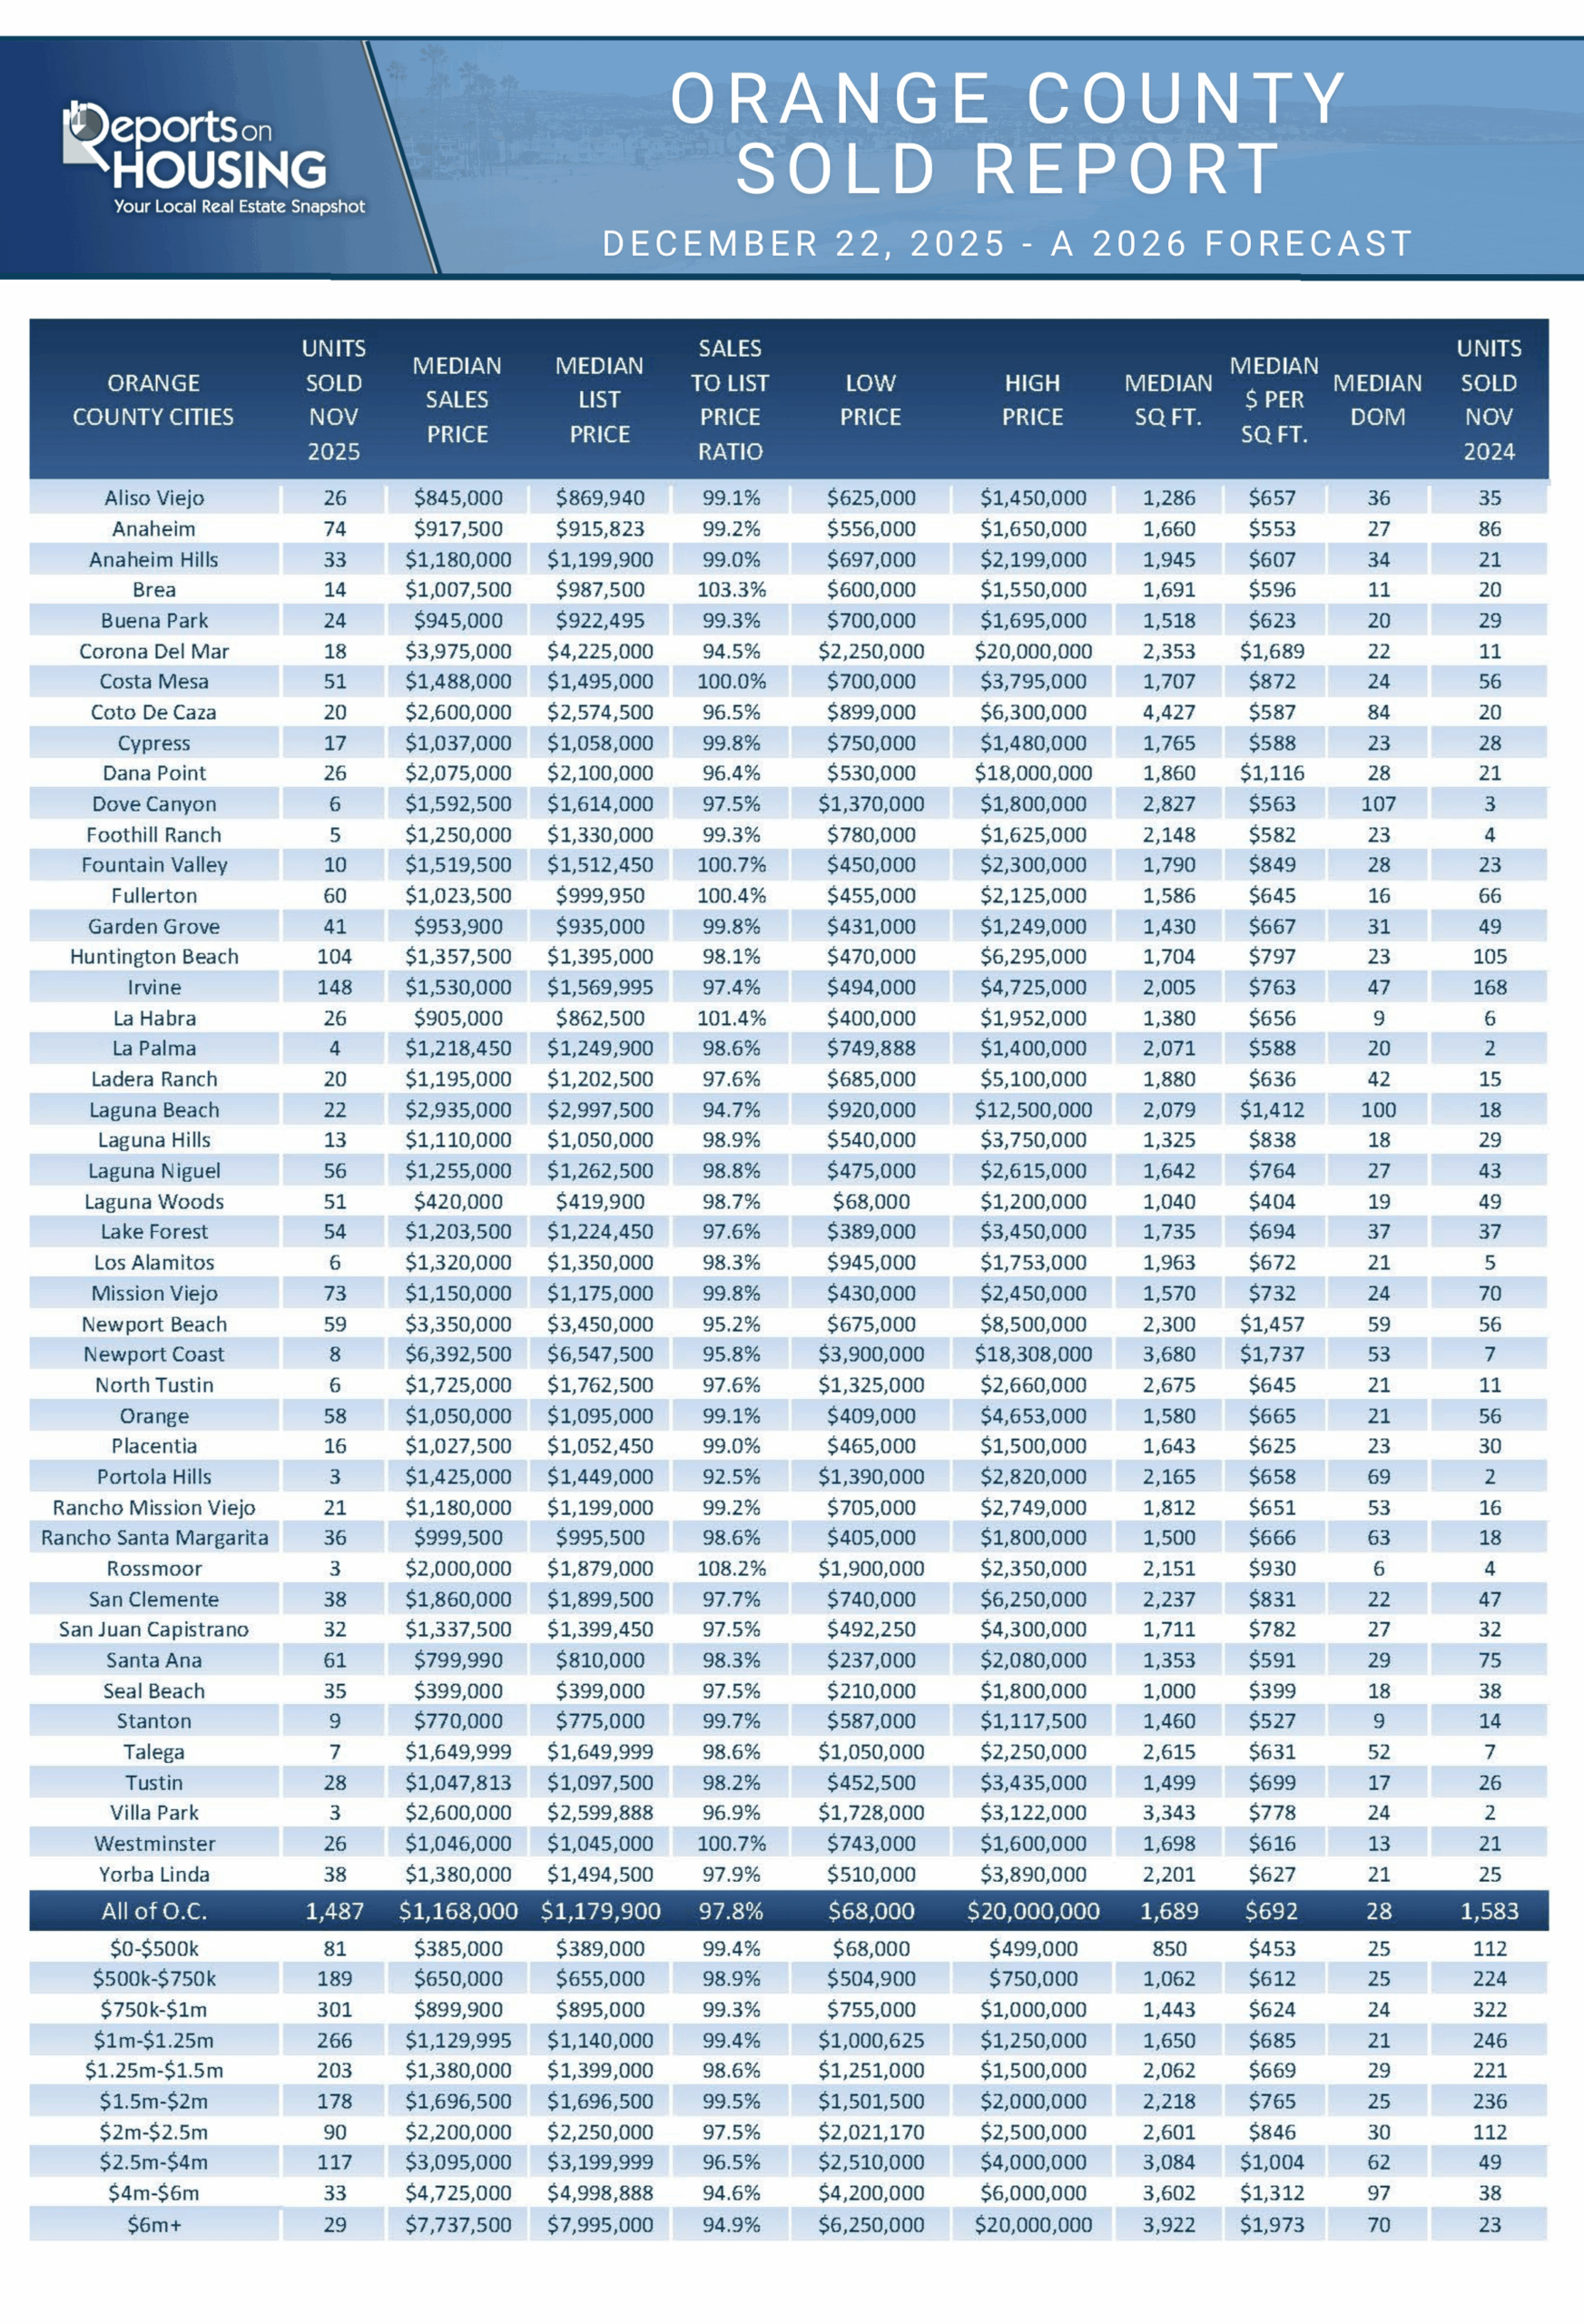
2021 was a record-setting year for luxury sales above $2.5 million in Orange County, eclipsing 2020 by 91% with 2,138 closed sales through November. With lower sales volumes, it dropped to 1,870 in 2022 and 1,554 in 2023. In 2024, with the luxury market outpacing the rest of the market, sales jumped 29% to 2,009. In 2025, luxury set a new record: 2,185 sales, up 2% or 47 from 2021. It was up 9% year-over-year, or 176 sales.
During the pandemic, the luxury market evolved at an inconceivable pace. Luxury homes that typically took months to sell were selling almost instantly. In February 2022, the Expected Market Time (the time between coming on the market and opening escrow) reached a record low of 87 days for ultra-luxury homes priced above $4 million. That changed when the Federal Reserve increased the Federal Funds rate 11 times in 2022 through 2023. Wall Street took a hit in 2022 and did not establish a new high until 2024, impacting luxury sales in 2023 and 2024. In 2024, luxury outpaced the rest of the housing market. In February 2025, the Expected Market Time for homes priced above $2.5 million dropped to 141 days, its lowest level for the year. It surpassed 200 days in June, reached 248 days in August, and then improved in September and October.
As of the end of December, luxury demand is at 123 pending sales, 27% higher than in January. The inventory is at 741 after plunging by 12% in the previous two weeks, nearly identical to the January start. The Expected Market Time for luxury finished the year at 181 days.
THE 2026 FORECAST
THE HOUSING MARKET IS AT THE MERCY OF RATES, SO IT ALL DEPENDS ON THE PATH OF MORTGAGE RATES IN 2026.
Following the 2022 rate shock, housing demand has been effectively frozen at minimal levels. 2025 housing demand looked a lot like 2024, which looked a lot like 2023, off by as much as 40% compared to before the pandemic. Even though the number of sellers coming on the market has remained muted compared to before the pandemic, the number of homeowners coming on the market has been rising since the lows established in 2023. These extra sellers have accumulated, resulting in increased seller competition and a more sluggish market, and negotiations have been slipping more and more in favor of buyers. Careful pricing was critical as seller competition increased. Values rose slightly from month to month at the start of 2025, then declined slowly until the fall, when they turned positive again, with the best mortgage rates of the year. For Orange County housing, the 2026 housing market depends on where mortgage rates end up from January through May, during the Winter and Spring Markets. The Winter Market builds momentum for the busiest time of the year in terms of pending sales activity, the spring.
The Federal Reserve has been carefully monitoring the deterioration of the labor market and rising inflation resulting from the implementation of tariffs. The labor market exerts downward pressure on rates, while any rise in inflation exerts upward pressure. The Federal Reserve is more concerned with employment and will quickly jump in if and when the labor market breaks further. In 2025, they cut the short-term Federal Funds rate by 0.75%, three one-quarter-point cuts. They originally forecasted two cuts in December 2024. In December 2025, they forecast only a one-quarter-point cut in 2026. They have indicated that they are extremely data-dependent, so it will be crucial to monitor both labor and inflation for any change in course, which will ultimately lead to a change in mortgage rates. The housing forecast has three different scenarios:
Scenario 1 – Economy Continues Cooling to Start 2026 with a Weak Labor Market (our base case)
- Interest Rates – Look for mortgage rates to remain between 6% and 6.49%, with economic readings that illustrate a weak labor market and inflation only slowly rising due to tariffs. The Federal Reserve will cut its short-term rate a couple of times.
- Active Inventory – After starting the year with 2,750 homes, the highest since 2020, the inventory will slowly grow until peaking in July. It will reach only 4,750 homes, well below the over 7,000-home peak average before COVID (2017 to 2019) and 5% below the 2025 peak. The “Hunkering Down” effect, in which homeowners opt to stay in their homes because of their fixed, low mortgage rates, will continue to diminish as more homeowners tire of waiting to make a move. There will be 20% fewer sellers compared to the average before COVID (2017 to 2019), yet 2,300 more FOR-SALE signs than in 2025.
- Demand – Buyer demand will pick up during the Winter and Spring Markets due to a better rate environment compared to 2025. The housing market will heat up, and there will be more multiple-offer situations, especially at the entry level. Pending sales activity will rise year-over-year. Careful pricing will continue to be essential in securing success.
- Closed Sales – The number of successful closed sales will increase by 4% to 7% compared to 2025, with around 21,900 total.
- Home Values – Home values will rise between 2% to 5% for the year.
Scenario 2 – Labor Market Breaks to Start 2026 (second most likely case)
- Interest Rates – Mortgage rates will drop between 5.75% and 5.9%, with economic readings illustrating rising unemployment and significant negative job numbers. The Federal Reserve will cut the Federal Funds rate more than expected, dropping it at least three times.
- Active Inventory – After starting the year with 2,750 homes, the highest since 2020, the inventory will slowly grow until peaking in July. It will reach only 4,000 homes, well below the over 7,000-home peak average before COVID (2017 to 2019) and 20% below the 2025 peak. The “Hunkering Down” effect, in which homeowners opt to stay in their homes because of their fixed, low mortgage rates, will continue to diminish as more homeowners tire of waiting to make a move. There will be 20% fewer sellers compared to the average before COVID (2017 to 2019), yet 2,300 more FOR-SALE signs than in 2025.
- Demand – Buyer demand will pick up substantially during the Spring Market. The housing market will heat up as rates remain below 6% with duration. Many buyers who have been sidelined by unaffordability have been waiting for rates to fall into the 5s. This will result in demand accelerating and plenty of buyer competition, especially at the entry level. Multiple offer situations will prevail, and many buyers will be willing to stretch the price slightly to secure a home. Careful pricing will remain necessary for obtaining success.
- Closed Sales – The number of successful closed sales will increase by 8% to 10% compared to 2025, with around 22,600 total.
- Home Values – Home values will rise between 6% to 8% for the year.
Scenario 3 – An Improving, Stronger Labor Market to Start 2026 (least likely case)
- Interest Rates – Mortgage rates will remain above 6.5% for most of the year, with economic readings that illustrate a strengthening labor market, exceeding Wall Street’s and economists’ expectations. The Federal Reserve will be forced not to cut the Federal Funds Rate.
- Active Inventory – After starting the year with 2,750 homes, the highest since 2020, the inventory will slowly grow until peaking in August. It will reach a peak of only 6,500 homes, slightly below the over 7,000-home average before COVID (2017 to 2019) and 30% higher than the 2025 peak. The “Hunkering Down” effect, in which homeowners opt to stay in their homes because of their fixed, low mortgage rates, will continue to diminish as more homeowners tire of waiting to make a move. There will be 20% fewer sellers compared to the average before COVID (2017 to 2019), yet 2,300 more FOR-SALE signs than in 2025.
- Demand – Buyer demand will be sluggish during the Spring and Summer Markets, with rates stuck above 6.5% with duration. The Spring Market will feel short-lived, as inventory rises quickly and the market slows considerably by the Summer Market, similar to 2025. Buyers will be unwilling to stretch the price to secure a home. With more seller competition, proper pricing will be critical to ensure success.
- Closed Sales – The number of successful closed sales will be between down 1% to up 2% compared to 2025, with around 20,700 total.
- Home Values – Home values will be down 3% to 1% for the year.
Additionally, the housing market will follow a typical housing cycle. Spring is the strongest in terms of demand, followed by the Summer Market, then the Autumn Market, and finally the Holiday Market. Luxury housing will be at its strongest in the first half of the year, then become more sluggish, with longer market times, in the second half. Finally, do not expect a wave of foreclosures and short sales. Distressed properties are still far below pre-pandemic levels, and the housing stock (all homeowners across the country) is the healthiest in U.S. history.
Uncertainty remains regarding the trajectory of the U.S. economy in 2026. Based on incoming monthly economic data and its alignment with expectations, interest rates are projected to range between 5.75% and 6.75%. Housing remains highly sensitive to rate movements, with market performance in 2026 largely dependent on broader economic conditions and, ultimately, the direction of mortgage rates.
Have an excellent finish to 2025.