December 8, 2025
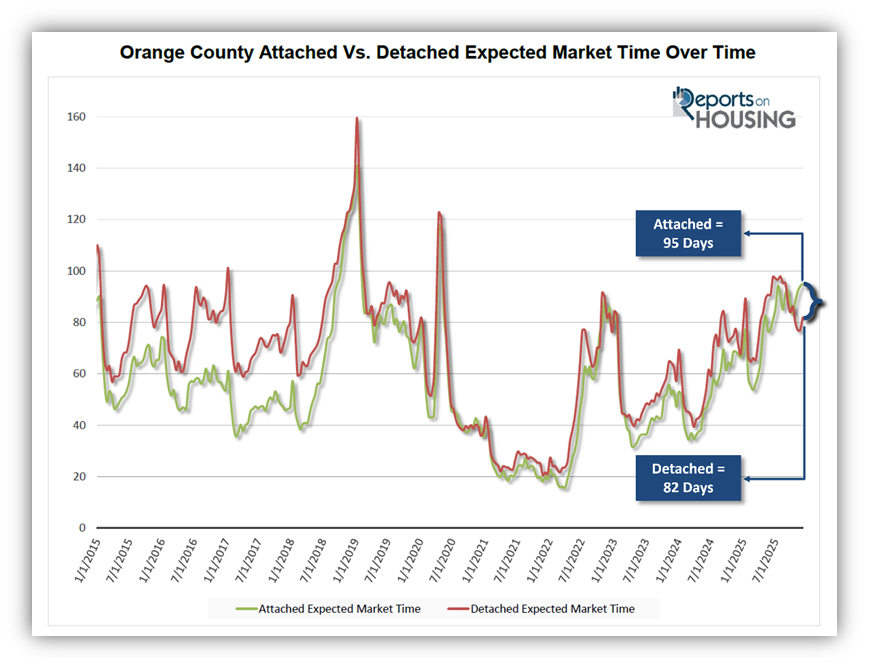
The attached home market, condominiums and townhomes, suddenly slowed substantially compared to the detached home market.
Condos are Harder to Sell
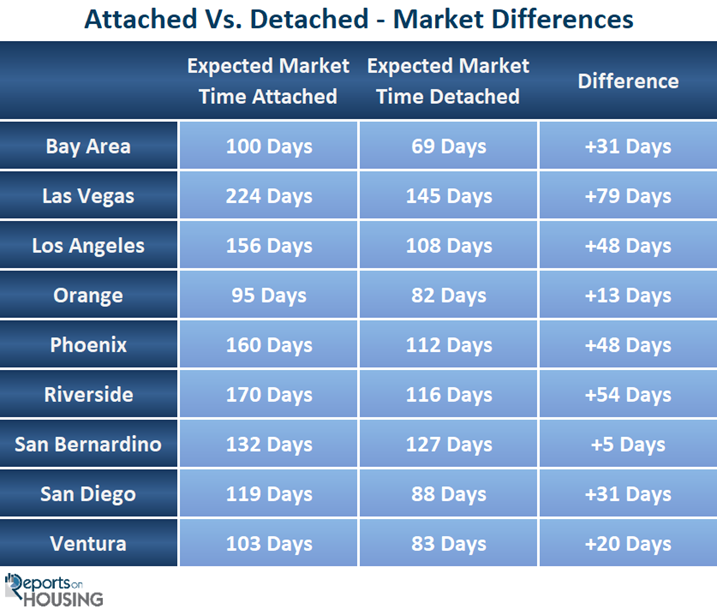
The market time for attached is 95 days, compared to 82 days for detached.
The typical meal at a fast-food restaurant used to cost $5 or $6. But over the past 10 years, prices have been rising faster than inflation. The cost of delivering a large hamburger and fries has skyrocketed due to much higher labor costs, persistent inflation, increased commodity prices, and relentless supply chain issues. The fast food meal has ballooned to $10 to $12 per meal. Fast food has suddenly become nearly as expensive as dining out. The allure of cost-effective fast-food dining out, compared to cooking at home, has lost its luster.
Condominiums were long known as the “stepping stone” to owning a home, a much cheaper alternative to a detached house. They offered a more affordable option, along with amenities such as pools, spas, barbecues, fitness centers, and community centers. It was a lifestyle choice for the young, a pathway to owning a home with a white picket fence. Yet, the cost of condominiums has soared, and their allure has lost its luster.
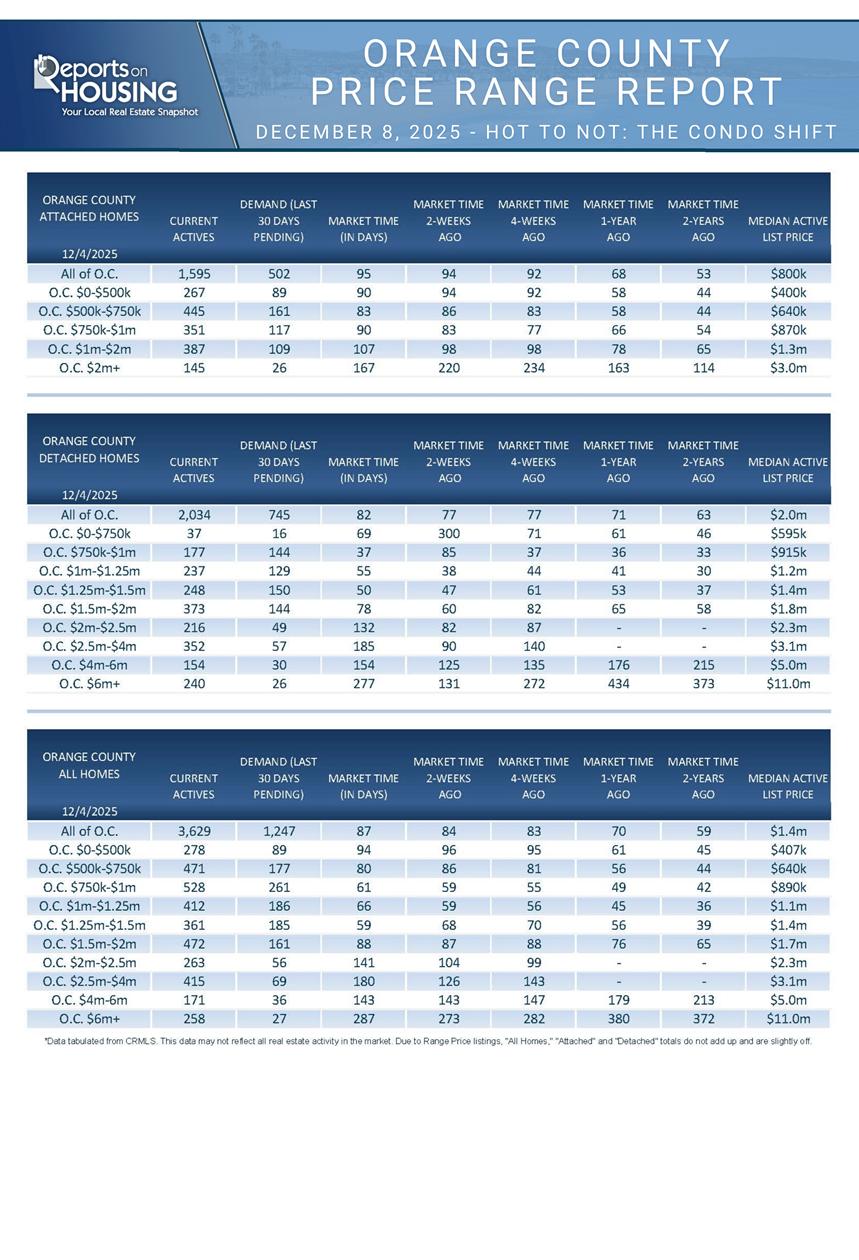
The cost savings advantage of owning a condominium has diminished over time. They still have a much lower sticker price compared to detached homes, but the other fees have skyrocketed. Higher maintenance, skyrocketing insurance premiums, and reserve fund issues have led to much higher Homeowner Association fees. These increased costs are absorbed in rising dues. The median monthly Homeowners Association fees for all attached sales in November were $502, and the median sales price was $810,000. For detached homes, the median Homeowners Association fees were $0, and the median sales price was $1,400,000.
Many condominium complexes have not maintained sufficient reserves (not enough money saved for future major repairs, such as roofs, plumbing, and roads), leading to special assessments and increased dues. In addition, California adopted balcony inspection requirements in response to the tragic 2015 Berkeley 5th-floor balcony collapse that killed six people and injured seven. It is an additional hurdle in the inspection process that can delay a closing and reduce a seller’s net proceeds.
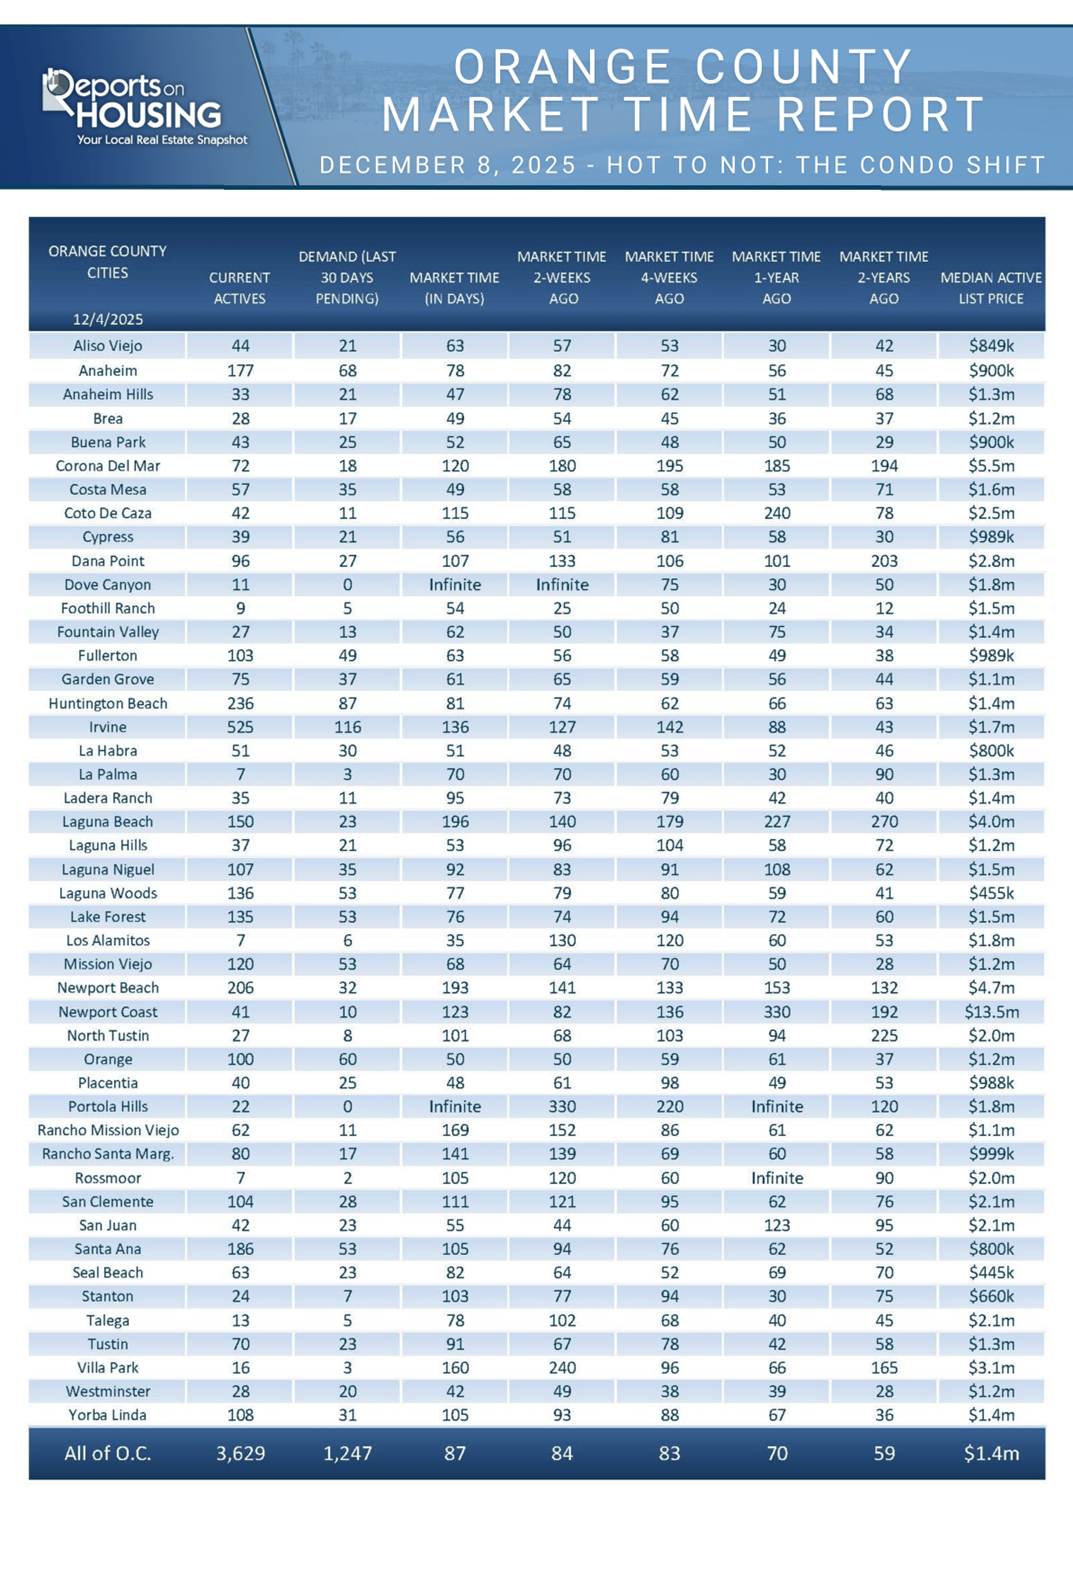
As a result of the higher costs, it is now taking longer to sell attached homes compared to detached houses. The inventory of attached homes is up 35% compared to last year, from 1,179 to 1,595, while demand (a snapshot of the number of new
pending sales over the prior month) is down 4%, from 523 to 502 pending sales. On the other hand, the detached home inventory is up from 1,865 to 2,034, an increase of only 9%, while demand is down 5%, from 787 pending sales to 745. The Expected Market Time (the number of days it takes to sell all Orange County listings at the current buying pace) is 95 days for attached homes compared to 82 days for detached homes. It is taking 13 days longer, nearly two weeks, to sell condominiums versus detached houses.
The difference between the attached-home and detached-home markets in Orange County began to develop in October. For many other markets, it has been an issue for months, or even the last couple of years. In Los Angeles County, the attached market is 48 days slower than the detached market. It is 54 days slower in Riverside County, and 31 days in San Diego County. It takes a mind-blowing 79 days longer in Clark County (Las Vegas).
Lenders are cautious about lending on condominiums due to higher risk factors. They assess the entire complex’s financial health, not just the buyer. They look at an association’s financial health, from reserve levels to delinquent dues to pending litigation. They consider the number of owners who occupy their units compared to the number of investor-owned units. They examine insurance and liability concerns to ensure adequate coverage in the event of a disaster. As a result, some condominiums are harder to finance, requiring different loan products and larger down payments. They become harder to sell, which adds to their market time.
When inventory is severely limited and there are very few options for buyers, the attached-home market becomes much more attractive. But with higher Homeowners Association fees, higher 30-year mortgage rates, and an elevated active listing inventory, attached homes are taking much longer to sell. The condominium slowdown has arrived.
Active Listings
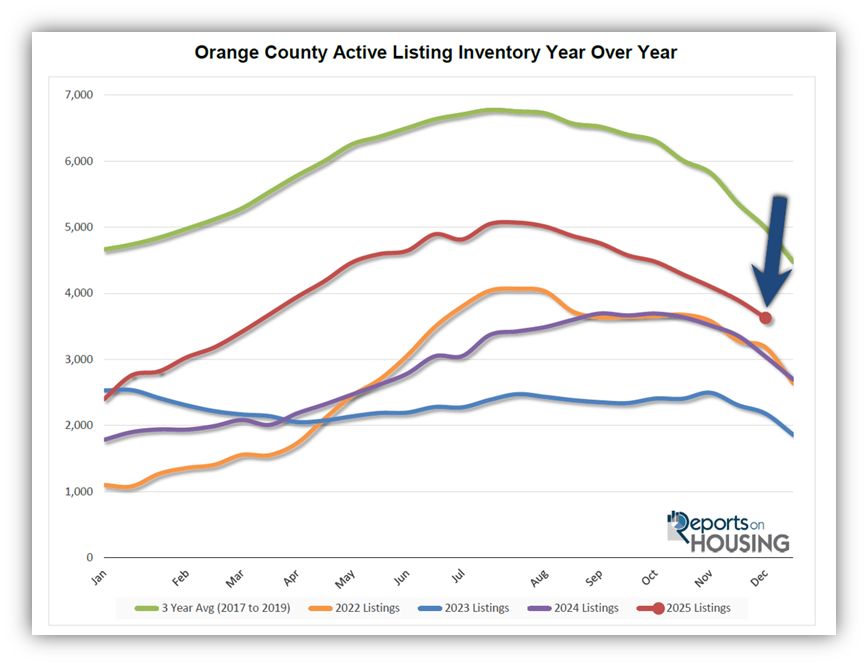
The inventory experienced its largest drop of the year in the past couple of weeks.
The active listing inventory plunged by 268 homes over the past two weeks, a 7% decline, and now stands at 3,629, its largest drop of the year, and its lowest level since March. As is customary during the Holiday Market, the inventory is dropping at its fastest pace of the year. Since peaking in July at 5,071 homes, the inventory has declined by 28% or 1,440 homes. It is December, when the fewest homes are placed on the market, with many sellers delisting their homes, pulling them off the market due to a lack of success and the desire to enjoy the holiday season. Many sellers are delisting, knowing it is the slowest time of the year in terms of demand. The inventory will continue to plummet until the ringing in of a New Year. It will then grow from day to day, week to week, in January, picking up steam by the third week of a fresh year.
Last year, the inventory was at 3,044 homes,16% fewer, or 585 less. The 3-year average before COVID (2017-2019) was 4,988, an additional 1,359 homes, or 37% more.
Homeowners continue to “hunker down” in their homes, unwilling to move because of their current, underlying, locked-in, low fixed-rate mortgage. This trend has been easing from the lows established in 2023. Through November, 27,761 homes were placed on the market in Orange County, 9,909 fewer than the 3-year average before COVID (2017-2019), 26% less. In 2024, 25,630 homes entered the market, compared to 22,118 in 2023. More sellers are opting to sell in 2025. Yet, for the fourth month in a row, the number of homes coming on the market was fewer compared to the prior year. In November, 1,504 homes came on the market, 1.2% less than last year’s 1,522.
Demand
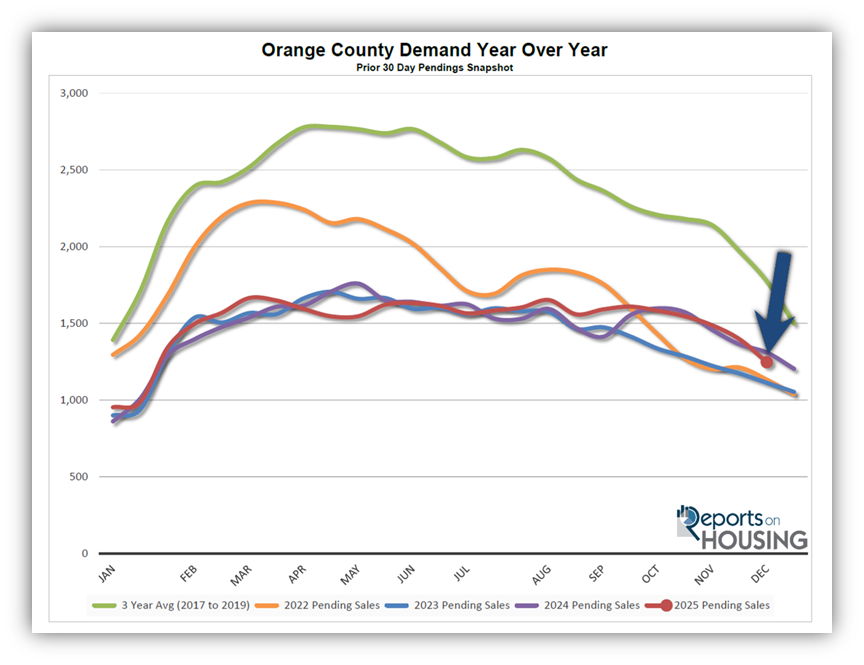
Demand experienced its largest drop of the year in the past couple of weeks.
Demand, a snapshot of the number of new pending sales over the prior month, plunged from 1,396 to 1,247 in the past couple of weeks, representing a 149-pending-sale drop, or an 11% decrease, its most significant drop of the year and its lowest level since mid-January. Despite rates continuing to drift between 6% and 6.5% since September 3rd, their lowest level of the year, demand unexpectedly dropped considerably more than expected for this time of year. It was the largest drop since 2021, when it plunged by 12%. It is a bit perplexing because 30-year mortgage rates were a half-of-a-percent higher last year, meaning affordability is better today. It will be interesting to see if this trend continues as the year comes to a close. Nonetheless, expect demand to drop to its lowest level on New Year’s Day. From there, it will accelerate rapidly, picking up steam week to week in January. Demand will outpace inventory growth in January and February.
Last year, demand was 1,310, an additional 63 pending sales, or 5% more. The 3-year average before COVID (2017-2019) was 1,774 pending sales, 42% higher than today, representing an additional 527 pending sales.
As the Federal Reserve has indicated, it is essential to watch all economic releases for signs of slowing. That is the only path to lower mortgage rates at this time. These releases can cause mortgage rates to rise or fall, depending on how they compare with market expectations. This week, the Federal Reserve meets and will conduct a news conference on Wednesday, ultimately revealing its appetite to cut rates in the near future and into 2025, a crucial day for mortgage rates. Next week is one of the most jam-packed weeks of the year, with November’s Jobs Report, retail sales, the Consumer Price Index, and the Personal Consumption Expenditures – Price Index (the Federal Reserve’s preferred inflation indicator). It will be a fascinating two weeks for mortgage rates.
Expected Market Time
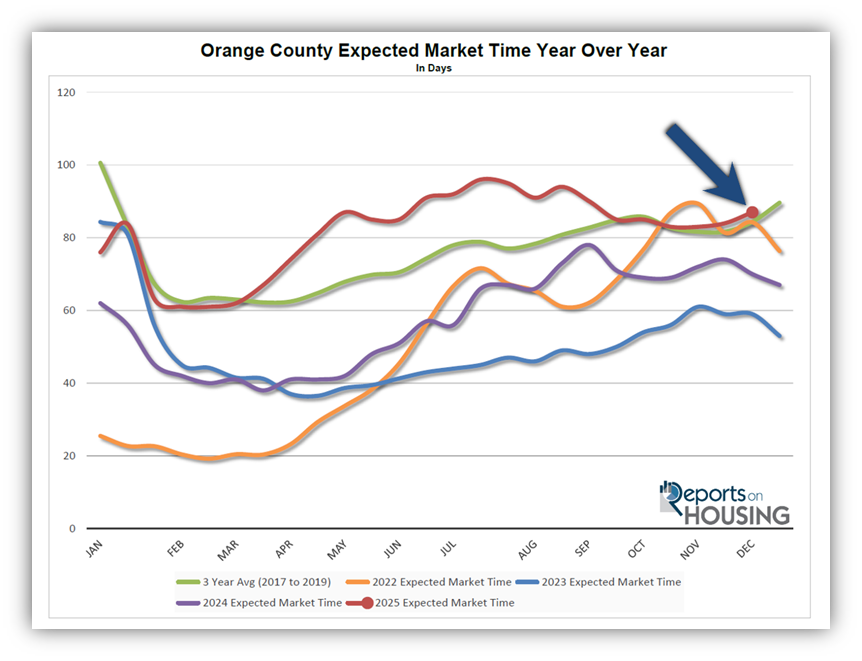
The Expected Market Time has increased over the past couple of weeks.
With the supply of available homes falling by 268 homes, down 7%, and demand dropping by 149 pending sales, down 11%, the Expected Market Time (the number of days it takes to sell all Orange County listings at the current buying pace) increased from 84 to 87 days in the past couple of weeks. It is the highest start to December since 2018.
Last year, it was 70 days, faster than today. The 3-year average before COVID was 87 days, identical to today.
The Expected Market Time for condominiums and townhomes increased from 94 to 95 days in the past two weeks. It was at 68 days last year. For detached homes, the Expected Market Time increased from 77 to 82 days. It was 71 days a year ago, faster than today. The detached-home market is substantially stronger than the attached-home market.
Luxury End
The luxury market slowed dramatically over the past couple of weeks.
The luxury home inventory priced above $2.5 million (the top 10% of the Orange County housing market) decreased from 875 to 844, a 31-home decline, or 4%. Luxury demand decreased by 36 pending sales, down 21%, to 132. The Expected Market Time for luxury homes priced above $2.5 million slowed from 156 to 192 days, its slowest reading since the start of October. Luxury demand is dropping at a much faster pace than luxury inventory.
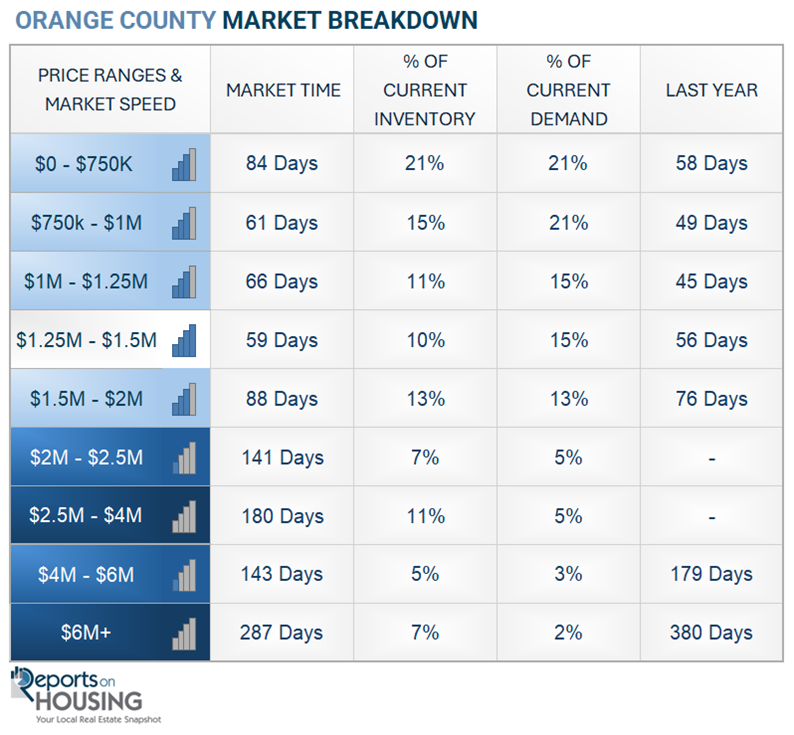
In the past two weeks, the Expected Market Time for homes priced between $2.5 million and $4 million increased from 126 to 180 days. For homes priced between $4 million and $6 million, the Expected Market Time remained unchanged at 143 days. For homes priced above $6 million, the Expected Market Time increased from 273 to 287 days. Luxury is at 192 days overall. At this pace, a seller would be looking at becoming a pending sale around June 2026.
Orange County Housing Summary
- INVENTORY: The active listing inventory in the past couple of weeks plunged by 268 homes, down 7%, and now stands at 3,629, its largest drop of the year and its lowest level since March. Last year, there were 3,044 homes on the market, 585 fewer homes, or 16% less. The 3-year average before COVID (2017-2019) was 4,988, which is 37% higher. From January through November, 26% fewer homes came on the market compared to the 3-year average before COVID (2017-2019), 9,909 less. Yet 2,131 more sellers came on the market this year than last year, and 5,643 more than in 2023.
- DEMAND: Buyer demand, the number of pending sales over the prior month, sank by 149 in the past two weeks, down 11%, and now stands at 1,247, its largest drop of the year. Last year, there were 1,310 pending sales, 5% more than today. The 3-year average before COVID (2017-2019) was 1,774, which is 42% higher.
- MARKET TIME: With demand falling faster than supply, the Expected Market Time, the number of days to sell all Orange County listings at the current buying pace, increased from 84 to 87 days in the past couple of weeks. It is the highest start to December since 2018. Last year, it was 70 days, faster than today. The 3-year average before COVID (2017-2019) was 87 days, the same as today.
- LUXURY: In the past two weeks, the Expected Market Time for homes priced between $2.5 million and $4 million increased from 126 to 180 days. For homes priced between $4 million and $6 million, the Expected Market Time remained unchanged at 143 days. For homes priced above $6 million, the Expected Market Time increased from 273 to 287 days.
- DISTRESSED HOMES: Short sales and foreclosures combined, comprised only 0.1% of all listings and 0.3% of demand. Three foreclosures and one short sale are available today in Orange County, bringing the total of distressed homes on the active market to four, unchanged from two weeks ago. Last year, six distressed homes were on the market, similar to today.
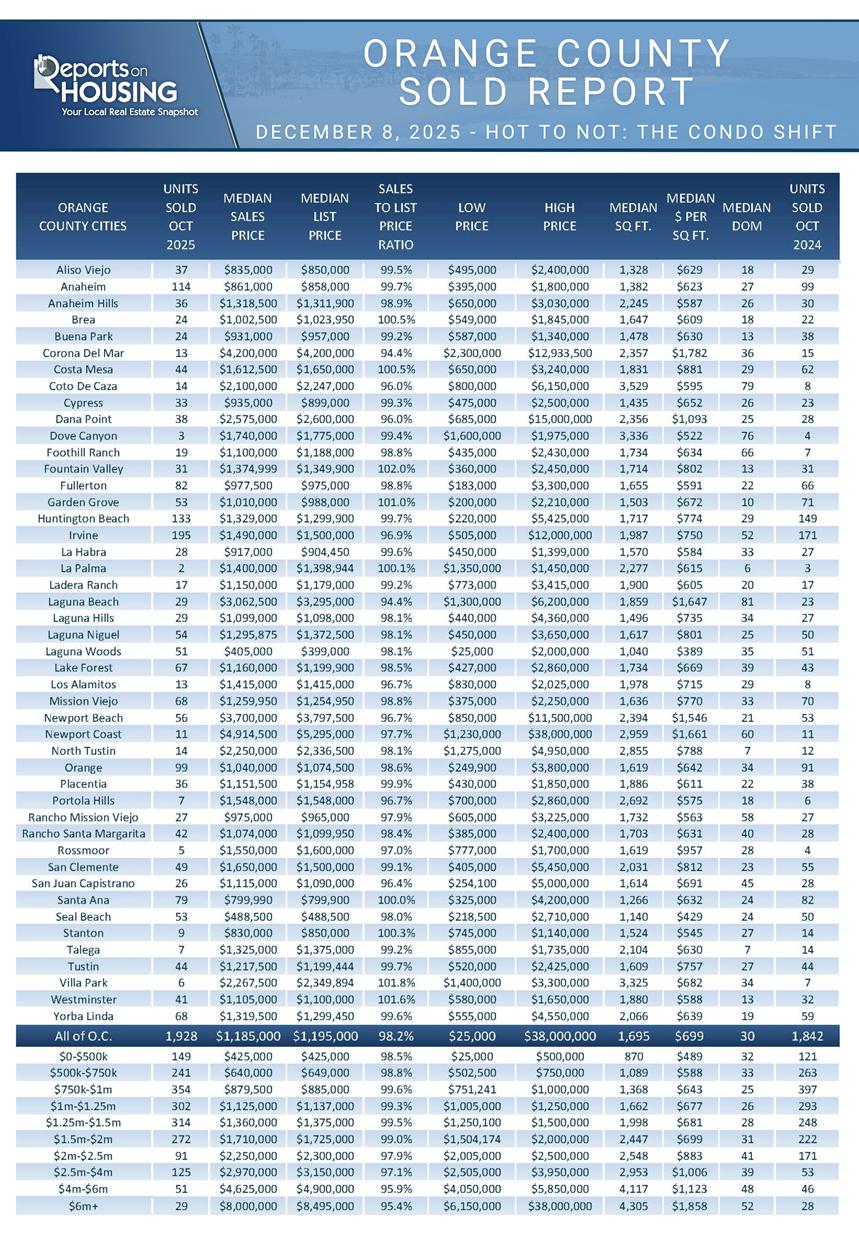
- CLOSED SALES: There were 1,928 closed residential resales in October, 5% higher than October 2024’s 1,842 sales, and up 7% from September 2025. The sales-to-list price ratio in Orange County was 98.2%. Foreclosures accounted for 0.2% of all closed sales, and short sales accounted for 0.1%. That means that 99.7% of all sales were sellers with equity.
Have a great week.
Sincerely,
Steven Thomas
Quantitative Economics and Decision Sciences
Copyright 2025—Steven Thomas, Reports On Housing—All Rights Reserved. This report may not be reproduced in whole or in part without express written permission from the author.