November 24, 2025
Every quarter of a point drop in rates improves affordability dramatically, and today’s 30-year mortgage rate is nearly three-quarters of a percent lower than last year.
Interest Rates Healing the Market
Mortgage rates have been between 6% and 6.5% since September 3rd, nearly three months, the lowest level in over a year.
In September, the sun was setting at 6:30 PM, temperatures reached the 90s, and there was no trace of rain. Now, in late November, clocks were turned back an hour, the sun sets at 4:45 PM, temperatures have averaged in the upper 60s, and rainfall totals have exceeded five inches this month alone. There’s a chill in the air, and shorts and t-shirts have been replaced with jeans, long-sleeved shirts, and everyone’s favorite fall sweater. Day by day, inch by inch, as the sun set earlier and earlier, the weather grew considerably colder. The transformation sneaked up on everyone.
That is precisely what is occurring in the Orange County housing market. At the end of May, mortgage rates eclipsed 7%. They dropped under 6.75% in June and below 6.5% at the start of September. They have hovered between 6.13% and 6.38% for nearly three months, the longest stretch below 6.5% since August 2022, when rates were last below 6% for an extended period. Today’s lower mortgage rates have changed the climate of the housing market. The improvements have been gradual, day by day, inch by inch, until, suddenly, home affordability is much better than it was earlier in the year. The transformation sneaked up on everyone, and rates are forecasted to remain in this range for the upcoming Spring Market, providing light at the end of a dark tunnel of extremely limited pending and closed sales activity.
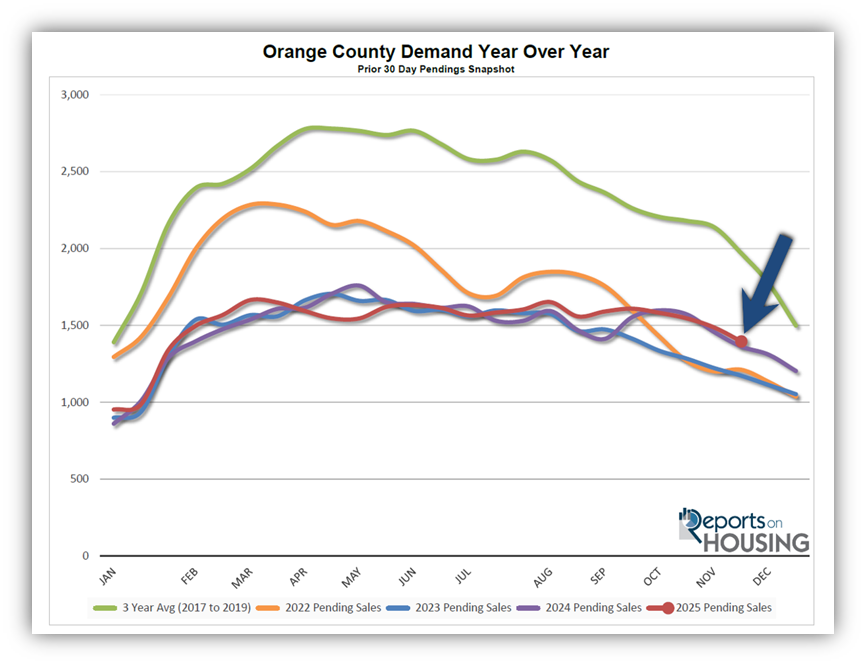
When rates skyrocketed from 3.25% in January 2022 to 7.37% in October of the same year, affordability eroded seemingly overnight. That resulted in a waterfall drop in demand that has remained at low levels ever since. Demand in 2023, 2024, and 2025 has been very similar; the only real difference was an even further drop in demand from September through December 2023, when rates breached 8%. At that level, demand further downshifted. Nonetheless, buyer demand has been noticeably subdued for three years.
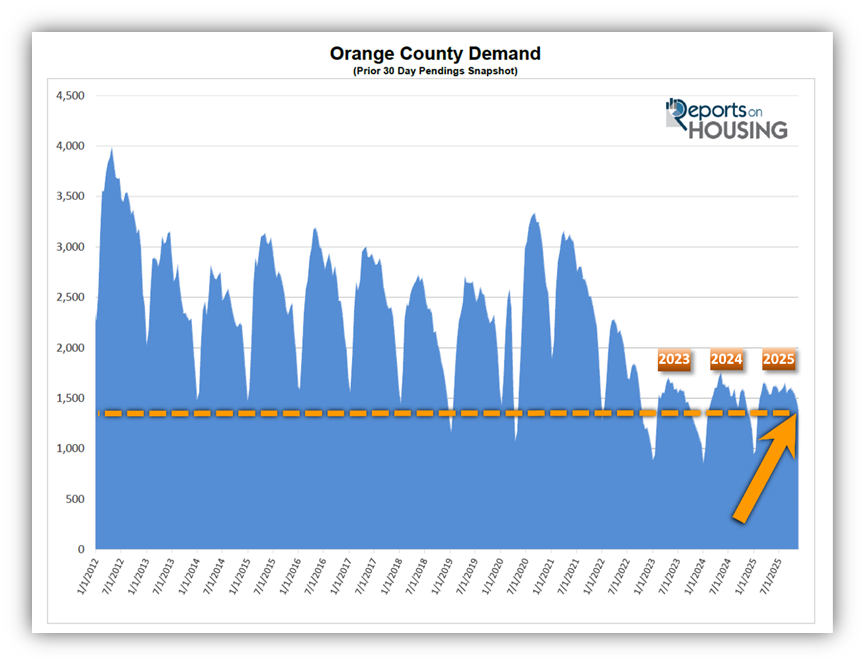
At the end of November 2021, demand (a snapshot of the number of new pending sales over the prior month) was at 2,221. Today’s demand, the highest at this time of year since 2021, is at 1,396, a substantial 37% less, or 825 fewer pending sales. It was 1,363 last year, 2% less than today; 1,173 in 2023, 16% less; and 1,212 in 2022, 13% less.
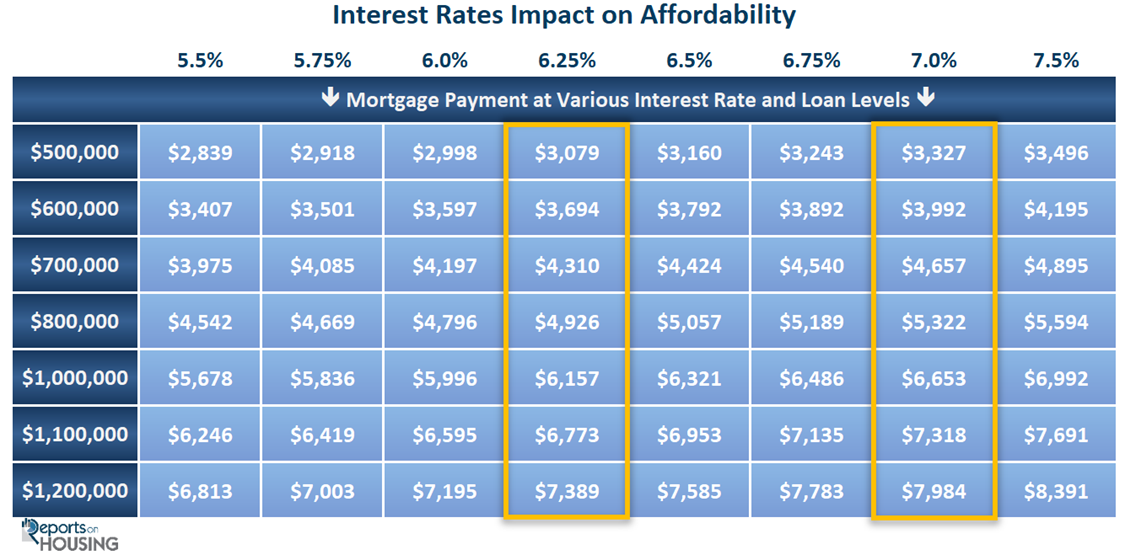
It boils down to affordability. In 2021, rates hit an all-time low at 2.65%. A $1 million mortgage at 2.65% is $4,030 monthly. At January 2022s 3.25%, it would be $4,352. Nine months later, in October 2022, rates hit 7.37%, meaning the $1 million mortgage jumped to $6,903, an extra $2,551 monthly or nearly $31,000 a year. When rates jumped, the Orange County housing market came to a screeching halt and has remained muted ever since. Rates have endured above 6% for 39 consecutive months, since August 2022. At this point, nobody is expecting rates to drop into the 3s or 4s. For the most part, they have been stuck between 6.5% and 7.5%, with only a few exceptions. Last year, between the end of August and the start of October, rates dropped between 6% and 6.5% for 45 days, the longest streak since mortgage rates left the 5s behind in 2022. It was the lowest rate of the year, after it had eclipsed 7.5% three times in April 2024. As a result, demand uncharacteristically increased during the Fall Market. Yet the excitement surrounding affordability was short-lived, as mortgage rates pushed past 7% to finish off the year.
This year was similar, with rates stuck above 7% from January through most of February, then dropped to 6.75% from the end of February to the start of April, then bounced around 7% from April through the end of May. Once again, rates were too high during the Spring Market, dampening demand and sales activity. Since May, as the U.S. labor market weakened, mortgage rates have slowly and methodically dropped. They dipped below 6.5% on September 3rd and have not looked back, improving affordability and increasing demand. It has been nearly three months at these lower levels, just about twice as long as last year.
This time, the economic backdrop is considerably different than last year. Last year, after some initial weakness over the summer, the economy strengthened and proved to be resilient from the fall through the first several months of 2025. Consequently, rates rose. Yet, from June through today, the U.S. economy has downshifted considerably, and it appears it will remain weak for months to come. Mortgage rates are forecasted to persist between 6% and 6.5% throughout 2026. This mortgage rate level came too late in 2024 and 2025, during the Fall and Holiday Markets; yet it will match up perfectly with 2026’s Spring Market.
That $1 million mortgage is $6,653 per month at 7%. It drops to $6,157 per month at today’s near 6.25% rate, $496 per month less. At 6%, it is $5,996, and at 5.5% it is $5,678, nearly a $1,000 improvement compared to 7%.
There is light at the end of the tunnel, a persistent, lower mortgage rate environment. With an improvement in affordability that matches up with the best time of the year for real estate, the Spring Market, expect demand to increase and finally break away from the lethargic, low-demand levels of 2023 through 2025. Pay careful attention. In the blink of an eye, the change in the Orange County real estate market will sneak up on everyone in the spring of 2026.
Active Listings
The inventory dropped by 5% in the past couple of weeks.
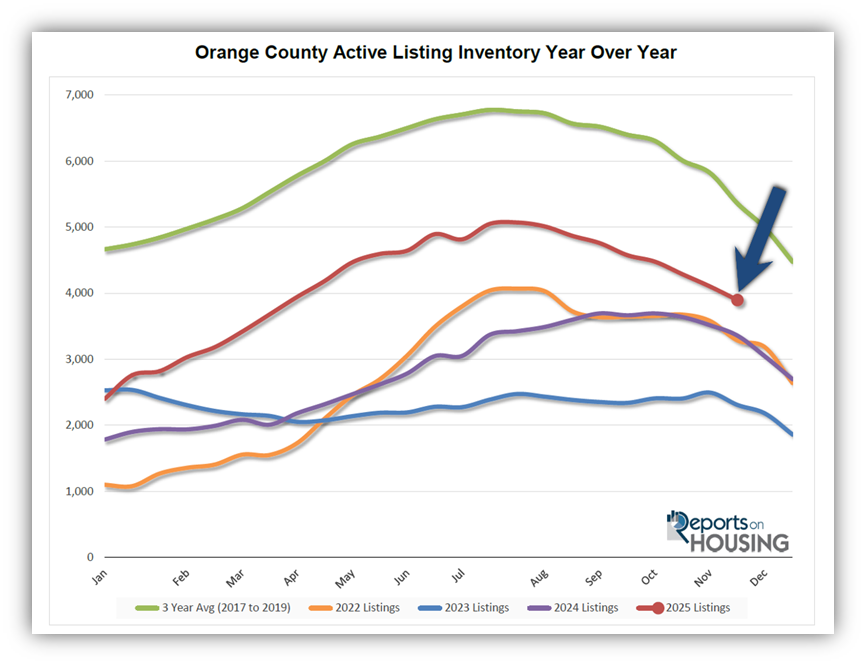
The active listing inventory plunged by 206 homes over the past two weeks, a 5% decline, and now stands at 3,897, its largest drop of the year, and its lowest level since March. The inventory has been dropping swiftly for six weeks, shedding 13%. The holidays are here. The fewest homes are placed on the market in December, and the second fewest in November. Now that Thanksgiving has arrived, many unsuccessful sellers will delist and postpone their real estate plans. More homes are pulled off the market during November and December than at any other time of the year. Expect the inventory to drop considerably until the New Year.
Last year, the inventory was at 3,358 homes, 14% fewer, or 539 less. The 3-year average before COVID (2017-2019) was 5,359, an additional 1,462 homes, or 38% more.
Homeowners continue to “hunker down” in their homes, unwilling to move because of their current, underlying, locked-in, low fixed-rate mortgage. This trend has been easing from the lows established in 2023. Through October, 26,246 homes were placed on the market in Orange County, 9,170 fewer than the 3-year average before COVID (2017-2019), 26% less. In 2024, 24,108 homes entered the market, compared to 20,624 in 2023. More sellers are opting to sell in 2025. Yet, for the third month in a row, the number of homes coming on the market was fewer compared to the prior year. In October, 2,138 homes came on the market, 6% less than last year’s 2,263.
Demand
Demand decreased by 6% in the past couple of weeks.
Demand, a snapshot of the number of new pending sales over the prior month, plunged from 1,487 to 1,396 in the past couple of weeks, representing a 91-pending-sale drop, or 6%, its largest drop of the year and its lowest level since the end of January. With the arrival of Thanksgiving comes all of the distractions: shopping, traveling, preparing, gathering, and enjoying all that the season has to offer. A substantial drop in demand accompanies these distractions. As the year closes, expect demand to drop at a slightly slower pace than the inventory. Nonetheless, it will continue to rapidly fall through January 1st, New Year’s Day.
Last year, demand was 1,363, with 33 fewer pending sales, or 2% less. The 3-year average before COVID (2017-2019) was 1,969 pending sales, 41% higher than today, representing an additional 573 pending sales.
As the Federal Reserve has indicated, it is essential to watch all economic releases for signs of slowing. That is the only path to lower mortgage rates at this time. These releases can cause mortgage rates to rise or fall, depending on how they compare with market expectations. Next week, the Institute for Supply Management’s release, an indicator of current manufacturing, and the ADP Employment Change can potentially move mortgage rates.
Expected Market Time
The Expected Market Time increased slightly over the past couple of weeks.
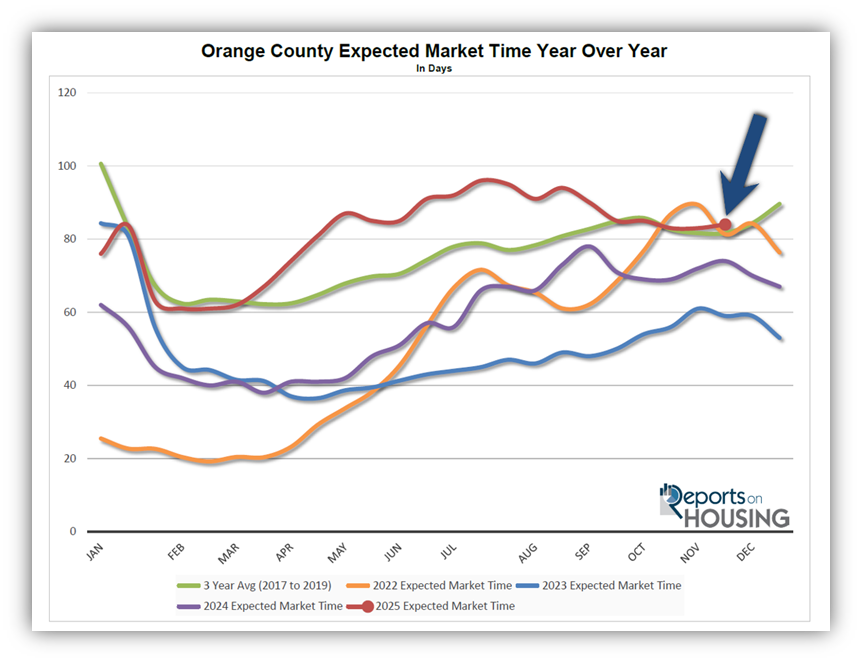
With the supply of available homes falling by 206 homes, down 5%, and demand dropping by 91 pending sales, down 6%, the Expected Market Time (the number of days it takes to sell all Orange County listings at the current buying pace) increased from 83 to 84 days in the past couple of weeks. It is the highest end of November level since 2018.
Last year, it was 74 days, slightly faster than today. The 3-year average before COVID was 85 days, similar to today.
The Expected Market Time for condominiums and townhomes increased from 92 to 94 days in the past two weeks. It was at 69 days last year. For detached homes, the Expected Market Time remained unchanged at 77 days. It was 77 days a year ago, identical to today. The detached home market is substantially stronger than the attached home market.
Luxury End
The luxury market improved over the past couple of weeks.
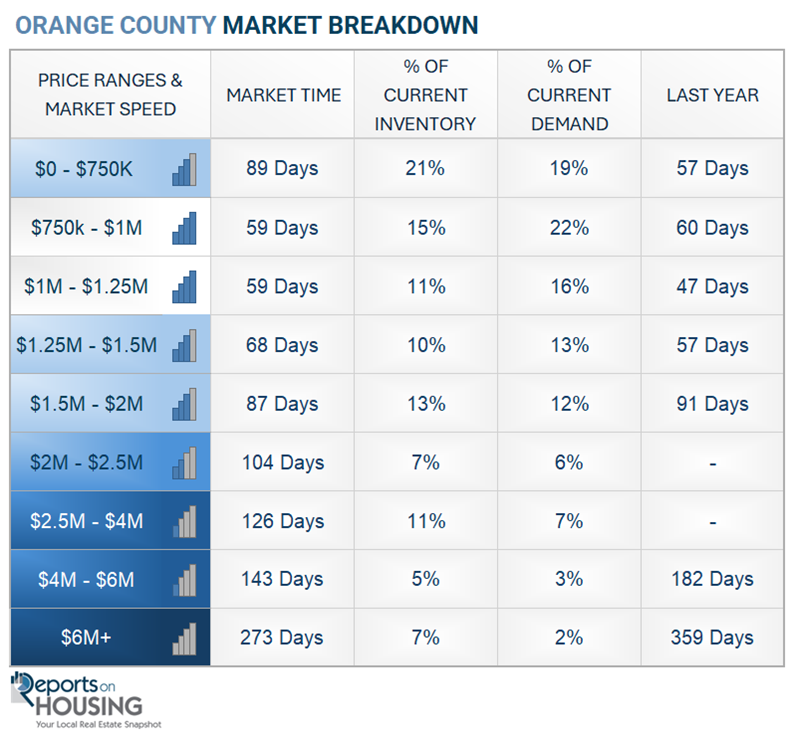
The luxury home inventory priced above $2.5 million (the top 10% of the Orange County housing market) decreased from 973 to 875, a 98-home decline, or 10%. Luxury demand decreased by five pending sales, down 3%, to 168. The Expected Market Time for luxury homes priced above $2.5 million decreased from 169 to 156 days, its strongest level since March. With fewer new luxury listings and a significant number of unsuccessful sellers delisting to enjoy the holidays, the rapid drop in inventory far exceeded the drop in demand.
In the past two weeks, the Expected Market Time for homes priced between $2.5 million and $4 million decreased from 143 to 126 days. For homes priced between $4 million and $6 million, the Expected Market Time decreased from 147 days to 143. For homes priced above $6 million, the Expected Market Time decreased from 282 to 273 days. Luxury is at 156 days overall. At this pace, a seller would be looking at becoming a pending sale around April 2026.
Orange County Housing Summary
- INVENTORY: The active listing inventory in the past couple of weeks plunged by 206 homes, down 5%, and now stands at 3,897, its lowest level since March. Last year, there were 3,358 homes on the market, 539 fewer homes, or 14% less. The 3-year average before COVID (2017-2019) was 5,359, which is 38% higher. From January through October, 26% fewer homes came on the market compared to the 3-year average before COVID (2017-2019), 9,170 less. Yet, 2,138 more sellers came on the market this year than last, and 5,622 more compared to 2023.
- DEMAND: Buyer demand, the number of pending sales over the prior month, plunged by 91, down 6%, and now stands at 1,396. Last year, there were 1,363 pending sales, 2% fewer than today. The 3-year average before COVID (2017-2019) was 1,969, which is 41% higher.
- MARKET TIME: With demand falling slightly faster than supply, the Expected Market Time, the number of days to sell all Orange County listings at the current buying pace, increased from 83 to 84 days in the past couple of weeks. It is the highest end-of-November pace since 2018. Last year, it was 74 days, slightly faster than today. The 3-year average before COVID (2017-2019) was 85 days, similar to today.
- LUXURY: In the past two weeks, the Expected Market Time for homes priced between $2.5 million and $4 million decreased from 143 to 126 days. For homes priced between $4 million and $6 million, the Expected Market Time decreased from 147 days to 143. For homes priced above $6 million, the Expected Market Time decreased from 282 to 273 days.
- DISTRESSED HOMES: Short sales and foreclosures combined, comprised only 0.1% of all listings and 0.3% of demand. No foreclosures and four short sales are available today in Orange County, with a total of four distressed homes on the active market, up one from two weeks ago. Last year, six distressed homes were on the market, similar to today.
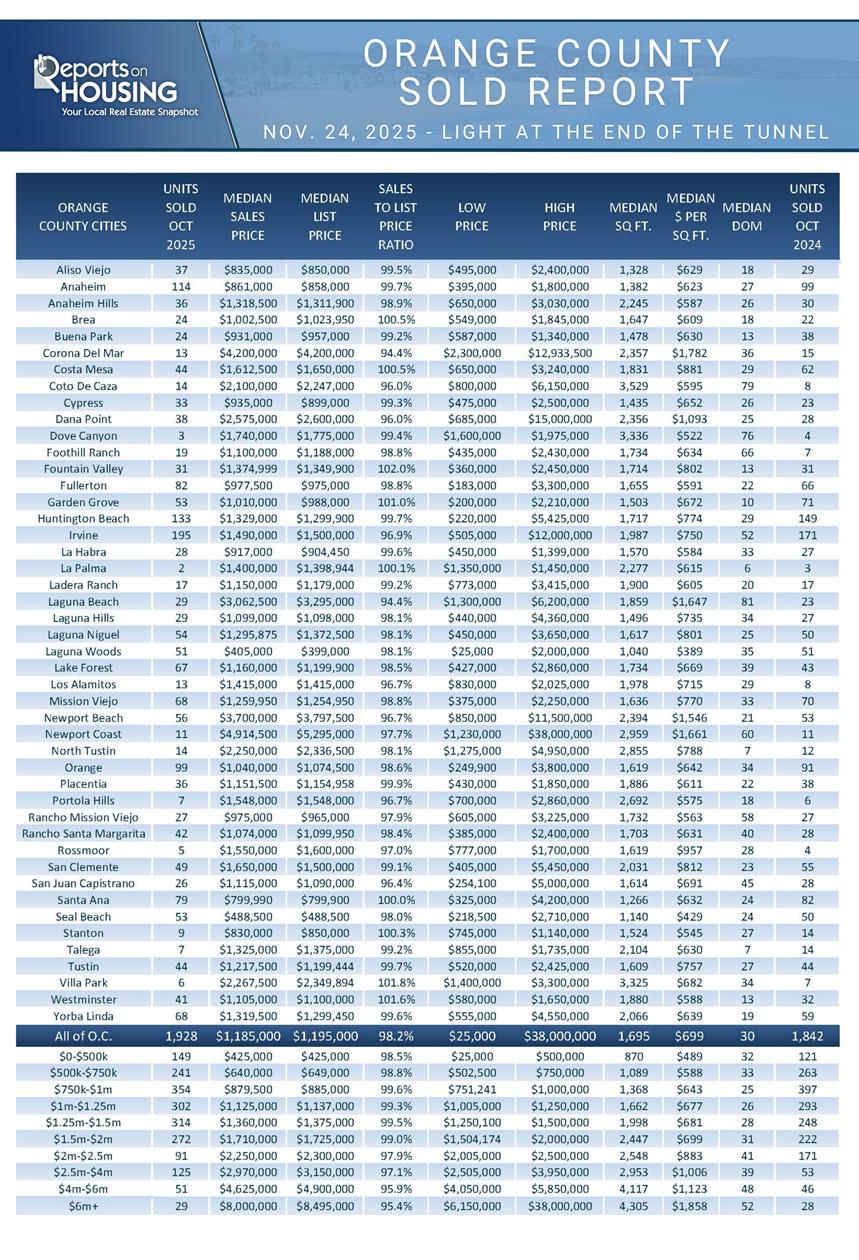
- CLOSED SALES: There were 1,928 closed residential resales in October, 5% higher than October 2024’s 1,842 sales, and up 7% from September 2025. The sales-to-list price ratio in Orange County was 98.2%. Foreclosures accounted for 0.2% of all closed sales, and short sales accounted for 0.1%. That means that 99.7% of all sales were sellers with equity.
Have a great week.
Sincerely,
Steven Thomas
Quantitative Economics and Decision Sciences
Copyright 2025—Steven Thomas, Reports On Housing—All Rights Reserved. This report may not be reproduced in whole or in part without express written permission from the author.