July 7, 2025
With half of 2025 in the rearview mirror, trends have developed that establish a slowing housing market, which relies on elevated mortgage rates.
At a Crossroads
The Orange County housing market will either slow further or accelerate depending on the direction of mortgage rates.
There are many crossroads in life where a single decision can take someone down a completely new path. Whether it’s choosing a career, getting married, or moving to a new city, each decision shapes a unique and distinct future.
Similarly, the second half of 2025 stands at a crossroads, where the pathway of mortgage rates will result in two vastly different outcomes. Will mortgage rates remain elevated, or will they fall below 6.5% with duration? The housing market is at the mercy of rates. Until rates drop, expect more of the same.
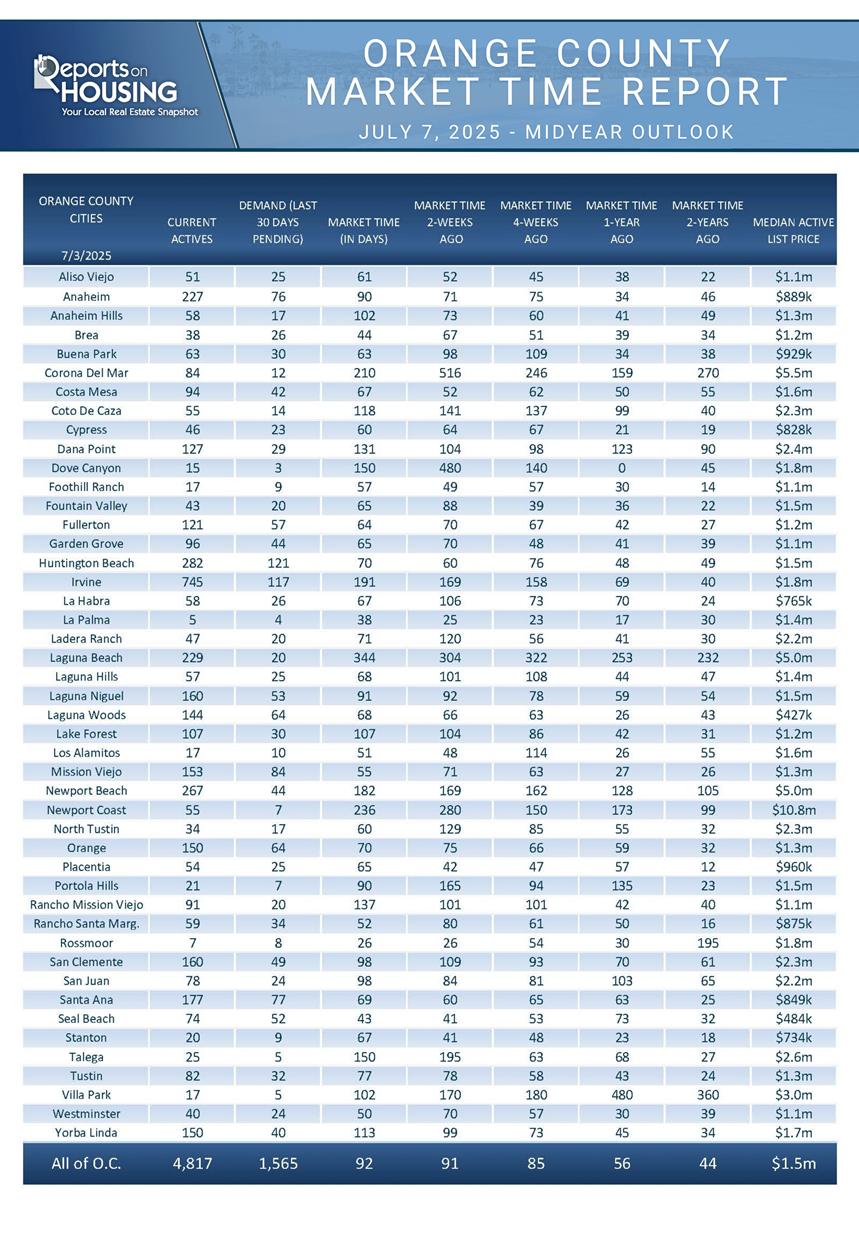
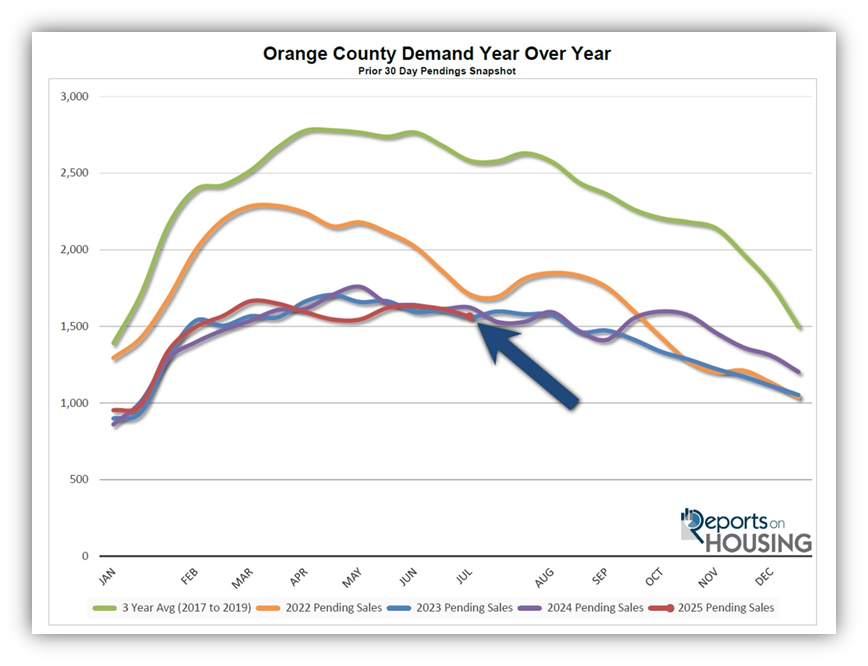
In recapping the first half of 2025, mortgage rates started the year above 7%, according to Mortgage News Daily, and did not drop into the 6s until mid-February. They bounced between 6.6% and 6.99% ever since, except for four days when they rose above 7% due to the reaction to the tariff announcement and concerns about the deficit following the details of the new tax bill. As a result of the sticky, higher-rate environment, the affordability crisis has persisted, and demand has remained essentially unchanged over the last couple of years. Demand (a snapshot of the previous 30 days of pending sales activity) is currently at 1,565 pending sales, 4% below last year’s 1,624 level, and nearly identical to the 1,560 pending sales reading in 2023.
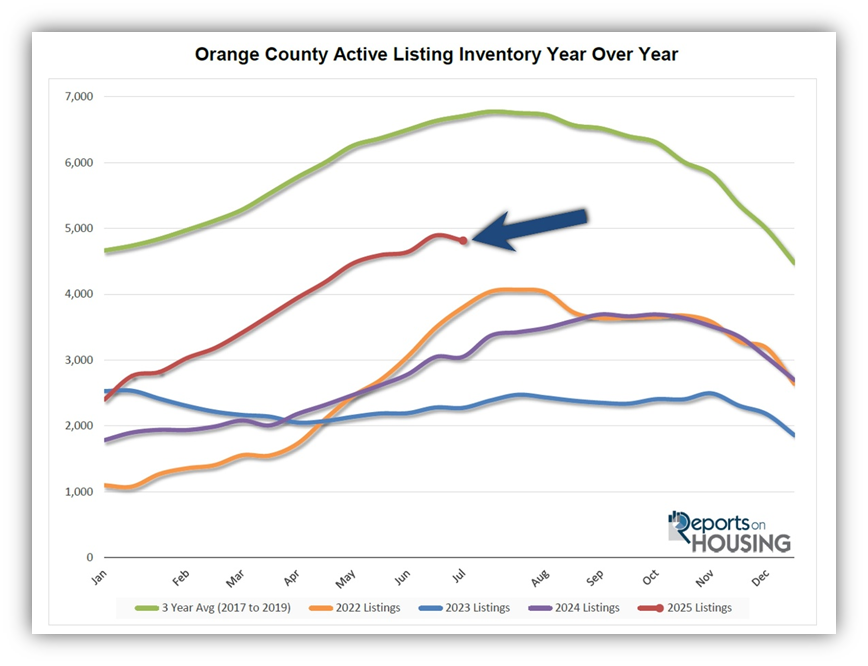
The active inventory is an entirely different story. Homeowners continue to “hunker down” in their homes, unwilling to move due to their current, underlying, locked-in, low fixed-rate mortgage, resulting in 25% fewer “For Sale” signs through June compared to the 3-year pre-pandemic average (2017-2019). Yet, there were 2,192 additional signs compared to last year, and 4,232 more than in 2023. In pairing these extra signs with similar year-over-year demand, they have accumulated and triggered a steep rise in the inventory. The supply of available homes has increased from 2,401 at the start of the year to 4,817 today, a 101% rise, or double. There are 58% more homes available today than at the same time last year, and 112% more than in 2023.
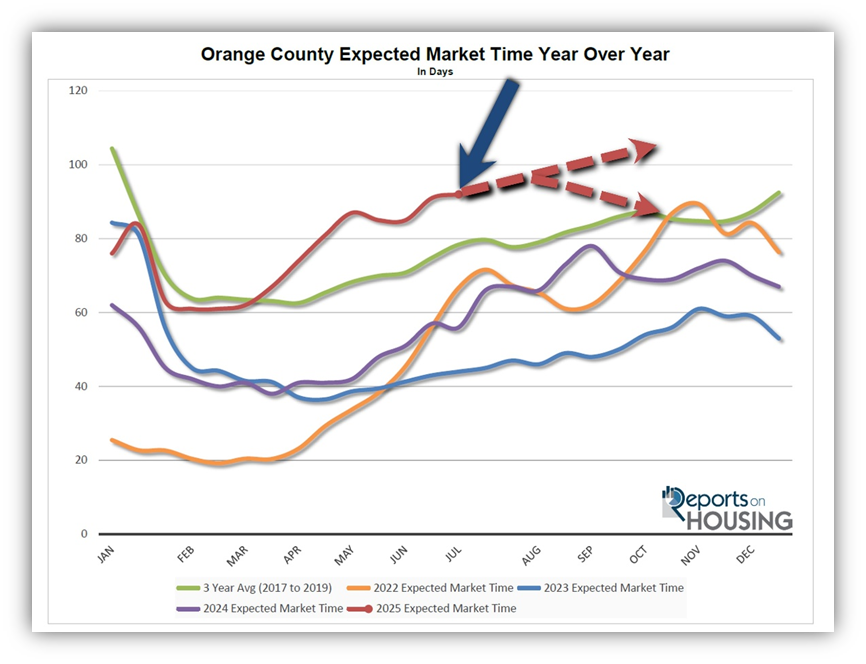
As a result of a rapidly accelerating supply of homes and similar, year-over-year muted demand, the Expected Market Time (the number of days it takes to sell all Orange County listings at the current buying pace) has steadily increased from 61 days at the end of February to 92 days today, its slowest start of July pace since 2019. With longer market times, negotiations have shifted in favor of buyers, and they are now calling more of the shots. There is also pricing pressure, and values are slowly declining from month to month.
So, where does the housing market go from here? It all depends on rates. There are two scenarios: rates remain elevated and continue to fluctuate between 6.5% and 7% for the remainder of the year, or rates drop and hover between 6% and 6.5% with duration. For mortgage rates to remain where they stand today, the economic data must continue to be similar to that of the first half of 2025. Financial market volatility persists due to ongoing tariff announcements, while strong labor market readings continue, characterized by solid job growth and low unemployment rates. Additionally, any rise in inflation due to the implementation of tariffs will keep a lid on Federal Reserve rate cuts.
In this scenario, the Expected Market Time will slowly rise from week to week. Demand will remain muted and gradually decline through the end of the year. The inventory will slowly climb until it reaches a peak, and fall progressively until New Year’s Eve. Orange County peaks typically occur during the summer, but have been occurring later in the fall due to the higher mortgage rate environment over the past few years. The market will slow until the Holiday Market in mid-November. Home values will slowly fall from month to month.
For the second scenario to occur, mortgage rates falling between 6% and 6.5% for an extended period, the U.S. economy must show signs of a looming slowdown. The Federal Reserve is closely monitoring the job market. Any cracks in labor will lead to immediate cuts in the Federal Funds Rate. Weakening job openings, a decline in job creation, a sudden and unexpected rise in unemployment, or a surge in the four-week moving average of initial jobless claims will signal a major shift in the economy. Declining consumer spending, weakening GDP, falling industrial productivity, and further drops in consumer sentiment are all additional signs of a slowdown.
Last year, from early August to the start of October, rates dropped below 6.5% for 47 consecutive days. Demand surged by 14%, a virtually unheard-of increase during the Fall Market. If rates follow a similar pattern to last year and remain there for the rest of the year, demand would surge higher. Millennials and Generation Z homebuyers who have been waiting for home affordability to improve will finally have the opportunity to purchase. The biggest difference between last year and this year is the abundance of additional choices with a much higher inventory. The increase in demand would result in a limited rise in the active listing inventory. The inventory would peak earlier than in the first scenario. With fewer available homes and higher demand, the Expected Market Time would decrease, and the housing market would improve from week to week. Home values would stabilize and potentially rise on a monthly basis by the end of the year.
The Orange County housing market is at a crossroads. The speed of the market depends entirely on the direction of mortgage rates, which hinges on the direction of the U.S. economy.
Active Listings
The inventory slid by 2% over the past couple of weeks due to the holiday week.
The active listing inventory decreased by 77 homes over the past two weeks, representing a 2% decline, and now stands at 4,817, marking its first drop of the year. It is still at its highest July reading since 2019, when there were 7,561 homes on the market. Many sellers placed their homes on “HOLD” to enjoy the 3-day holiday weekend after enduring the most sluggish housing market since 2019. From here, expect the inventory to continue rising at a slow pace until it reaches its peak later this summer or into the fall, depending on the direction of mortgage rates. After peaking, it will slowly fall until ringing in the New Year.
Last year, the inventory was at 3,052 homes, 37% lower, or 1,756 fewer. The 3-year average before COVID (2017-2019) was 6,708, an additional 1,891 homes, or 39% more.
Homeowners continue to “hunker down” in their homes, unwilling to move due to their current underlying, locked-in, low fixed-rate mortgage. This trend has been easing from the lows established in 2023. Through June, 16,578 homes were placed on the market in Orange County, 5,562 fewer than the 3-year average before COVID (2017-2019), 25% less. In 2024, only 14,386 homes entered the market, and in 2023, it was only 12,346. More sellers are opting to sell in 2025.
Demand
Demand decreased by 3% in the past couple of weeks.
Demand, a snapshot of the number of new pending sales over the prior month, decreased from 1,614 to 1,565 in the past couple of weeks, representing a 49-pending-sale decline, or 3%, its largest drop since the start of April. Similar to sellers, many buyers paused their home search efforts to enjoy the 4th of July week, one of the biggest universal distractions during the summer. Demand is expected to rise slightly over the next couple of weeks, now that Independence Day is behind us, but will then slowly decline through the end of the year. The only change in the trajectory of demand would be if rates fall below 6.5% in the event of an economic slowdown. That would ignite demand.
Last year, demand was 1,624, with 59 additional pending sales, or 4% more. The 3-year average before COVID (2017-2019) was 2,582 pending sales, 65% higher than today, representing an additional 1,017 sales.
As the Federal Reserve has indicated, watching all economic releases for signs of slowing is essential. That is the only path to lower mortgage rates at this time. These releases can cause mortgage rates to move higher or lower, depending on how they compare to market expectations. Next week is a busy week with the release of the Consumer Price Index (CPI), and the Producer Price Index (PPI) and the Consumer Price Index (CPI), two crucial inflation indicators. Finally, next Thursday, Retail Sales will be released.
Expected Market Time
The Expected Market Time has grown by one day over the past couple of weeks.
With the supply of available homes dropping by 77 homes, down 2%, and demand dropping by 49 pending sales, down 3%, the Expected Market Time (the number of days it takes to sell all Orange County listings at the current buying pace) increased from 91 to 92 days in the past couple of weeks, its highest June level since 2019.
Last year, it was 56 days, substantially faster than today. The 3-year average before COVID was 78 days, which is also much quicker than today.
The Expected Market Time for condominiums and townhomes increased from 81 to 85 days in the past two weeks. It was at 59 days last year. For detached homes, the Expected Market Time decreased from 98 to 97 days. It was 59 days a year ago.
Luxury End
The luxury market slowed in the past couple of weeks.
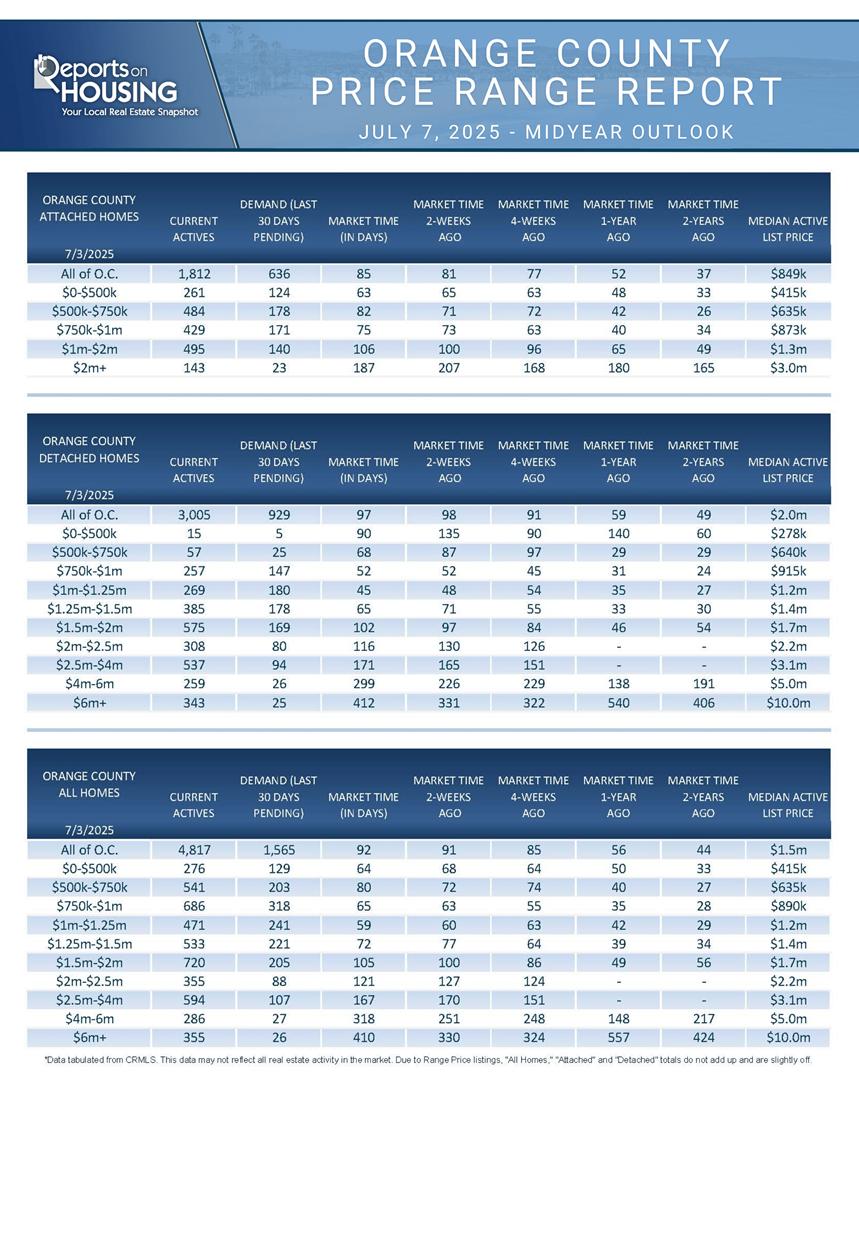
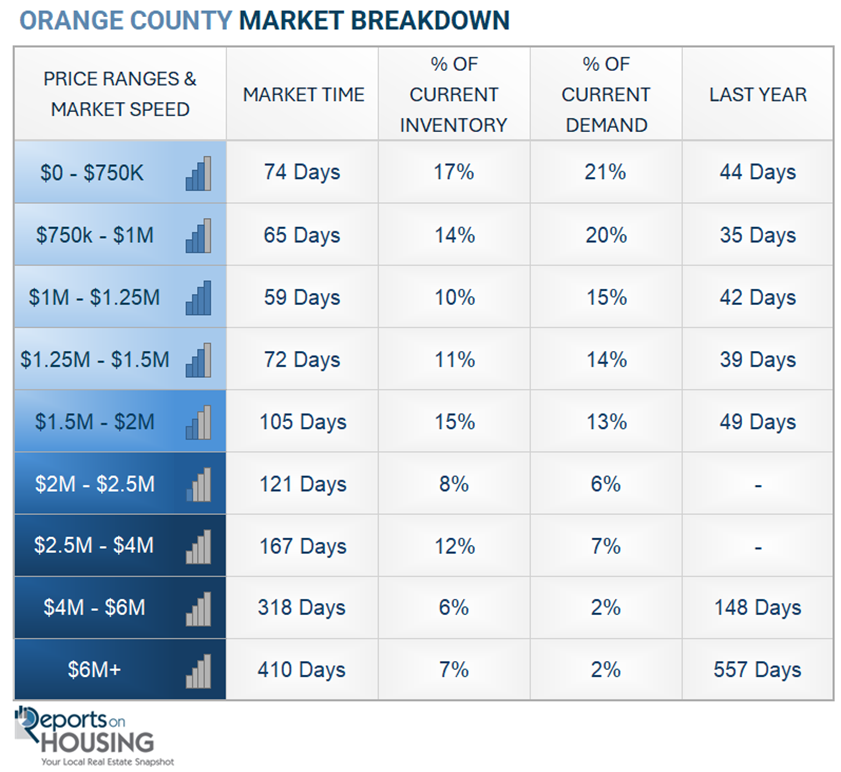
The luxury inventory of homes priced above $2.5 million (the top 10% of the Orange County housing market) decreased from 1,238 to 1,235 homes, a drop of three homes, or nearly unchanged. Luxury demand decreased by 11 pending sales, down 7%, and now sits at 160. The Expected Market Time for luxury homes priced above $2.5 million increased from 216 to 232 days, its highest reading of the year. Expect the luxury market to continue to moderate and cool somewhat during the Summer Market.
In the past two weeks, the Expected Market Time for homes priced between $2.5 million and $4 million decreased from 170 to 167 days. For homes priced between $4 million and $6 million, the Expected Market Time increased from 251 to 318 days. For homes priced above $6 million, the Expected Market Time increased from 330 to 410 days. At 410 days, a seller would be looking at placing their home into escrow around August 2026.
Orange County Housing Summary
- INVENTORY: The active listing inventory in the past couple of weeks decreased by 77 homes, down 2%, and now sits at 4,817. Last year, there were 3,052 homes on the market, 1,765 fewer homes, or 37% less. The 3-year average before COVID (2017-2019) was 6,708, which is 39% higher. From January through June, 25% fewer homes came on the market compared to the 3-year average before COVID (2017-2019), 5,562 less. Yet, 2,192 more sellers came on the market this year than last, and 4,232 more compared to 2023.
- DEMAND: Buyer demand, the number of pending sales over the prior month, decreased from 1,614 to 1,565. Last year, there were 1,624 pending sales, 4% higher than today. The 3-year average before COVID (2017-2019) was 2,582, which is 65% higher.
- MARKET TIME: With demand falling faster than supply, the Expected Market Time, the number of days to sell all Orange County listings at the current buying pace, increased slightly from 91 to 92 days in the past couple of weeks, its highest July level since 2019. Last year, it was 56 days, substantially faster than today. The 3-year average before COVID (2017-2019) was 78 days, which is also significantly faster than today.
- LUXURY: In the past two weeks, the Expected Market Time for homes priced between $2.5 million and $4 million decreased from 170 to 167 days. For homes priced between $4 million and $6 million, the Expected Market Time increased from 251 to 318 days. For homes priced above $6 million, the Expected Market Time increased from 330 to 410 days.
- DISTRESSED HOMES: Short sales and foreclosures combined, comprised only 0.3% of all listings and 0.3% of demand. Only nine foreclosures and five short sales are available today in Orange County, with a total of 14 distressed homes on the active market, up two from two weeks ago. Last year, seven distressed homes were on the market, similar to today.
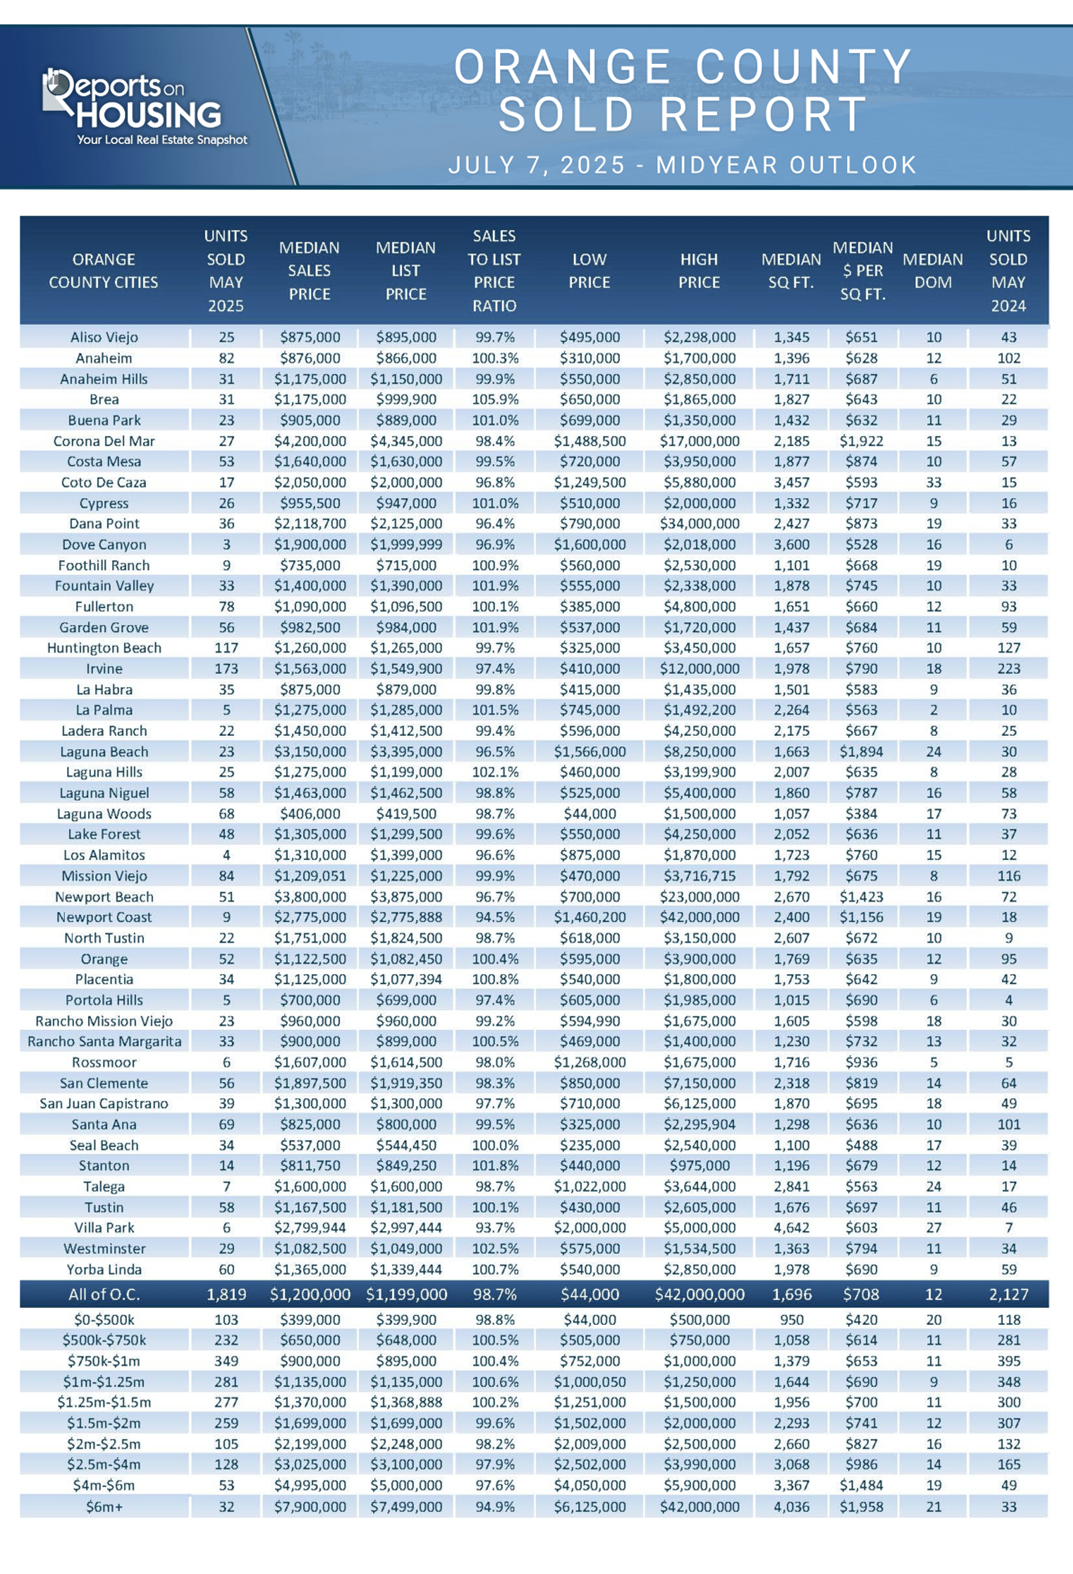
- CLOSED SALES: There were 1,819 closed residential resales in May, down 14% compared to May 2024’s 2,127 and down 2% from April 2025. The sales-to-list price ratio was 98.7% for Orange County. Foreclosures accounted for 0.2% of all closed sales, and short sales accounted for 0.1%. That means that 99.7% of all sales were sellers with equity.
Have a great week.
Sincerely,
Steven Thomas
Quantitative Economics and Decision Sciences
Copyright 2025—Steven Thomas, Reports On Housing—All Rights Reserved. This report may not be reproduced in whole or in part without express written permission from the author.