September 16, 2024
Housing has been slowing through both the Spring and Summer Markets, yet the slowdown has picked up its pace since transitioning to the Autumn Market.
Housing is Slowing
The Orange County housing market has downshifted considerably since March.
Returning to their classrooms, kids are adjusting to their busy school calendars. Fall youth sports have also resumed with their demanding practice and game schedules. Upon entering the local grocery store, boxes of bright orange pumpkins adorn the entrance. Coffee shops are busy making their most popular seasonal latte, Pumpkin Spice. The sun is setting earlier and earlier by the day. That’s right, Autumn has arrived. It may not officially start until Sunday, September 22nd, but all the signs are here.
These changes also indicate that the start of the housing Autumn Market has arrived. The Autumn Market begins the moment kids go back to school at the end of August, a bit earlier than the fall equinox, and ends a week before Thanksgiving, the start of the Holiday Market. The best time of the year for housing is during the Spring Market. That is when buyer demand reaches a peak. Many people, especially families with children in school, prefer to isolate their home during the spring and close during the summer while the kids are on break. The inventory rises during the spring as well.
The second best time of the year for the housing market is the Summer Market. The market slows a bit due to all the distractions, including family vacations, summer camps, the beach, the community pool, and amusement parks. There is still plenty of demand, yet it is slowly declining. The inventory normally rises until it finds its peak between July and August and then gradually falls.
During the Autumn Market, the “prime time” season for real estate is now in the rearview mirror. Housing transitions to a slower time of the year. Typically, the inventory and demand decrease slightly at a very similar rate, and the Expected Market Time (the time between hammering in the FOR-SALE sign to becoming a pending sale) does not change much.
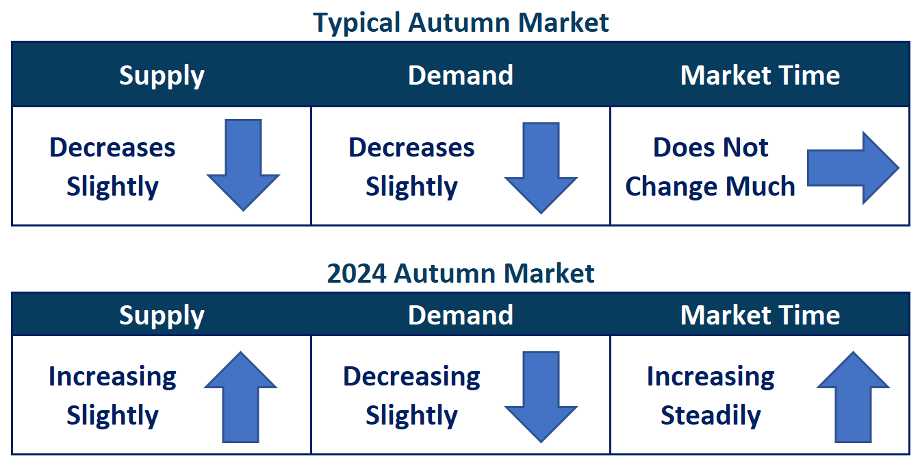
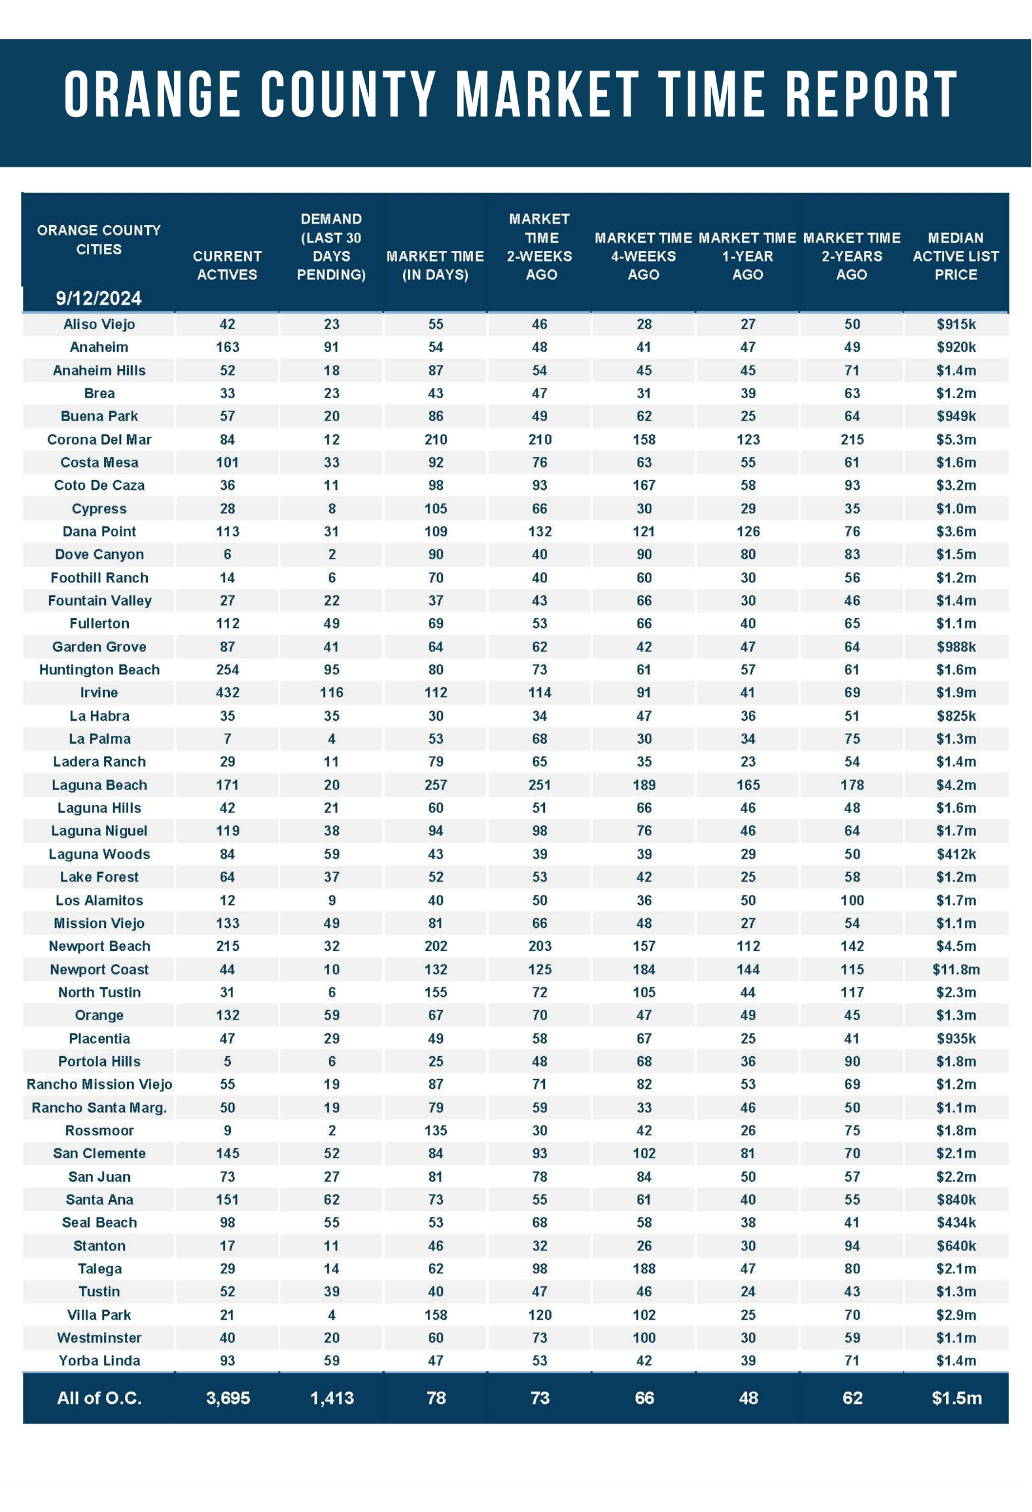
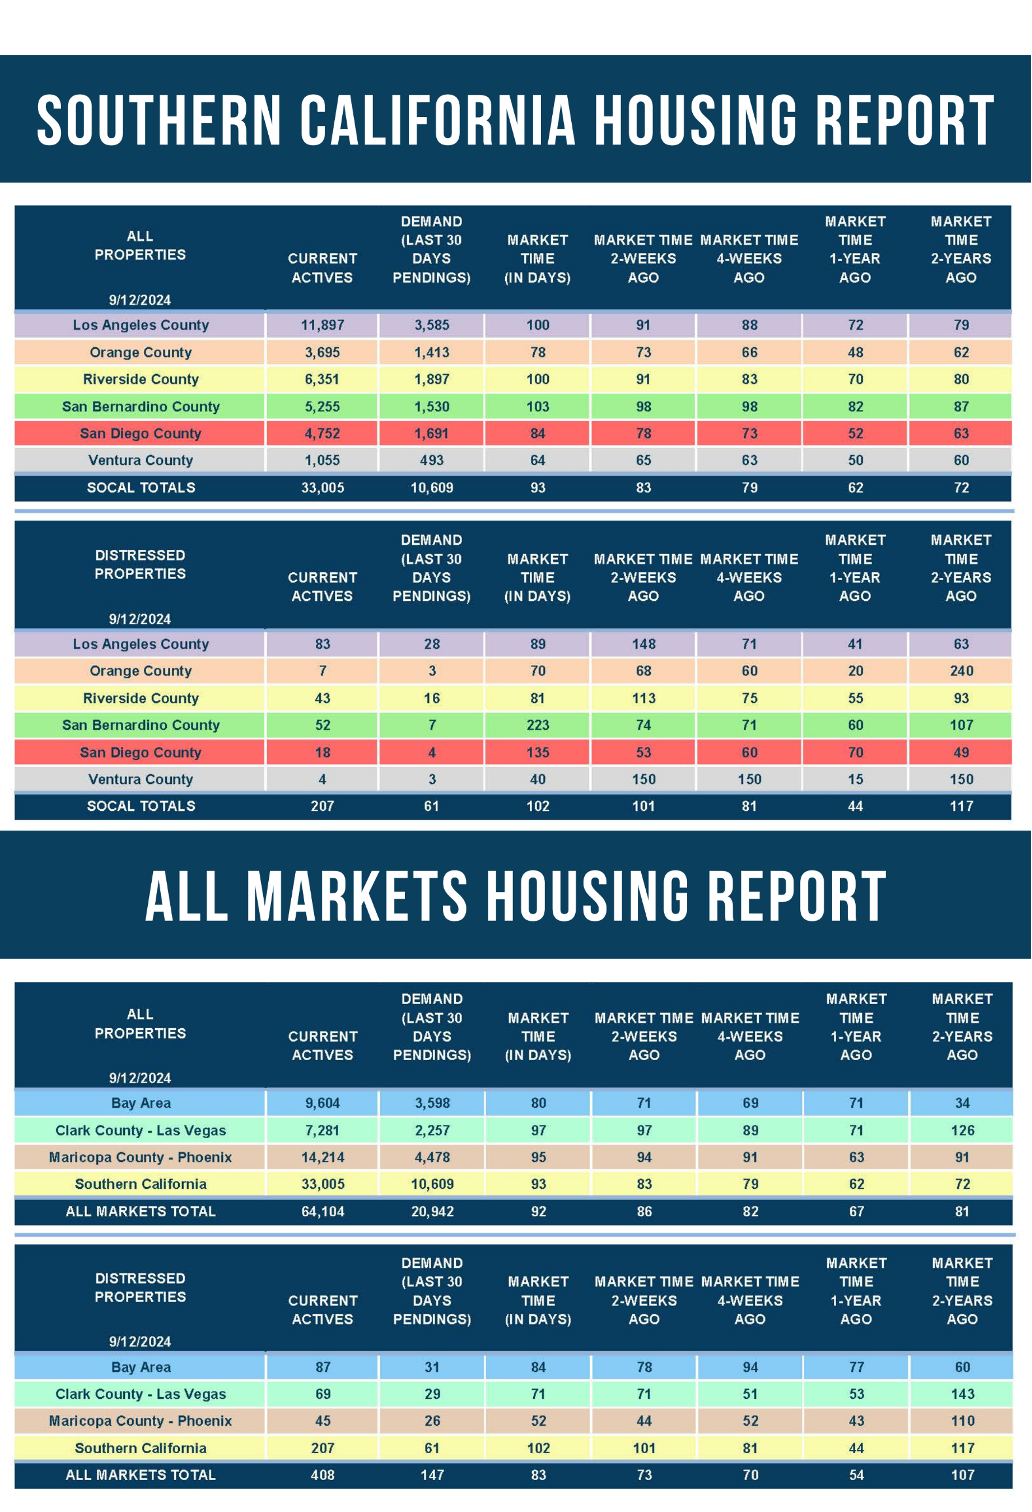
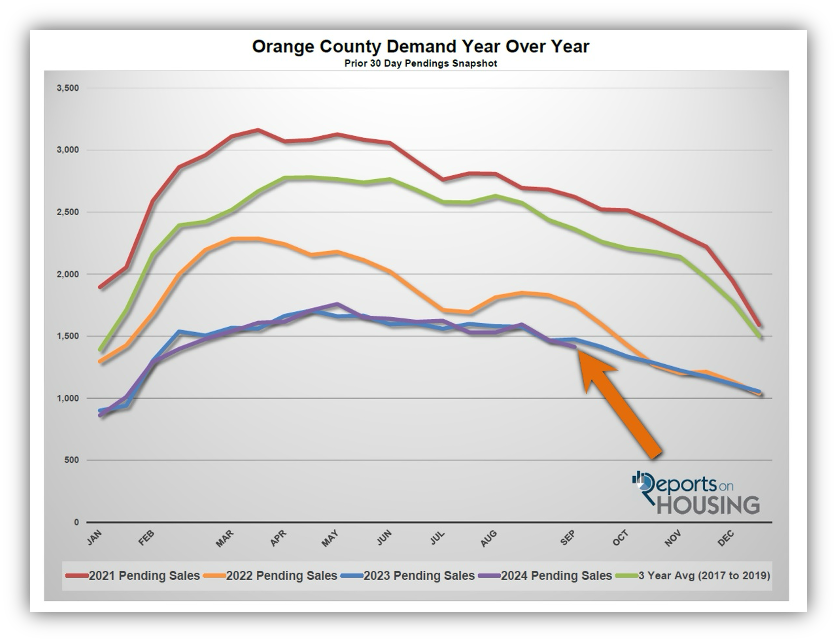
This year has not been typical at all. Since peaking in May with 1,759 pending sales, demand (a snapshot of the number of new pending sales over the prior month) has dropped to 1,413, shedding 346 pending sales or 20%. On the other hand, the active inventory has been on the rise all year. Since May’s 2,470 home level, the inventory has grown to 3,695, up a stunning 50% or 1,225 additional homes. With the supply of homes rising and demand falling, the Expected Market Time has grown from 42 days in May to 78 days today.
What is occurring is that more homeowners are opting to sell this year, and they are accumulating over time. The extra sellers are competing against a dwindling buyer pool; thus, the market has been decelerating. Ask anyone within the real estate trenches, and they will attest to the downshift in the market and the fact that it is taking longer to secure a sale.
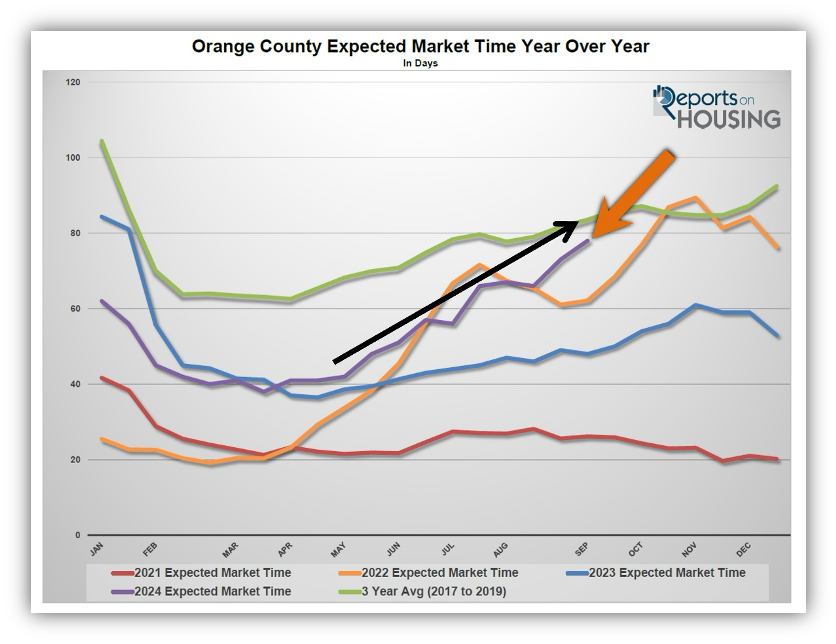
Since the start of the Autumn Market about four weeks ago, the Orange County housing market has been rapidly cooling. The inventory has climbed from 3,490 in mid-August to 3,695 today, increasing by 205 homes or 6%. Demand has decreased from 1,594 to 1,413 pending sales, down 181 or 11%. The Expected Market Time has risen from 66 to 78 days in the past month alone. That is quite a jump when it typically is flat during this time of year. It is the highest mid-September reading since 2019, five years ago.
This market slowdown comes when rates have been declining, improving affordability and allowing more buyers to enter the market. Rates eclipsed 7.5% in April and bounced around 7% from May through July. It was not until August, when the job market showed signs of cooling, signaling future Federal Reserve rate cuts starting this month, that mortgage rates began to fall materially. According to Mortgage News Daily, they have plunged from 6.9% at the end of July to 6.12% today, knocking on the door of rates dropping below 6% for the first time since August 2022, over two years ago.
This is the most buyer-friendly Orange County housing market in years. With lower rates and pressure for them to continue to decline, a rising inventory, and falling demand, meaning less buyer competition, right now is a great time to be a buyer.
ATTENTION BUYERS: Do not wait for prices to plunge before purchasing. Buyers who attempt to time the market end up regretting the delay and often get burned. Since rates are forecasted to continue to fall with a cooling economy, more buyer demand is on the horizon. Rates have only plunged recently, starting at the tail end of the Summer Market. Improved affordability did not align with real estate’s busiest time of the year. Yet, it will line up much better with the 2025 market, and housing will be hotter with tremendous competition and rising values.
ATTENTION SELLERS: Today’s market requires a meticulous, cautious approach to pricing. Overprice and it will result in wasted market time and an unsuccessful outcome. Homes that are in excellent condition, attractively upgraded, recently updated, and ready for an immediate move-in will attract the most attention and will sell the fastest as long as they are appropriately priced. Competition among sellers has been on the rise, demanding careful pricing and for many to sharpen their pencils.
It will be a frosty Autumn Market, much cooler than usual. Buyers and sellers should plan accordingly.
Active Listings
The active inventory increased by 3% in the past couple of weeks.
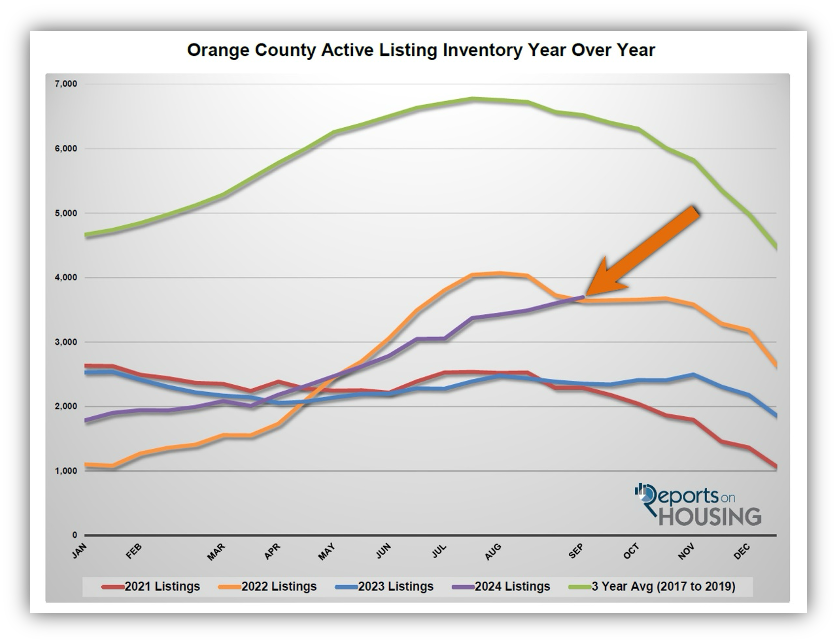
The active listing inventory increased by 96 homes in the past two weeks, up 3%, and now sits at 3,695, its highest level since September 2022. Typically occurring between July and August, the Orange County peak is past due. Even though homeowners have been “hunkering down,” unwilling to move due to their current underlying, locked-in, low fixed-rate mortgages (31% fewer sellers in August compared to the 3-year average before COVID from 2017 to 2019), there were 300 more homes that came on the market this August compared to August 2023. This has been true for every month in 2024. So far this year, it has amounted to 2,695 extra FOR-SALE signs, up 16% in a year. These extra sellers have faced nearly identical year-over-year demand, resulting in a considerable rise in the inventory. The peak will continue to be delayed, and the market slowdown will persist until demand picks up due to falling rates.
Last year, the inventory was 2,353 homes, 36% lower, or 1,342 fewer. The 3-year average before COVID (2017 through 2019) was 6,520, an additional 2,825 homes, or 76% more. This difference has been diminishing as the year progressed.
Demand
Demand declined by 4% in the past couple of weeks.
Demand, a snapshot of the number of new pending sales over the prior month, declined from 1,470 to 1,413 in the past couple of weeks, down 57 pending sales, or 4%, its lowest level since February. Affordability continues to improve, as does a buyer’s purchasing power, but it has not yet translated to an increase in demand. The current more affordable mortgage rate levels are coming too late in the year to impact the housing market adequately. Nonetheless, as more buyers take notice and rates drop, more buyers will eventually start searching for a home. Rates are down and projected to fall further, and there are more homes to choose from than any other time in the past couple of years. Carefully watch the coming demand readings as they may rise as soon as the Federal Reserve starts its cutting cycle later this week with more cuts to come.
As the Federal Reserve has indicated, watching all economic releases for signs of slowing is essential. These releases can potentially move mortgage rates higher or lower, depending on how they stack up compared to market expectations. It is a busy week with the Census Bureau releasing retail sales tomorrow and the Federal Reserve’s press conference on Wednesday to announce the beginning of rate cuts, the size of the cut, and a forecast for future cuts this year and into 2025. These releases have a strong potential to move mortgage rates.
Last year, demand was 1,474, up 61 pending sales or 4%. The 3-year average before COVID (2017 to 2019) was 2,363 pending sales, 67% more than today, or an additional 950.
With supply rising and demand falling, the Expected Market Time (the number of days it takes to sell all Orange County listings at the current buying pace) increased from 73 to 78 days in the past couple of weeks, its highest level since January 2023. Last year, it was 48 days, considerably faster than today. The 3-year average before COVID was 84 days, slightly slower than today.
Luxury End
The luxury market improved slightly in the past couple of weeks.
In the past couple of weeks, the luxury inventory of homes priced above $2 million (the top 10% of the Orange County housing market) decreased from 1,225 to 1,198 homes, down 27 or 2%. Luxury demand increased by three pending sales, up 1%, and now sits at 239. With supply falling and demand rising, the Expected Market Time for luxury homes priced above $2 million decreased from 156 to 150 days, identical to four weeks ago. Nonetheless, at 150 days, the luxury market is far from instant, especially in the even higher luxury price ranges.
Year over year, the active luxury inventory is up by 400 homes or 50%, and luxury demand is up by 56 pending sales or 31%. Last year’s Expected Market Time was 131 days, a bit faster than today.
In the past two weeks, the expected market time for homes priced between $2 million and $4 million increased from 110 to 111 days. For homes priced between $4 million and $6 million, the Expected Market Time decreased from 351 to 257 days. For homes priced above $6 million, the Expected Market Time decreased from 329 to 295 days. At 295 days, a seller would be looking at placing their home into escrow around July 2025.
Orange County Housing Summary
- The active listing inventory in the past couple of weeks increased by 96 homes, up 3%, and now sits at 3,695, its highest level since September 2022. In August, 31% fewer homes came on the market compared to the 3-year average before COVID (2017 to 2019), 1,083 less. Yet, 300 more sellers came on the market this August compared to August 2023. Last year, there were 2,353 homes on the market, 1,342 fewer homes, or 36% less. The 3-year average before COVID (2017 to 2019) was 6,520, or 76% extra.
- Demand, the number of pending sales over the prior month, decreased by 57 pending sales in the past two weeks, down 4%, and now totals 1,413, its lowest level since February. Last year, there were 1,474 pending sales, 3% more. The 3-year average before COVID (2017 to 2019) was 2,363, or 67% more.
- With supply rising and demand falling, the Expected Market Time, the number of days to sell all Orange County listings at the current buying pace, increased from 73 to 78 days in the past couple of weeks, its highest level since January 2023. It was 48 days last year, faster than today. The 3-year average before COVID (2017 to 2019) was 84 days, a bit slower than today.
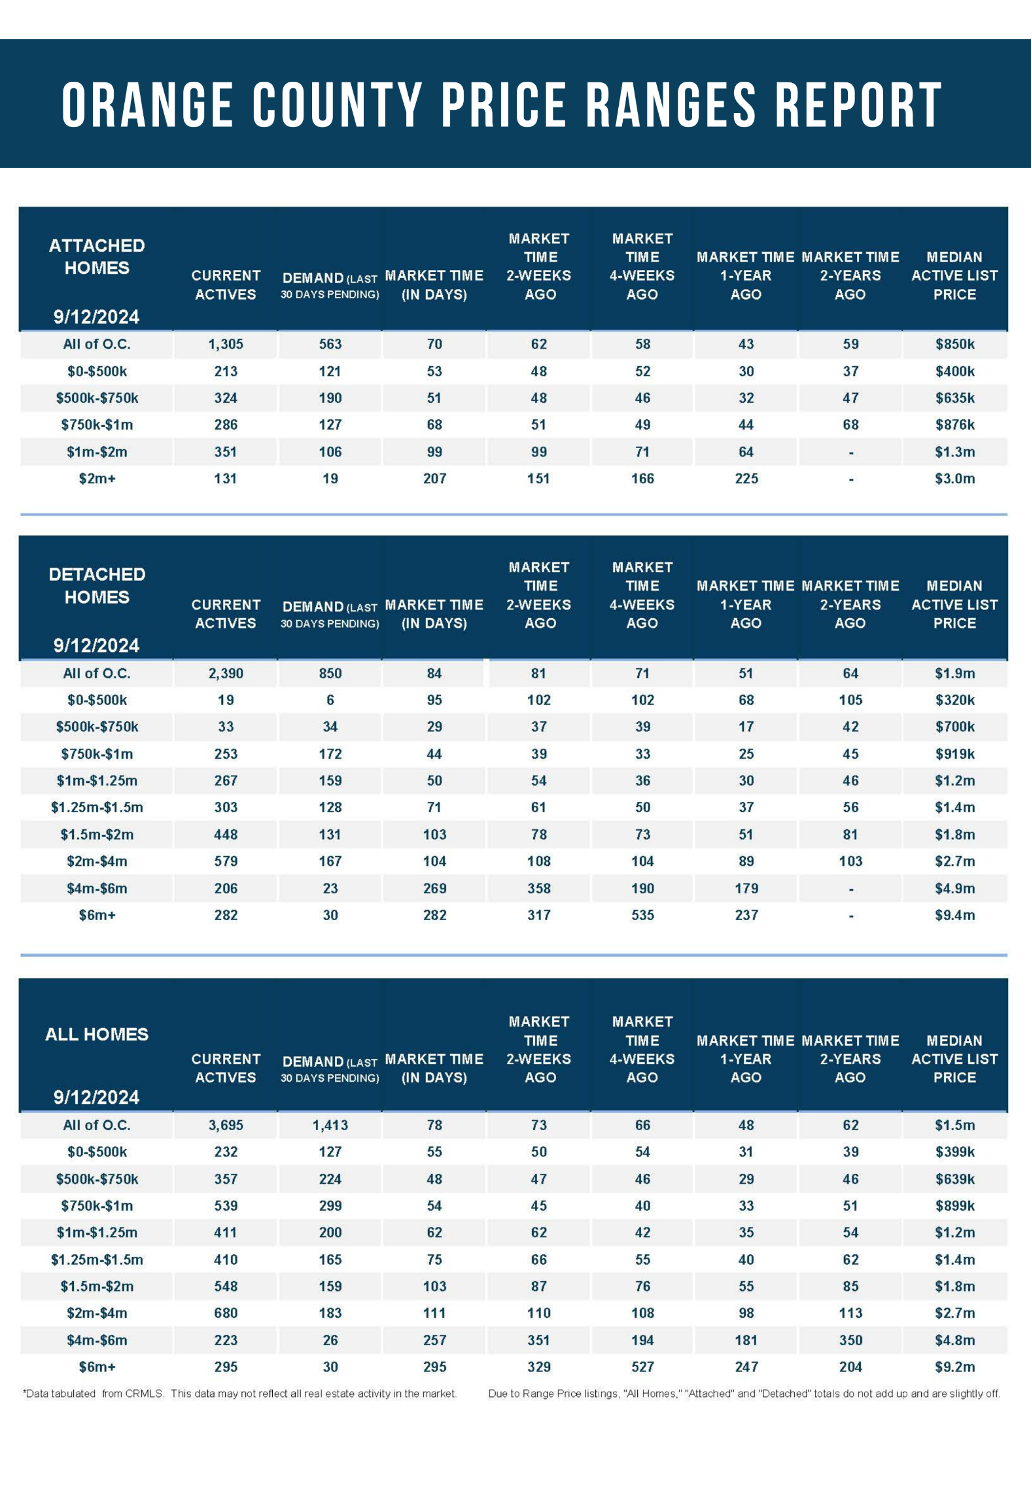
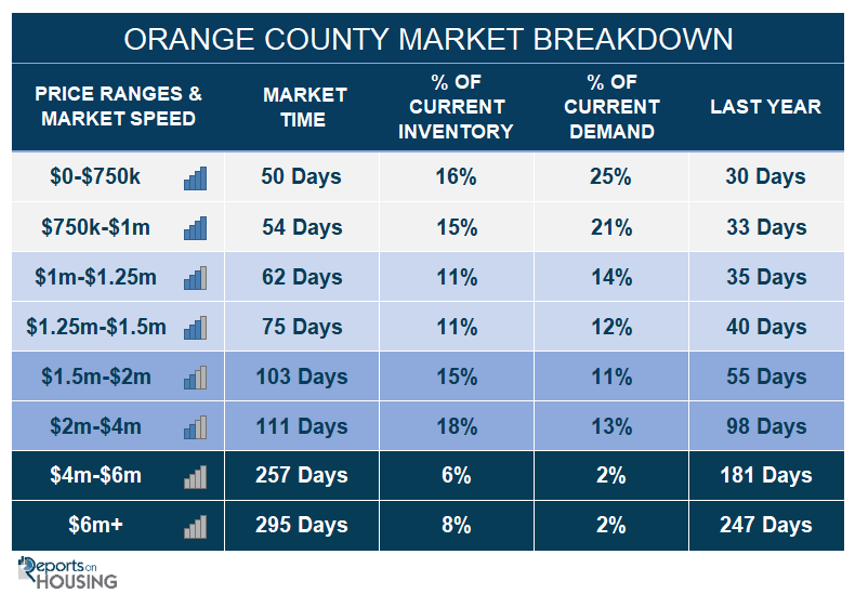
- In the past two weeks, the Expected Market Time for homes priced below $750,000 increased from 48 to 50 days. This range represents 16% of the active inventory and 25% of demand.
- The Expected Market Time for homes priced between $750,000 and $1 million increased from 45 to 54 days. This range represents 15% of the active inventory and 21% of demand.
- The Expected Market Time for homes priced between $1 million and $1.25 million remained unchanged at 62 days. This range represents 11% of the active inventory and 14% of demand.
- The Expected Market Time for homes priced between $1.25 million and $1.5 million increased from 66 to 75 days. This range represents 11% of the active inventory and 12% of demand.
- The Expected Market Time for homes priced between $1.5 million and $2 million increased from 87 to 103 days. This range represents 15% of the active inventory and 11% of demand.
- In the past two weeks, the expected market time for homes priced between $2 million and $4 million increased from 110 to 111 days. For homes priced between $4 million and $6 million, the Expected Market Time decreased from 351 to 257 days. For homes priced above $6 million, the Expected Market Time decreased from 329 to 295 days.
- The luxury end, all homes above $2 million, account for 32% of the inventory and 17% of demand.
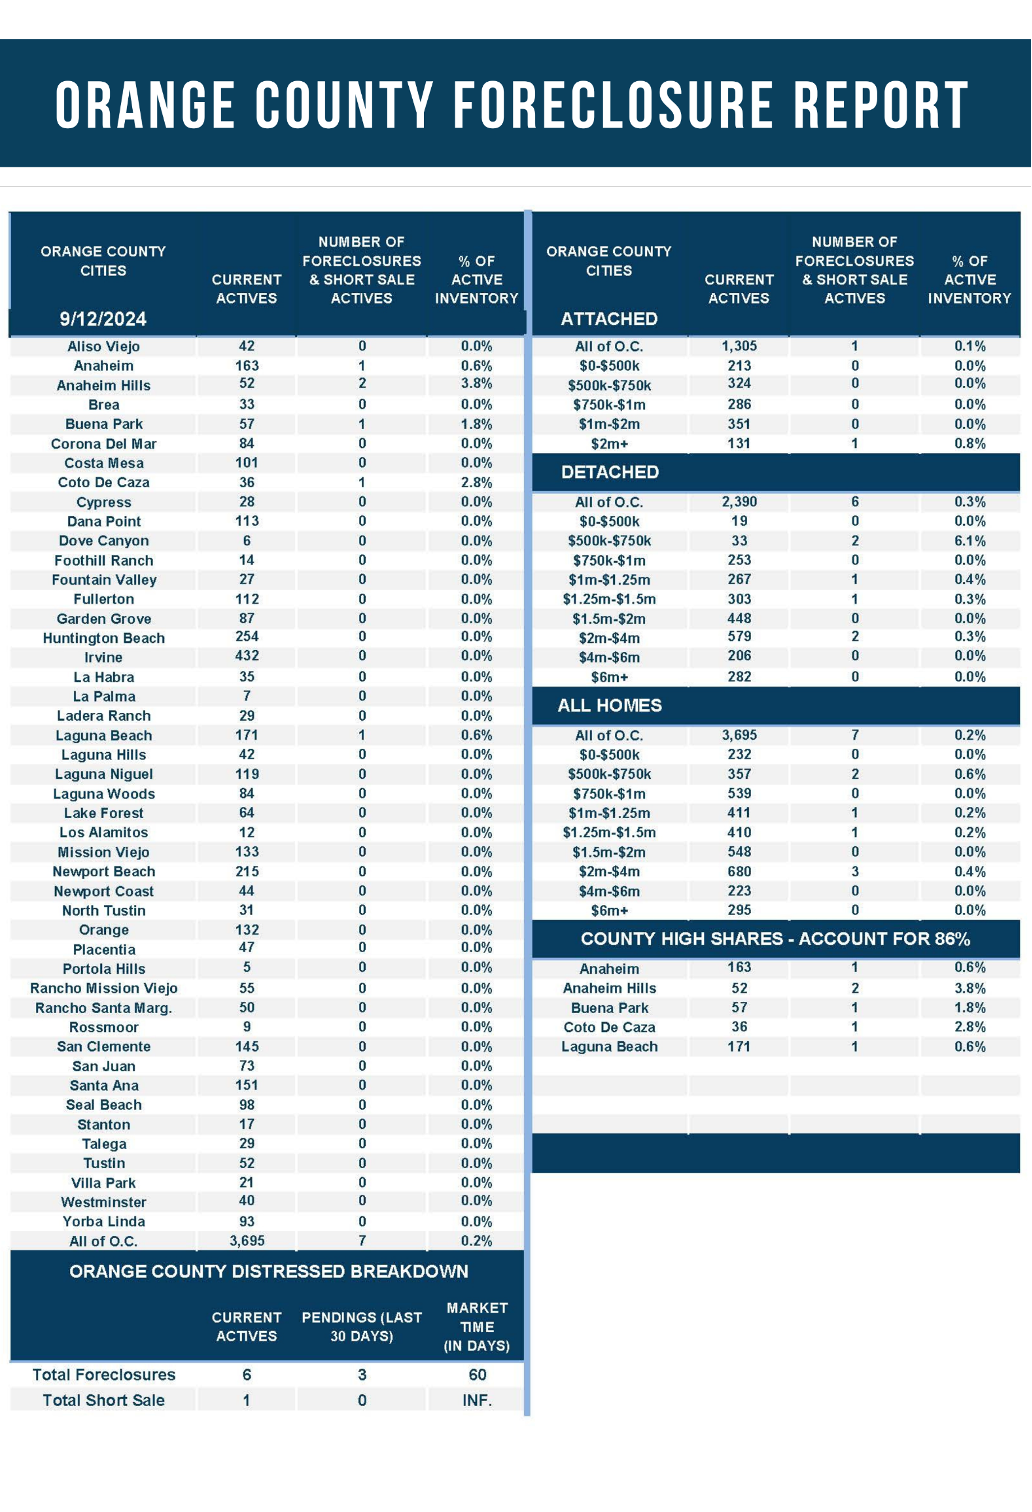
- Distressed homes, both short sales and foreclosures combined, comprised only 0.2% of all listings and 0.2% of demand. Only six foreclosures and one short sale are available today in Orange County, with seven total distressed homes on the active market, down two from two weeks ago. Last year, four distressed homes were on the market, similar to today.
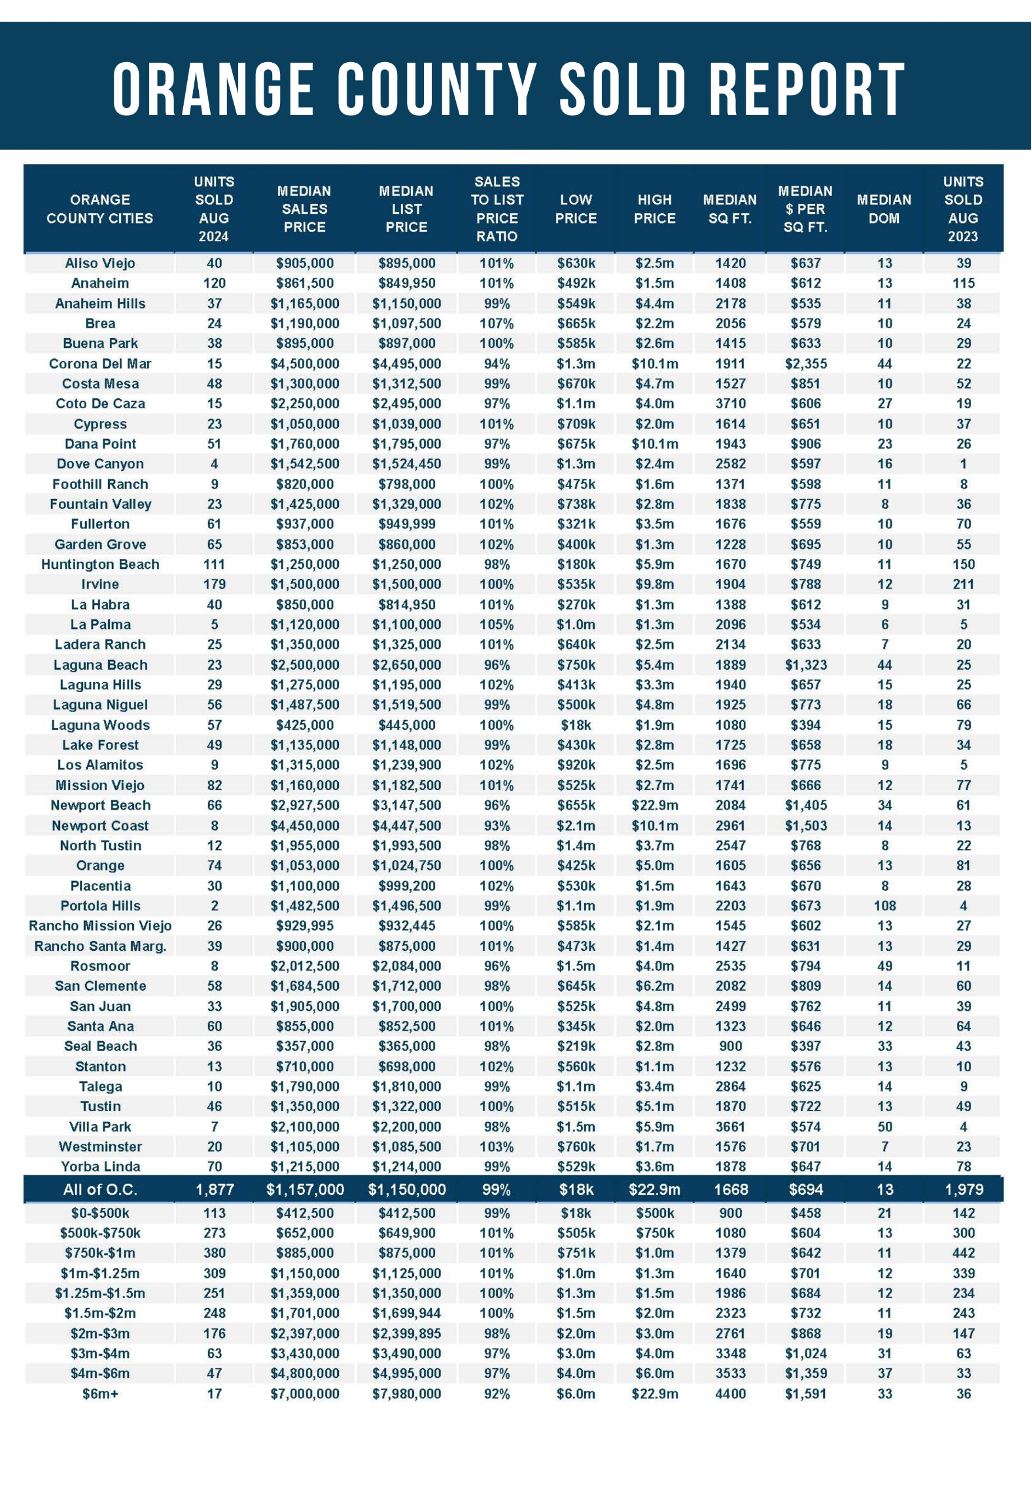
- There were 1,877 closed residential resales in August, down 5% compared to July 2023’s 1,979 and down 8% from July 2024. The sales-to-list price ratio was 99.0% for Orange County. Foreclosures accounted for 0.1% of all closed sales, and there were no short sales. That means that 99.9% of all sales were good ol’ fashioned sellers with equity.
Have a great week.
Sincerely,
Steven Thomas
Quantitative Economics and Decision Sciences
Copyright 2024—Steven Thomas, Reports On Housing—All Rights Reserved. This report may not be reproduced in whole or in part without express written permission from the author.