September 3, 2024
Housing is slowing in 2024 because more homeowners have decided to sell, and they have been accumulating on the market.
Rising Market Times
The Expected Market Time is at its highest level for a start to September since 2019.
Sometimes, driving around to run some local errands turns into an all-day affair. Not checking the go-to navigation app beforehand and hopping on the freeway ready to zoom a few miles to the mall, nursery, or hardware store turns into a disaster. Everyone must have had the same idea because the freeway is practically stopped. The unexpected stop-and-go traffic turns the short trip into a time eating nightmare. Frustratingly, it takes a lot longer to get through the list of errands.
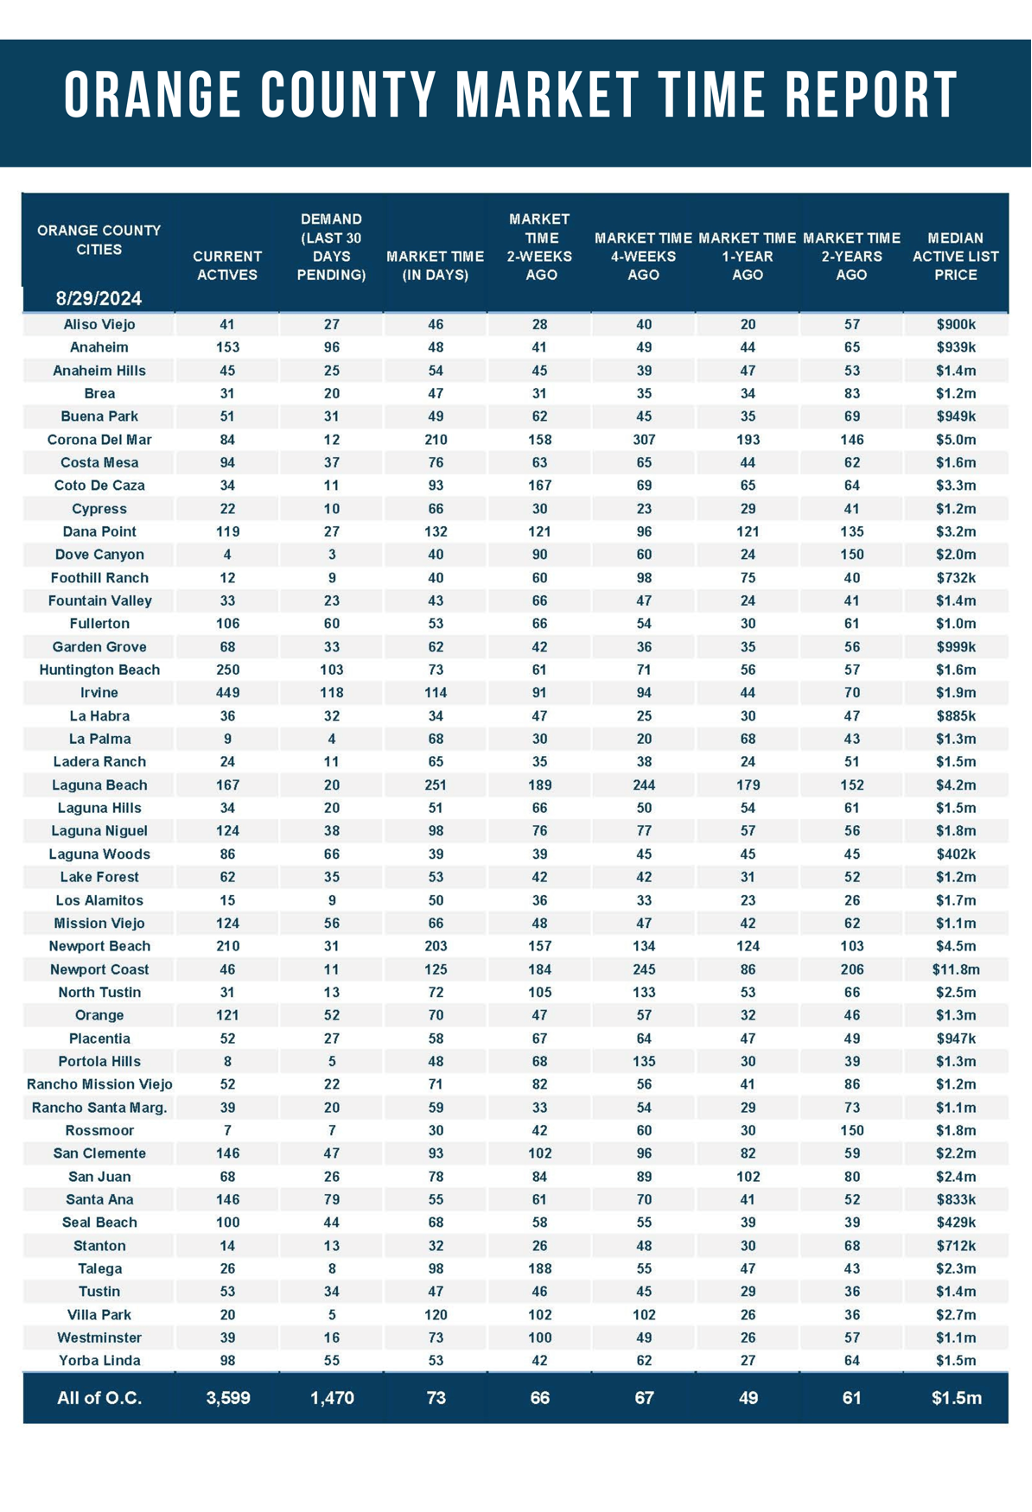
Similarly, homeowners placing their homes on the market today with the expectations of multiple offers and short market times is simply not today’s reality. Instead, there is a lot more seller competition. It used to take days to secure an offer, but, for many, it is now taking weeks or months. The Expected Market Time (the number of days it takes to sell all Orange County listings at the current buying pace) has increased from 37 days in March to 73 days today, the difference between zooming to your destination and stop-and-go traffic.
Many wonder why has the market slowed so much this year. It is not that demand has suddenly fallen sharply like it did in 2022 when rates climbed from 3.25% in January to 7.37% in October. Instead, it boils down to a supply and demand issue. More sellers are vying for a limited number of buyers.
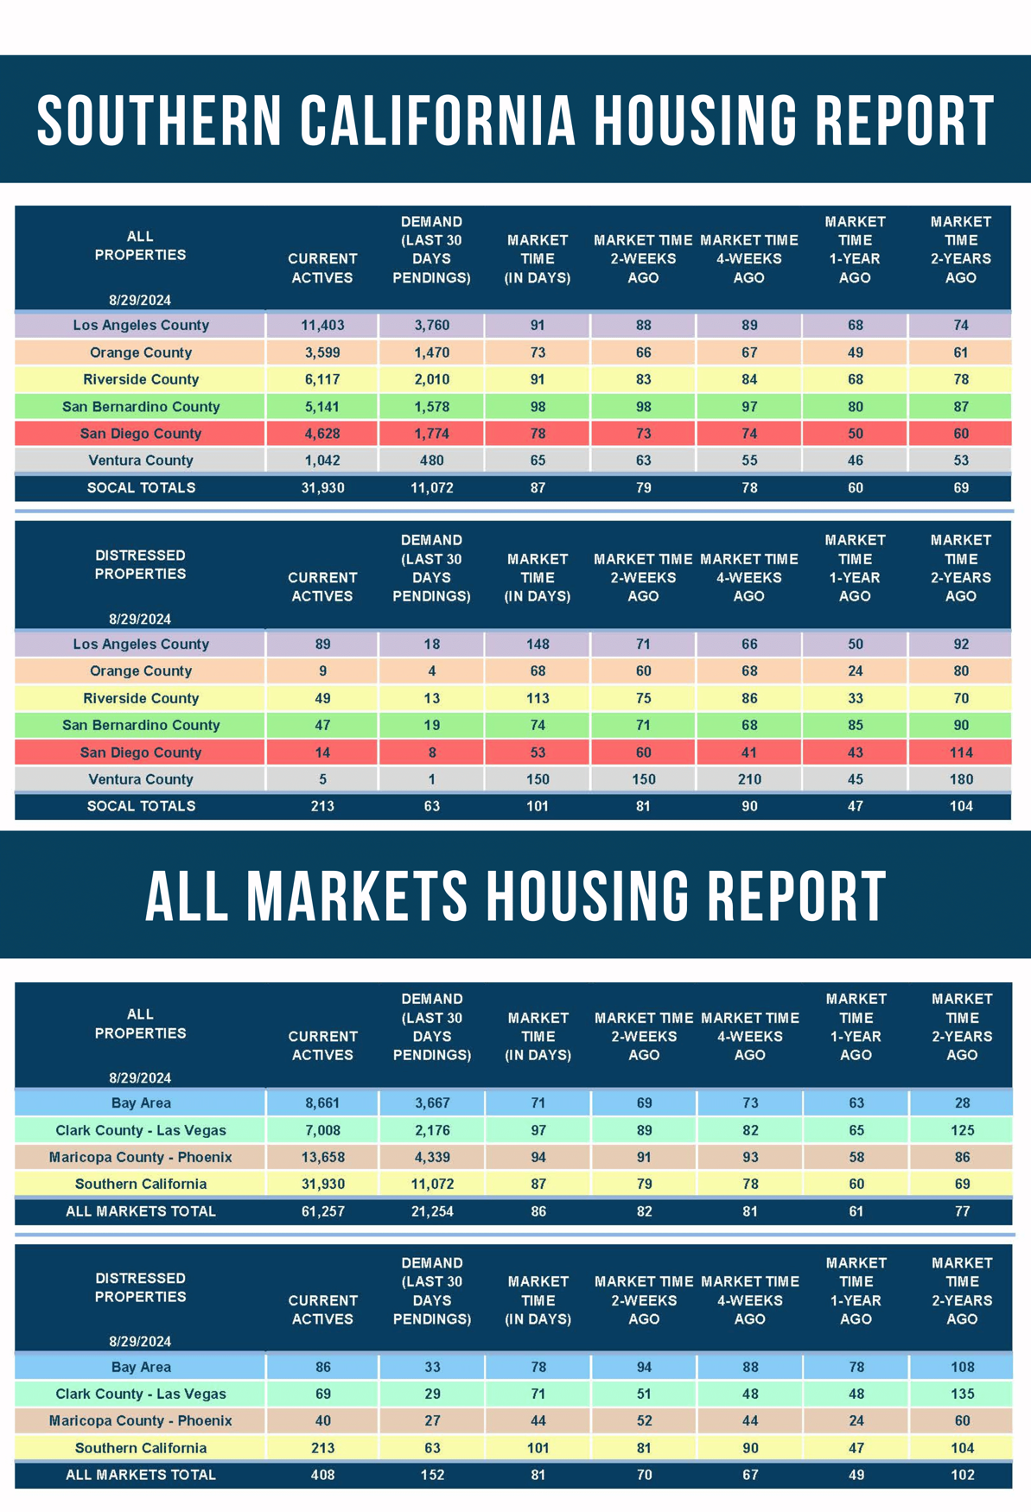
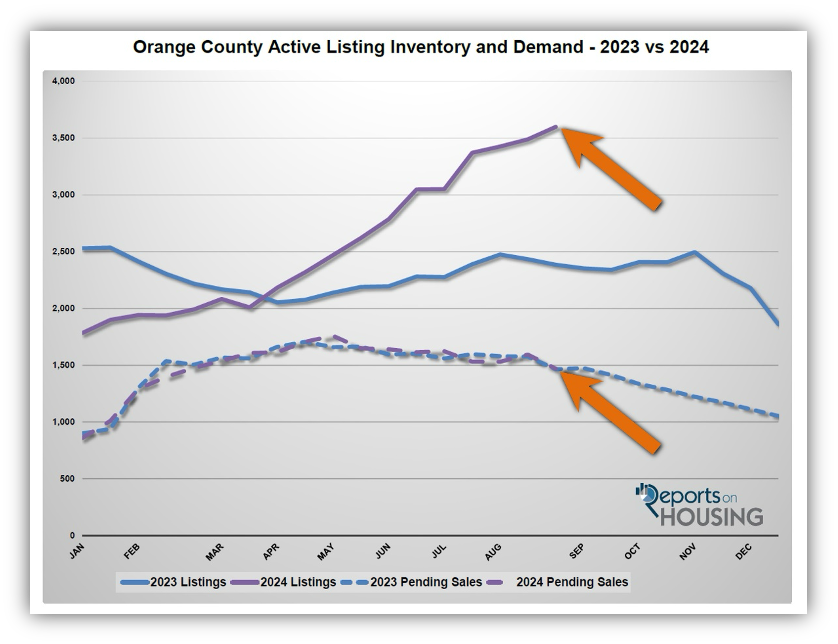
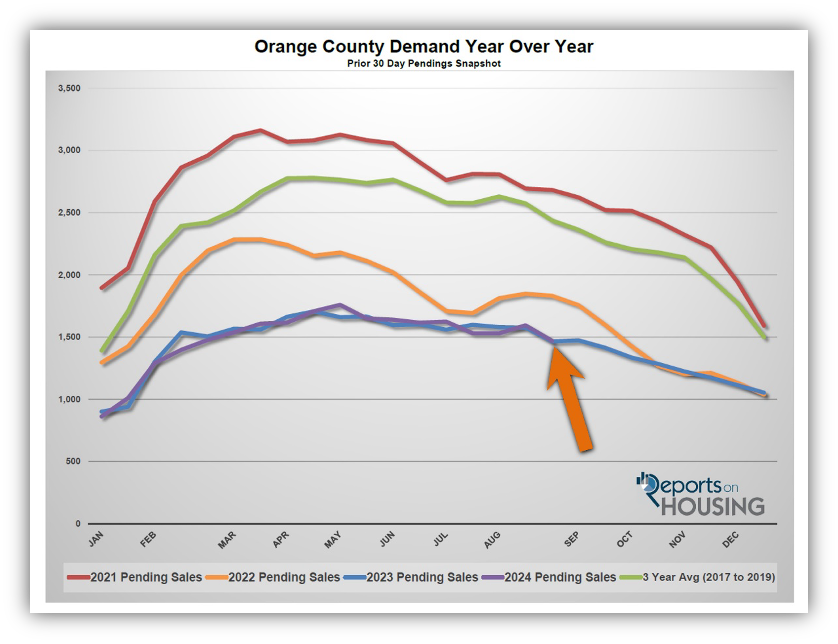
Demand in 2024 (a snapshot of the number of new pending sales over the prior month) has charted a course very similar to demand in 2023. In February, there were 140 fewer pending sales year-over-year, and in May there were 99 more pending sales, the largest differences through August. Currently, demand is at 1,470, five more than last year’s end of August. This illustrates that this year’s monthly buyer pool closely resembles the buyer pool in 2023.
It is important to point out that demand has been bouncing along a bottom ever since rates climbed above 6%. They have remained above 6% since August 2022, two years ago. As a result, demand has been limited due to affordability constraints and is far below pre-COVID levels. The 3-year (2017 to 2019) pre-pandemic end of August average demand reading was 2,438, an additional 968 pending sales or 66% higher than today. Demand will eventually rise as rates make their way below 6% in the not-so-distant future. For now, demand will continue to trudge along a bottom that was established last year.
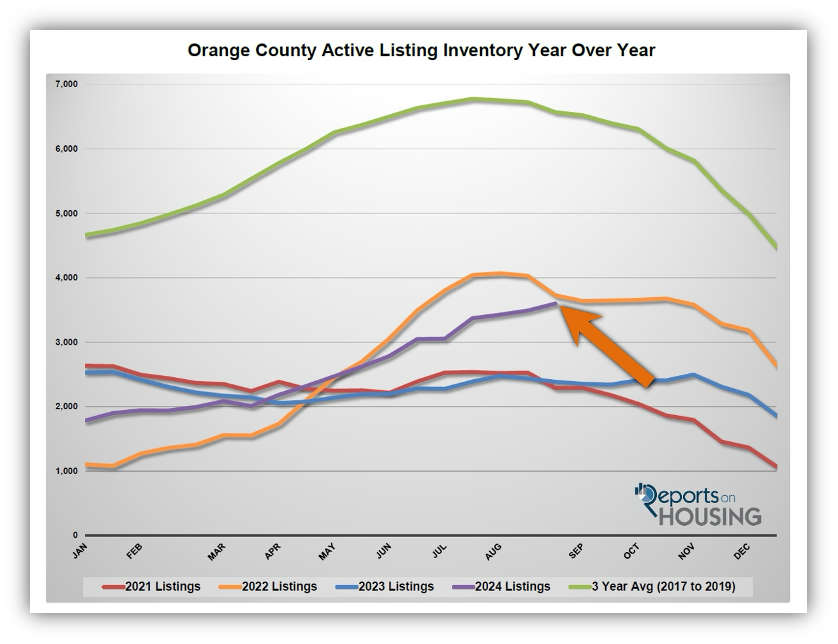
The market has decelerated this year because the inventory has climbed substantially. In January 2024 there were 1,785 homes on the market, 29% less than January 2023, or 745 fewer homes. Since demand readings have been very similar to last year, in matching that lower supply to similar demand, the Expected Market Time was stronger than last year to start the year. That advantage faded as the inventory continued to grow, eclipsing last year’s level in April. Undeterred, the inventory has risen and has yet to reach its annual peak. Currently, there are 3,599 homes on the market, up 1,814 homes since January, or 102%, a little more than double. Last year there were 2,385 homes on the market to end August, 1,214 fewer homes or 34% less. The difference is noticeable in every price range. There are a lot more sellers competing for limited demand.
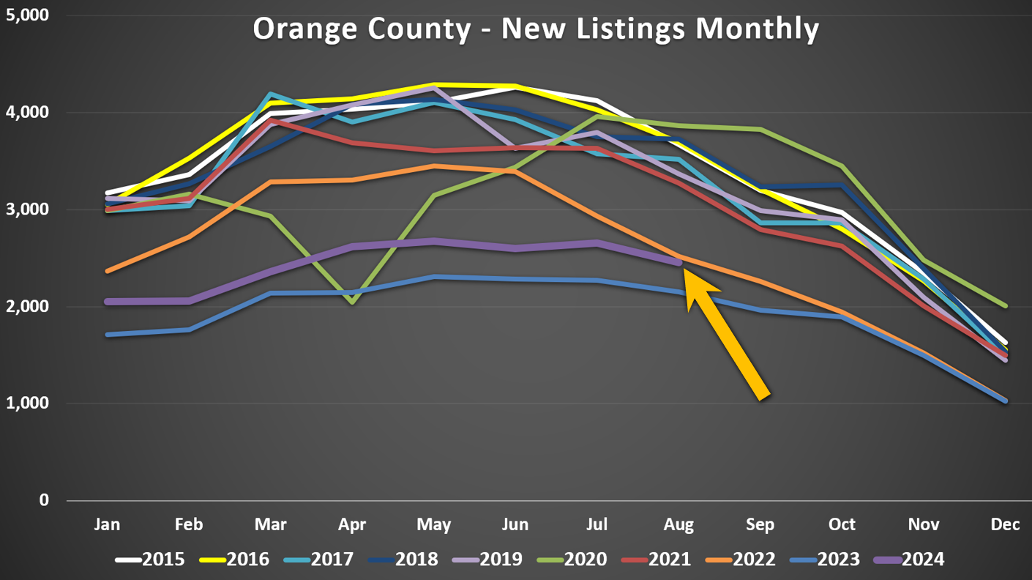
Last year’s inventory remained relatively flat. After initially falling through mid-April, the active listing inventory peaked at 2,496 homes, 1% below its January start with 34 fewer homes. The only difference between this year and last year is that more homeowners have decided to sell. Through August, 19,464 homeowners have placed their homes on the market, that is 9,920 fewer than the 3-year average before COVID of 29,384, indicative of homeowners continuing to “hunker down” in their homes, unwilling to move due to their current underlying, locked-in, low fixed-rate mortgage. Yet, there are 2,694 additional sellers this year compared to last year’s even more muted 16,770 sellers through August. That is 16% additional FOR-SALE signs.
Those additional signs have accumulated on the market and have allowed the inventory to rise this year. The extra inventory has been matched against limited, affordability constrained demand and has resulted in a slowing housing market. The slowdown in the Orange County housing market will endure until the inventory reaches its peak and starts to fall. As mortgage rates continue to fall and remain low with duration, it will unlock more demand, the market will improve, and the Expected Market Time will fall.
Active Listings
The active inventory increased by 3% in the past couple of weeks.
The active listing inventory increased by 109 homes in the past two weeks, up 3%, and now sits at 3,599, its highest level since October 2022. This recent bump could be due to major changes within the real estate industry that were officially implemented on Saturday, August 17th. It may take a month for the industry to iron out the wrinkles. The changes have been compared to the start of the TILA-RESPA Integrated Disclosure (TRID) that affected the lending industry in 2015. Its implementation impacted sales for about a month.
Typically, Orange County reaches its inventory peak between July and August. It appears as if it will be delayed this year and will reach its height in the coming weeks, sometime in September. Fewer homes will be coming on the market for the remaining four months of the year. Now that the kids are back in school, housing has transitioned to the Autumn Market. It is no longer the most advantageous time of the year to sell a home. Demand is strongest in the spring, and second strongest in the summer. Even though the autumn equinox, the official first day of fall, is not until September 22nd, for housing, it is already here. As soon as the inventory reaches its peak, the inventory will slowly fall until mid-November, the start of the Holiday Market. It will then plunge until ringing in a New Year.
Last year, the inventory was 2,385 homes, 34% lower, or 1,214 fewer. The 3-year average before COVID (2017 through 2019) was 6,723, an additional 2,970 homes, or 83% more. This difference illustrates that the inventory crisis is still impacting Orange County housing.
Homeowners continue to “hunker down” in their homes, unwilling to move due to their current underlying, locked-in, low fixed-rate mortgage. It became a crisis once rates skyrocketed higher in 2022. For August, 2,454 new sellers entered the market in Orange County, 1,083 fewer than the 3-year average before COVID (2017 to 2019), 31% less. Last August, there were 2,154 new sellers, 12% fewer than this year. More sellers are opting to sell compared to the previous year.
Demand
Demand plunged by 8% in the past couple of weeks.
Demand, a snapshot of the number of new pending sales over the prior month, plunged from 1,594 to 1,470 in the past couple of weeks, down 124 pending sales, or 8%, its largest drop of the year and its lowest level since February. This large drop is most likely due to major changes within the real estate industry that were officially implemented on Saturday, August 17th. It may take a month for the industry to iron out the wrinkles.
Mortgage rates are finally cooperating for buyers and improving affordability tremendously after eclipsing 7.5% three times in April. Today, according to Mortgage News Daily, rates are at 6.4%. Last year at this time, they were at 7.21% and climbing. They even surpassed 8% last October. This year there is building pressure for rates to fall even further. These improvements will encourage more buyers to enter the market, which will impact demand shortly. The more rates drop, the larger the impact. Demand will eventually break away from the current low levels that were established in 2023. Increased affordability will allow more people to qualify to purchase and boost the buyer pool.
As the Federal Reserve has indicated, watching all economic releases for signs of slowing is essential. These releases can potentially move mortgage rates higher or lower, depending on how they stack up compared to market expectations. This week is jobs week, which includes the number of job openings, wages, the number of jobs created or lost, and unemployment. Next week is an important inflation reading, the Consumer Price Index (CPI). These releases have a high potential to move mortgage rates.
Last year, demand was 1,465, nearly identical to today with five fewer pending sales. The 3-year average before COVID (2017 to 2019) was 2,438 pending sales, 66% more than today, or an additional 968.
With supply rising and demand plunging, the Expected Market Time (the number of days it takes to sell all Orange County listings at the current buying pace) increased from 66 to 73 days in the past couple of weeks. Last year, it was 49 days, faster than today. The 3-year average before COVID was 82 days, a bit slower than today.
Luxury End
The luxury market cooled slightly in the past couple of weeks.
In the past couple of weeks, the luxury inventory of homes priced above $2 million (the top 10% of the Orange County housing market) decreased from 1,234 to 1,225 homes, down 9 or 1%. Luxury demand decreased by 10 pending sales, down 4%, and now sits at 236. With demand falling faster than supply, the Expected Market Time for luxury homes priced above $2 million increased from 150 to 156 days, identical to four weeks ago. Luxury feels a lot more sluggish than the lower price ranges, especially homes priced above $4 million. Stock market volatility is a headwind that has the potential to disrupt the luxury market further if the volatility persists.
Year over year, the active luxury inventory is up by 433 homes or 55%, and luxury demand is up by 66 pending sales or 39%. Last year’s Expected Market Time was 140 days, slightly faster than today.
In the past two weeks, the expected market time for homes priced between $2 million and $4 million increased from 108 to 110 days. For homes priced between $4 million and $6 million, the Expected Market Time increased from 194 to 351 days. For homes priced above $6 million, the Expected Market Time decreased from 527 to 329 days. At 329 days, a seller would be looking at placing their home into escrow around July 2025.
Orange County Housing Summary
- The active listing inventory in the past couple of weeks increased by 109 homes, up 3%, and now sits at 3,599, its highest level since October 2022. In August, 31% fewer homes came on the market compared to the 3-year average before COVID (2017 to 2019), 1,083 less. Yet, 300 more sellers came on the market this August compared to August 2023. Last year, there were 2,385 homes on the market, 1,214 fewer homes, or 34% less. The 3-year average before COVID (2017 to 2019) was 6,569, or 83% extra.
- Demand, the number of pending sales over the prior month, plunged by 124 pending sales in the past two weeks, down 8%, and now totals 1,470, its largest drop of the year. Last year, there were 1,465 pending sales, nearly unchanged. The 3-year average before COVID (2017 to 2019) was 2,438, or 66% more.
- With supply rising and demand falling, the Expected Market Time, the number of days to sell all Orange County listings at the current buying pace, increased from 66 to 73 days in the past couple of weeks. It was 49 days last year, faster than today. The 3-year average before COVID (2017 to 2019) was 82 days, a bit slower than today.
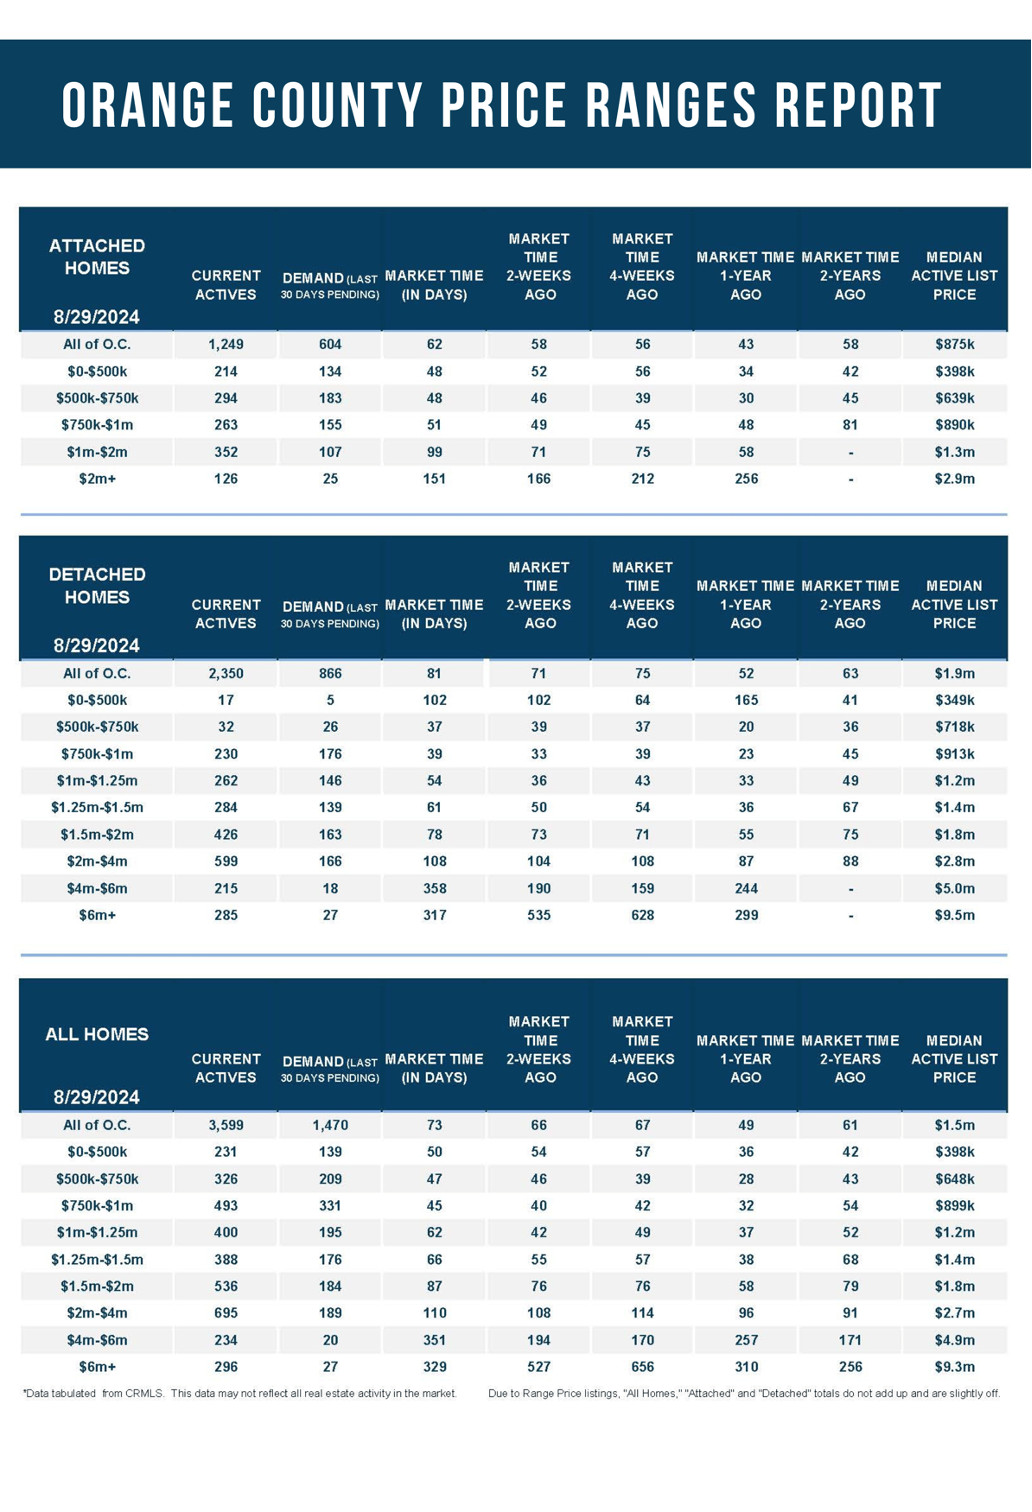
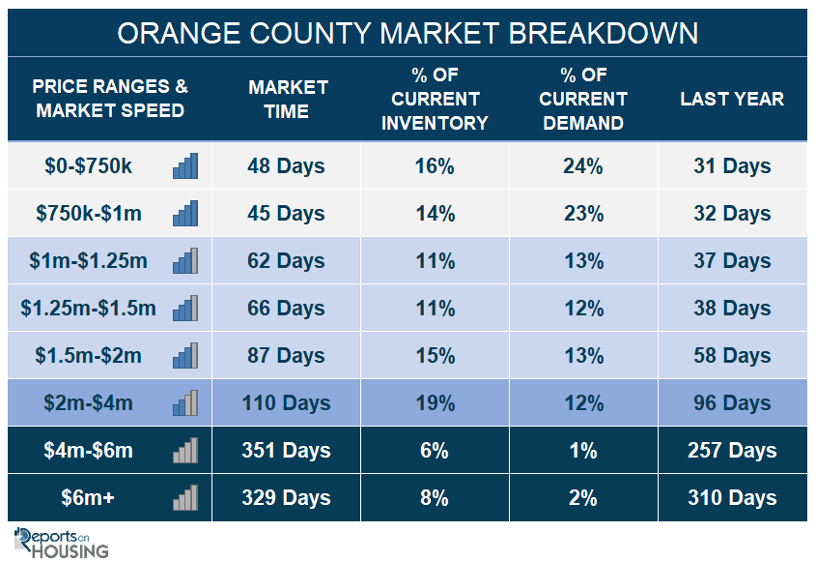
- In the past two weeks, the Expected Market Time for homes priced below $750,000 decreased from 49 to 48 days. This range represents 16% of the active inventory and 24% of demand.
- The Expected Market Time for homes priced between $750,000 and $1 million increased from 40 to 45 days. This range represents 14% of the active inventory and 23% of demand.
- The Expected Market Time for homes priced between $1 million and $1.25 million increased from 42 to 62 days. This range represents 11% of the active inventory and 13% of demand.
- The Expected Market Time for homes priced between $1.25 million and $1.5 million increased from 55 to 66 days. This range represents 11% of the active inventory and 12% of demand.
- The Expected Market Time for homes priced between $1.5 million and $2 million increased from 76 to 87 days. This range represents 15% of the active inventory and 13% of demand.
- In the past two weeks, the expected market time for homes priced between $2 million and $4 million increased from 108 to 110 days. For homes priced between $4 million and $6 million, the Expected Market Time increased from 194 to 351 days. For homes priced above $6 million, the Expected Market Time decreased from 527 to 329 days.
- The luxury end, all homes above $2 million, account for 33% of the inventory and 15% of demand.
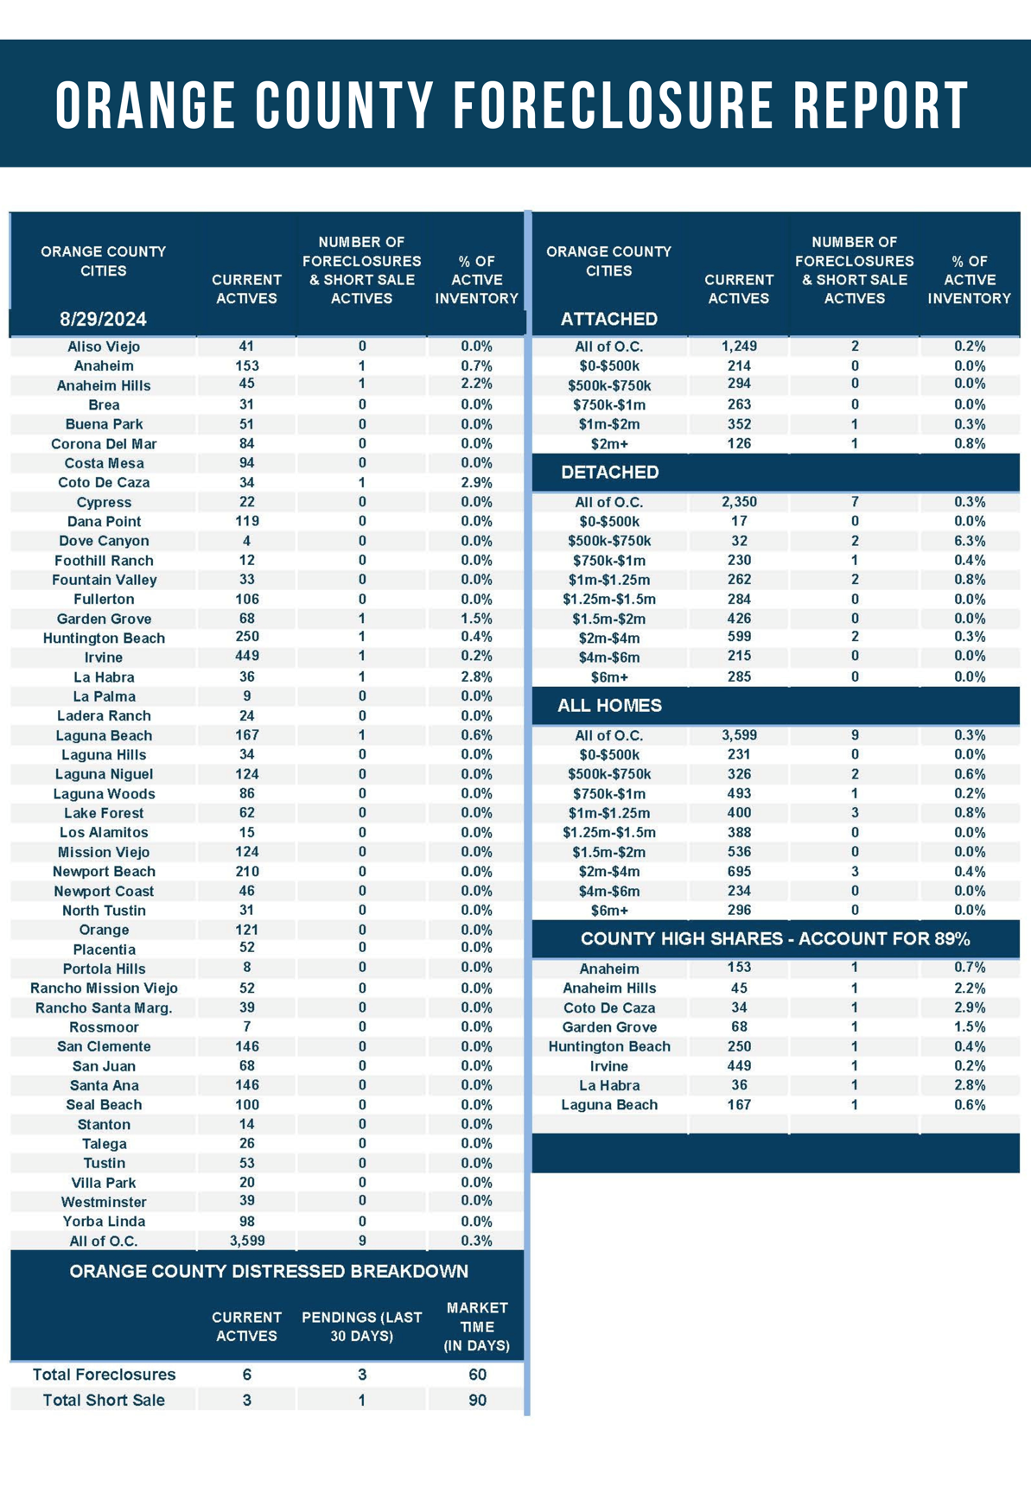
- Distressed homes, both short sales and foreclosures combined, comprised only 0.3% of all listings and 0.3% of demand. Only six foreclosures and three short sales are available today in Orange County, with nine total distressed homes on the active market, up one from two weeks ago. Last year, four distressed homes were on the market, similar to today.
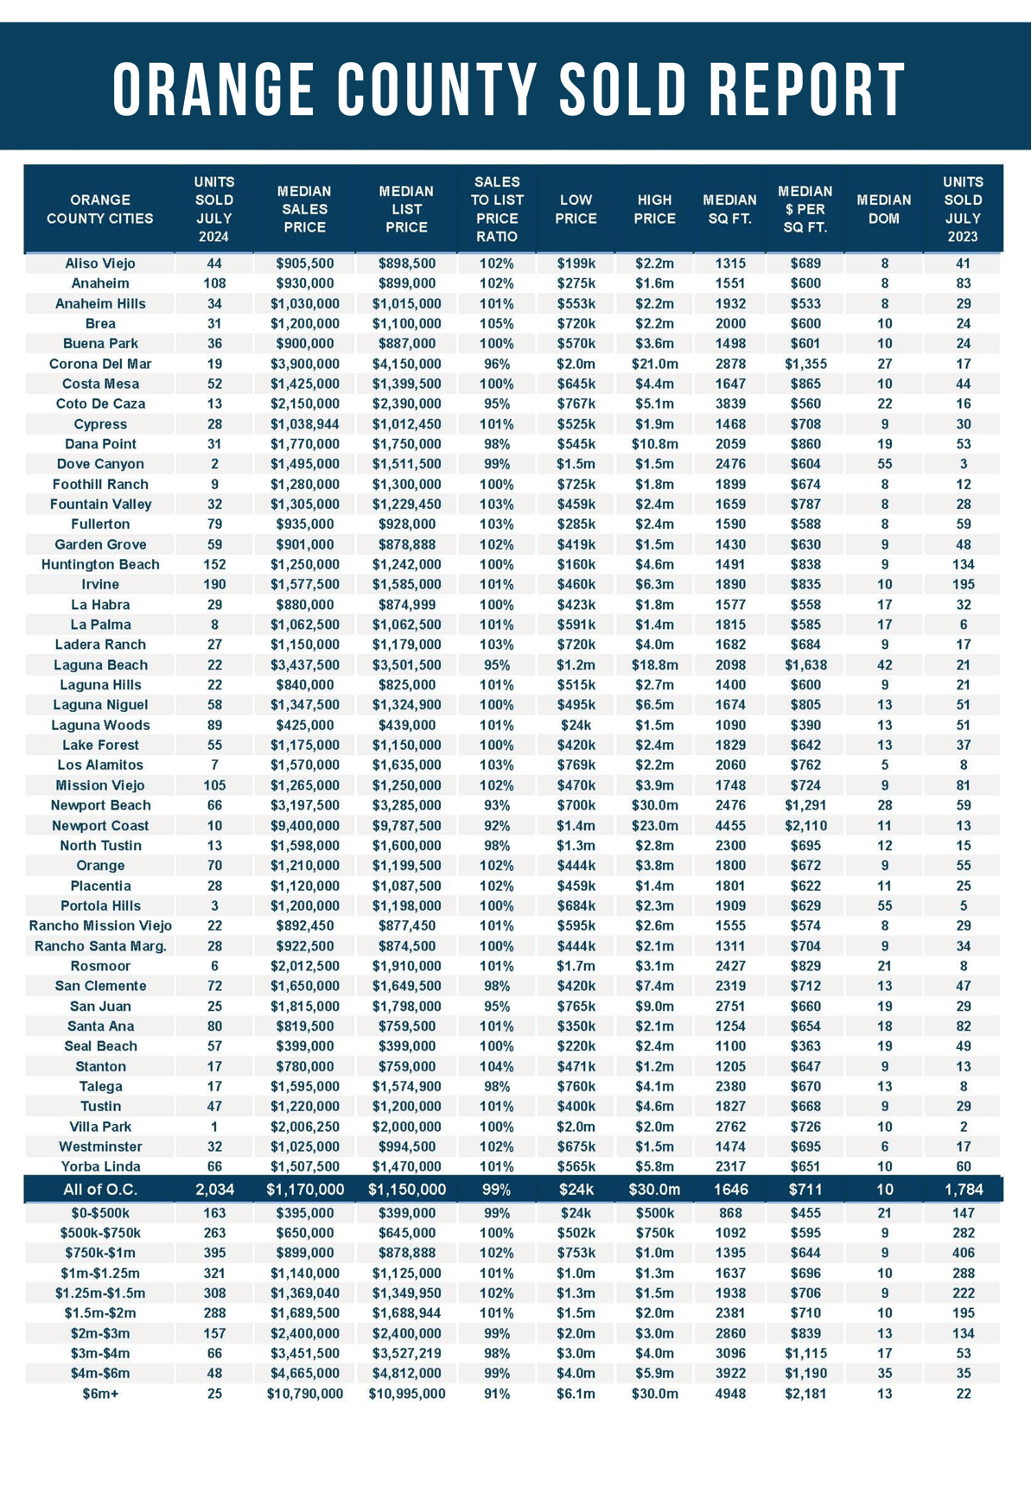
- There were 2,034 closed residential resales in July, up 14% compared to July 2023’s 1,784 and up 12% from June 2024. The sales-to-list price ratio was 99.2% for Orange County. Short sales accounted for 0.1% of all closed sales, and there were no foreclosure sales. That means that 99.9% of all sales were good ol’ fashioned sellers with equity.
Have a great week.
Sincerely,
Steven Thomas
Quantitative Economics and Decision Sciences
Copyright 2024—Steven Thomas, Reports On Housing—All Rights Reserved. This report may not be reproduced in whole or in part without express written permission from the author.