July 8, 2024
Housing is in the middle of the Summer Market when seasonally, the inventory rises, demand slowly declines, and market times grow longer from week to week.
The Summer Housing Market
Demand peaked at the beginning of May, and the inventory has yet to peak, so the market continues to slow.
Summer is here with all of its many distractions. It is time to pack the suitcases and take a much-needed family vacation. An easy answer to the blistering heat is to head to the pool, lake, or beach and splash around until the sun goes down. Parents are busy Ubering their kids to summer school, camps, and movies. Many additional extracurricular activities are on the calendar, from museums to amusement parks to day hikes. Summertime is chock full of interruptions to everyday daily life. It is no wonder that the housing market is evolving and downshifting a bit from the heated pace of spring.
Cyclically, in nearly every market across the country, including Orange County, spring is the hottest time of the year for housing. Buyers transact year-round, but their preference, especially families, is to pull the trigger on isolating a home during the spring that ultimately closes in the summer. That is when the kids are out of school, the perfect time for a household move. Even if it requires a school change, the best time is when they are transitioning between grade levels. Throw into the mix the list of summer activities, including travel, and the goal of purchasing a home often takes a back seat to all the fun. As a result, demand drops from its Spring Market peak.
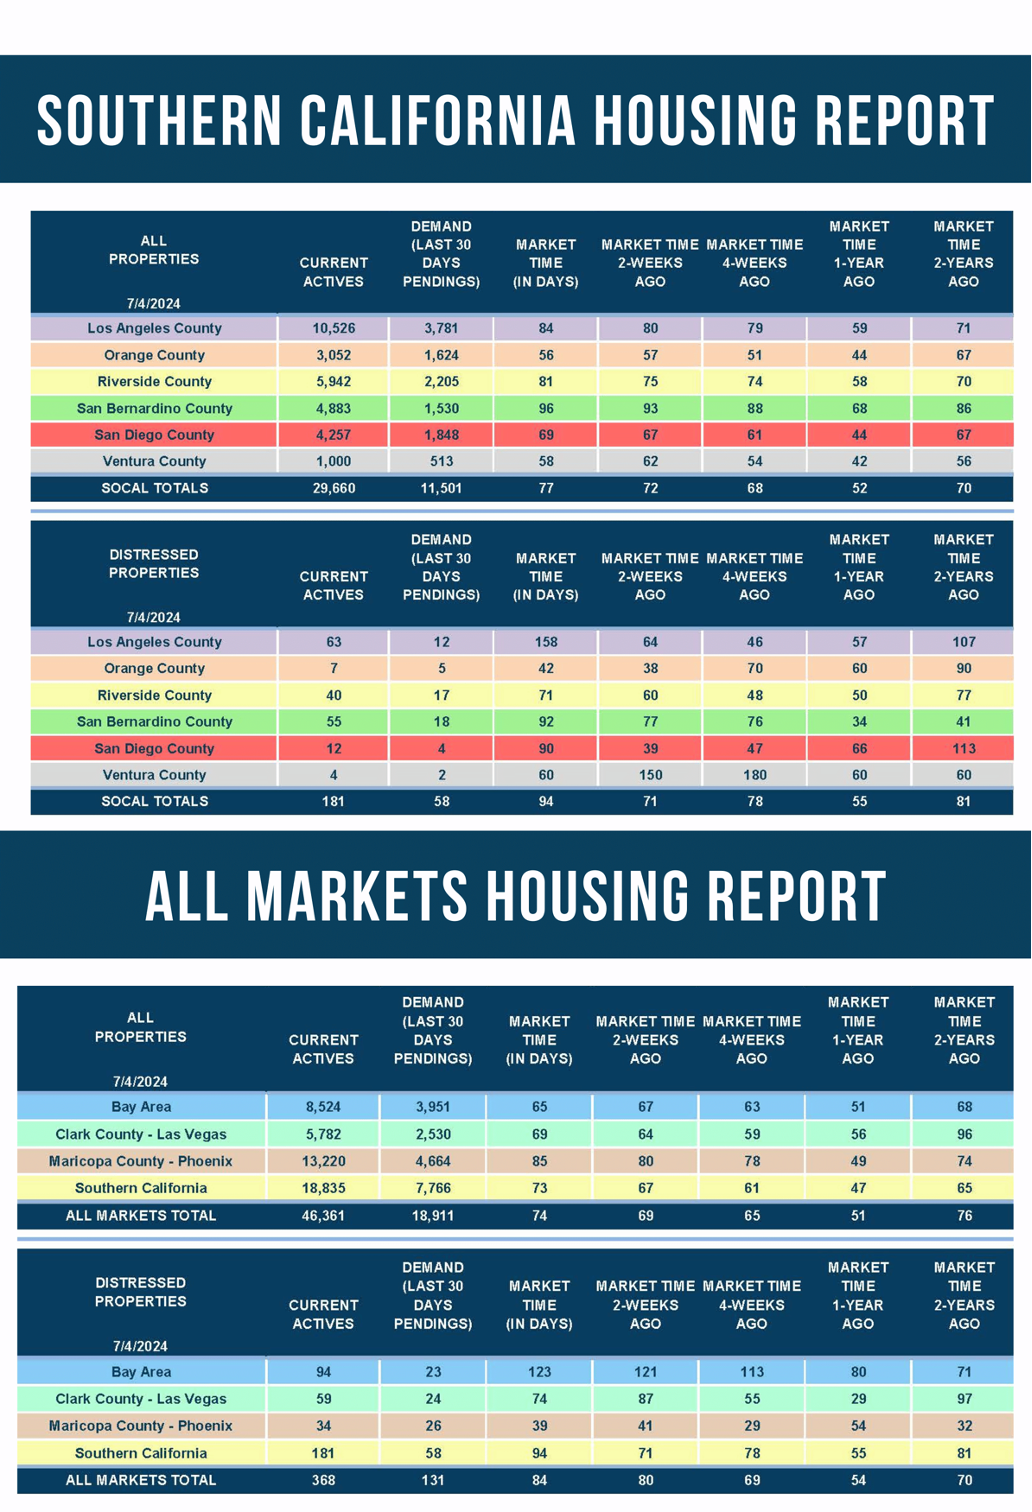
In Orange County, demand, a snapshot of the number of new pending sales over the prior month, peaked at the start of May at 1,759 homes. Since then, it has dropped by 8% or 135 pending sales and sits at 1,624 today. It was at 1,560 last year, 4% less or 64 fewer pending sales. Compared to normal markets before COVID, the 3-year average between 2017 and 2019 was 2,582, 59% higher or 958 additional pending sales.
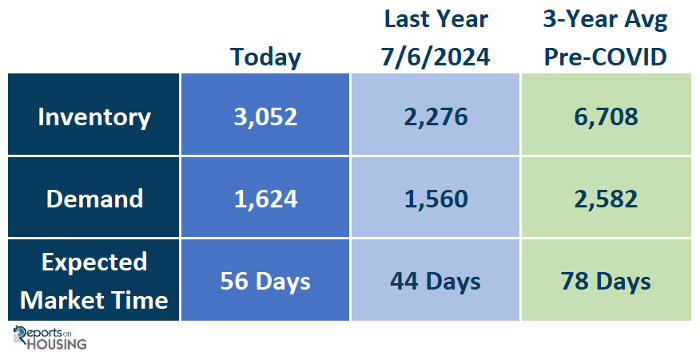
Many homeowners mistake summer as the best time of the year to sell a home and decide to place their homes on the market from June through August. Yet, since demand typically peaks during the spring, and there is still an elevated number of homes that come on the market during the summer, the extra homes accumulate until a peak is reached between mid-July and the end of August. Back in May, when demand peaked, there were 2,470 homes on the market. Since then, the inventory has grown by 23%, adding 582 homes, and sits at 3,052 today. The inventory has yet to find a peak. Last year, with rising mortgage rates that reached 8% in October, a late peak was reached in November at 2,496 homes, a phenomenon that only occurs when rates jump during the second half of a year. Last year, there were 2,276 homes on the market, 776 fewer FOR-SALE signs, or 25% less. Yet, even with this year’s higher inventory levels, it is still far lower than the 3-year pre-COVID average of 6,708, an astonishing 55% lower or 3,656 fewer signs.
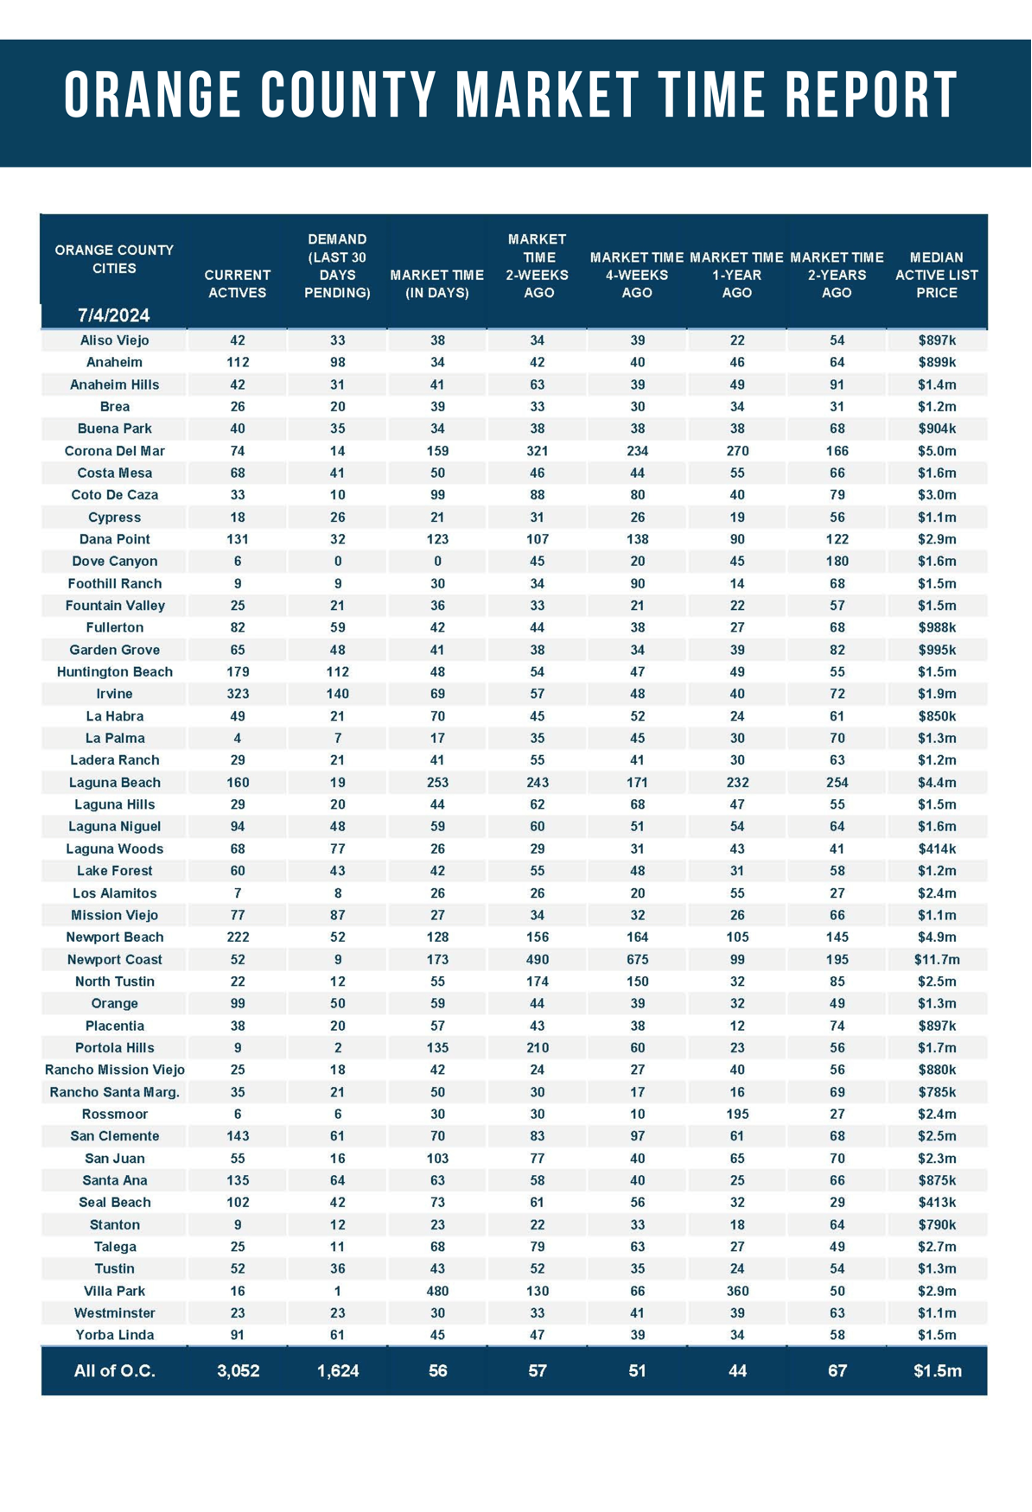
Since demand found its peak during the spring and the inventory has yet to reach its peak, the market has slowed considerably in the past couple of months. In fact, since May, the Expected Market Time, the time between coming on the market and becoming a pending sale, has grown from 42 days to 56 days today. While housing may be faster compared to the 3-year pre-COVID average of 78 days, at 56 days, most homes are not snapped up instantly. Sellers expecting a hot summer housing market like this year and last year’s early Spring Markets may be unaware that the market has slowed considerably. Overzealous sellers who stretch their asking price without carefully considering the current market dynamics and the need to meticulously pour over all recent pending and closed sales activity to arrive at a home’s true Fair Market Value will not find success until they adjust their expectations. That is precisely why 29% of the active inventory has reduced the asking price at least once. The number of price reductions has also been growing from week to week.
The housing market has been downshifting. There are more open houses. As long as they are priced properly, only homes that are in tip-top shape with all the bells and whistles and are genuinely turnkey, ready to be moved into with very little work, fly off the market. For everyone else, the Summer Market feels a bit more subdued.
Active Listings
The active inventory remained unchanged in the past couple of weeks.
The active listing inventory increased by only four homes in the past two weeks, nearly unchanged, and now sits at 3,052, its highest level since December 2022. Could this be the inventory peak for Orange County? Only time will tell. A peak is typically reached between mid-July and the end of August when the kids go back to school. The inventory has grown at a faster pace this year compared to 2023 because more homeowners are opting to come on the market. With demand readings very close to last year, the extra homeowners are accumulating and building a much-needed inventory of available homes in a market starved for more choices. While from January through July, there were 36% fewer homes placed on the market compared to the 3-year pre-COVID average (2017 to 2019), or 7,888 missing FOR-SALE signs, there are 1,906 more signs this year compared to 2023. Many homeowners choose to “hunker down” in their homes, unwilling to move due to their underlying, locked-in, low fixed-rate mortgage.
Last year, the inventory was 2,276 homes, 25% lower, or 776 fewer. The 3-year average before COVID (2017 through 2019) was 6,708, an additional 3,656 homes, or 120% more, more than double the current level.
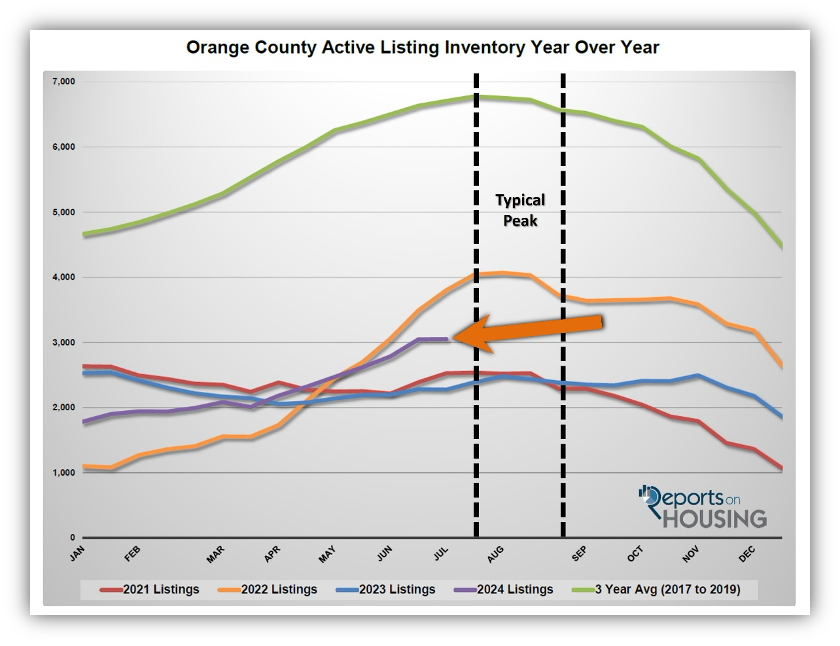
Homeowners continue to “hunker down” in their homes, a phenomenon that became a crisis once rates skyrocketed higher in 2022. For June, 2,538 new sellers entered the market in Orange County, 1,323 fewer than the 3-year average before COVID (2017 to 2019), 34% less. Last June, there were 2,284 new sellers, 10% fewer than this year. More sellers are opting to sell compared to the previous year.
Demand
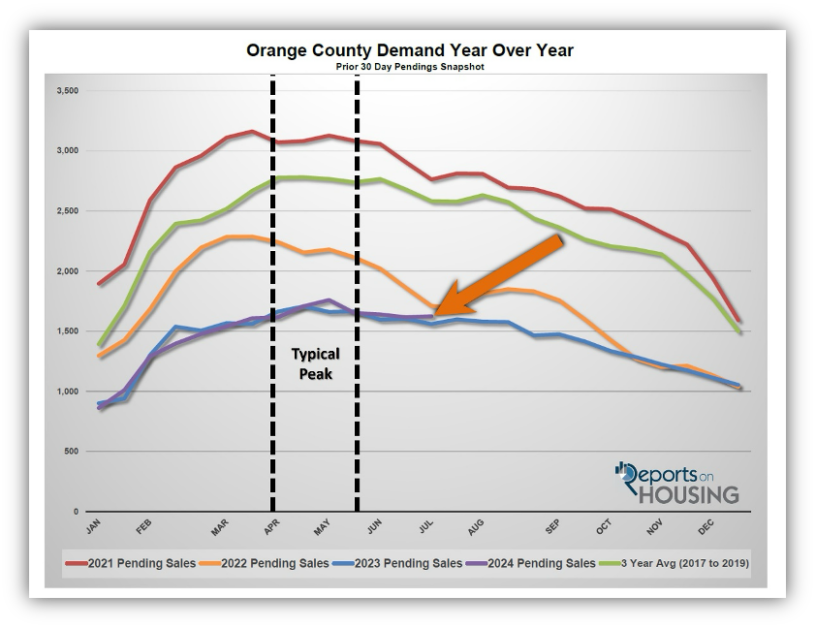
Demand rose by nine pending sales in the past couple of weeks.
Demand, a snapshot of the number of new pending sales over the prior month, increased from 1,615 to 1,624 in the past couple of weeks, up nine pending sales, or 1%. In Orange County, demand has closely resembled last year’s levels and will continue to as long as mortgage rates remain persistently above 7%. Since the Federal Reserve declared war against inflation in 2022, rates have remained elevated. They have committed to keeping rates at these higher levels until inflation adequately retreats and all threats of further escalation diminish. Inflation readings are cooperating and continuing their path down after a bit of a hiccup earlier this year, and many economic readings are showing the beginning of an economic slowdown in the U.S. Both of these factors will lead to an eventual cut in interest rates. Demand readings will rise with a more favorable mortgage rate environment when this occurs.
As the Federal Reserve has indicated, it is essential to watch all economic releases for signs of slowing. These releases have the potential to move mortgage rates higher or lower, and it all depends upon how they stack up compared to market expectations. Last week’s job market numbers came in at expectations for hiring, while the unemployment rate climbed to 4.1%, its highest reading since November 2021. The Consumer Price Index (CPI), a closely watched inflation gauge, will be released on Thursday, a crucial day for mortgage rates.
Last year, demand was 1,560, 4% less than today, or 64 fewer pending sales. The 3-year average before COVID (2017 to 2019) was 2,582 pending sales, 59% more than today, or an additional 958.
With supply unchanged and demand rising slightly, the Expected Market Time (the number of days it takes to sell all Orange County listings at the current buying pace) decreased from 57 to 56 days in the past couple of weeks. Last year, it was 44 days, faster than today. The 3-year average before COVID was 78 days, slower than today.
Luxury End
The luxury market improved slightly in the past couple of weeks.
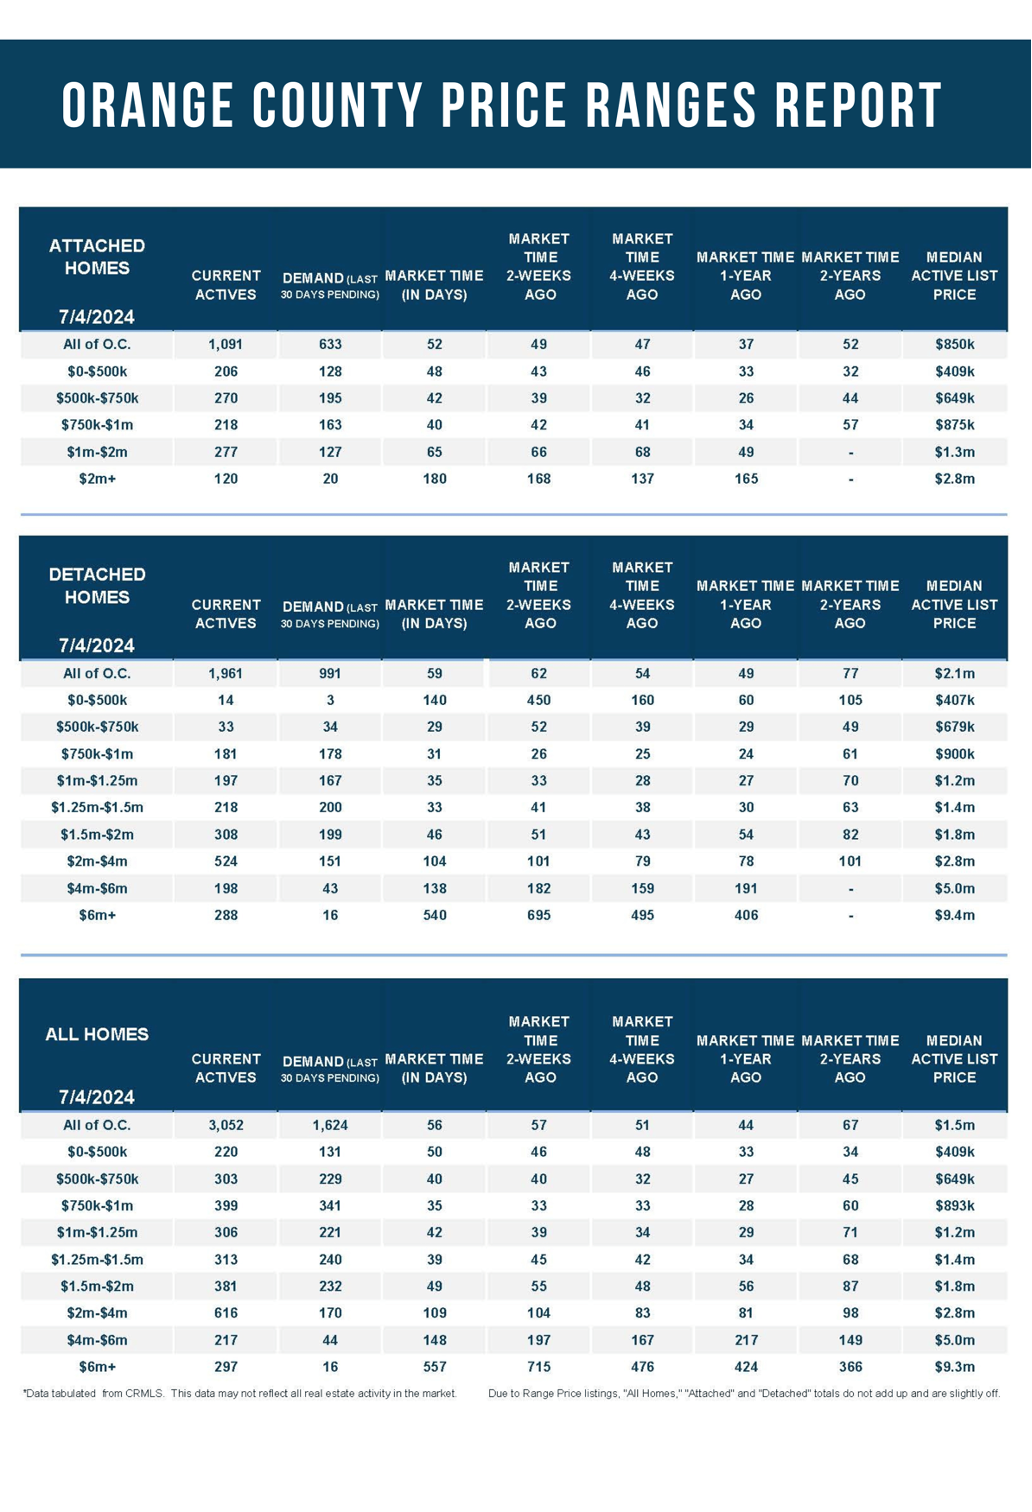
In the past couple of weeks, the luxury inventory of homes priced above $2 million increased from 1,119 to 1,130 homes, up 11 or 1%, the highest level since November 2019. Luxury demand increased by eight pending sales, down 4%, and now sits at 230. With demand rising faster than supply, the Expected Market Time for luxury homes priced above $2 million decreased from 151 to 147 days. Nonetheless, at 147 days, the luxury market is a long way from instant, which requires a careful approach to pricing with the knowledge that it may take much longer to secure success.
Year over year, the active luxury inventory is up by 356 homes or 46%, and luxury demand is up by 43 pending sales or 23%. Last year’s Expected Market Time was 124 days, faster than today.
In the past two weeks, the expected market time for homes priced between $2 million and $4 million increased from 104 to 109 days. For homes priced between $4 million and $6 million, the Expected Market Time decreased from 197 to 148 days. For homes priced above $6 million, the Expected Market Time decreased from 715 to 557 days. At 557 days, a seller would be looking at placing their home into escrow around January 2026.
Orange County Housing Summary
- The active listing inventory in the past couple of weeks increased by only four homes, nearly unchanged, and now sits at 3,052, its highest level since December 2022. In June, 34% fewer homes came on the market compared to the 3-year average before COVID (2017 to 2019), 1,323 less. Yet, 254 more sellers came on the market this May compared to May 2023. Last year, there were 2,276 homes on the market, 776 fewer homes, or 25% less. The 3-year average before COVID (2017 to 2019) was 6,708, or 120% extra, more than double.
- Demand, the number of pending sales over the prior month, increased by nine pending sales in the past two weeks, up 1%, and now totals 1,624. Last year, there were 1,560 pending sales, 4% less. The 3-year average before COVID (2017 to 2019) was 2,582, or 59% more.
- With supply unchanged and demand rising slightly, the Expected Market Time, the number of days to sell all Orange County listings at the current buying pace, decreased from 57 to 56 days in the past couple of weeks. It was 44 days last year, faster than today. The 3-year average before COVID (2017 to 2019) was 78 days, slower than today.
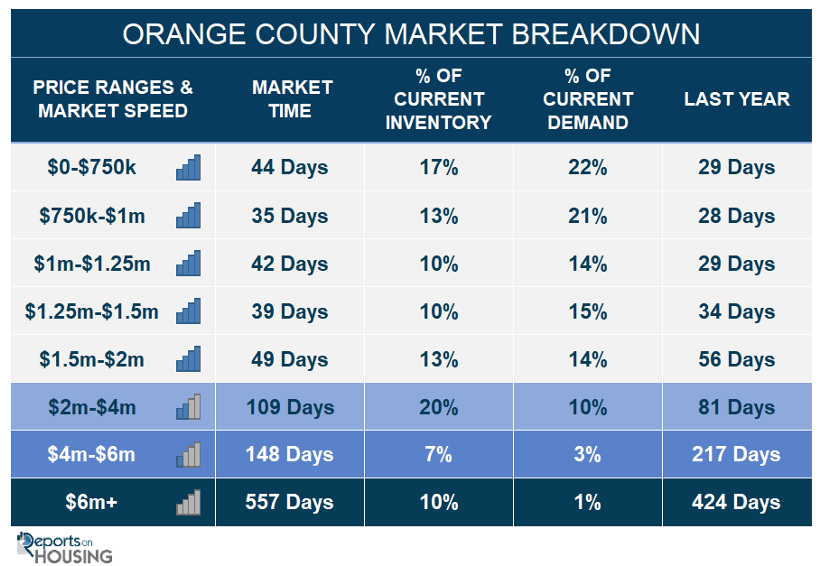
- In the past two weeks, the Expected Market Time for homes priced below $750,000 increased from 42 to 44 days. This range represents 17% of the active inventory and 22% of demand.
- The Expected Market Time for homes priced between $750,000 and $1 million increased from 33 to 35 days. This range represents 13% of the active inventory and 21% of demand.
- The Expected Market Time for homes priced between $1 million and $1.25 million increased from 39 to 42 days. This range represents 10% of the active inventory and 14% of demand.
- The Expected Market Time for homes priced between $1.25 million and $1.5 million decreased from 45 to 39 days. This range represents 10% of the active inventory and 15% of demand.
- The Expected Market Time for homes priced between $1.5 million and $2 million decreased from 55 to 49 days. This range represents 13% of the active inventory and 14% of demand.
- In the past two weeks, the expected market time for homes priced between $2 million and $4 million increased from 104 to 109 days. For homes priced between $4 million and $6 million, the Expected Market Time decreased from 197 to 148 days. For homes priced above $6 million, the Expected Market Time decreased from 715 to 557 days.
- The luxury end, all homes above $2 million, account for 37% of the inventory and 14% of demand.
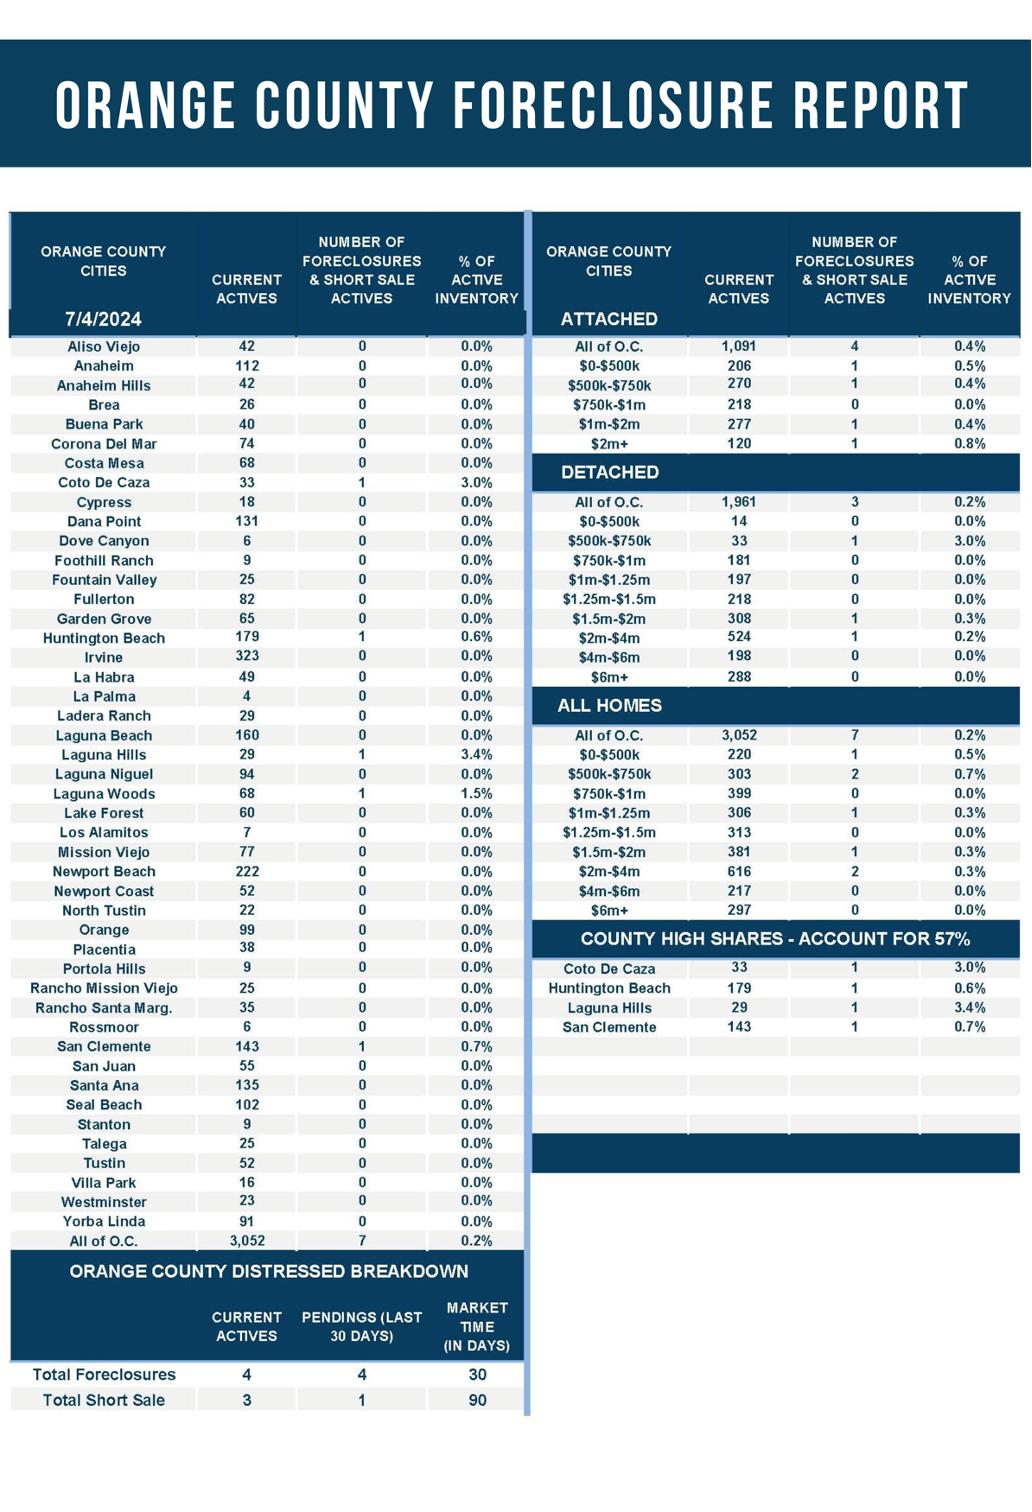
- Distressed homes, both short sales and foreclosures combined, comprised only 0.2% of all listings and 0.3% of demand. Only four foreclosures and three short sales are available today in Orange County, with seven total distressed homes on the active market, up two from two weeks ago. Last year, 12 distressed homes were on the market, similar to today.
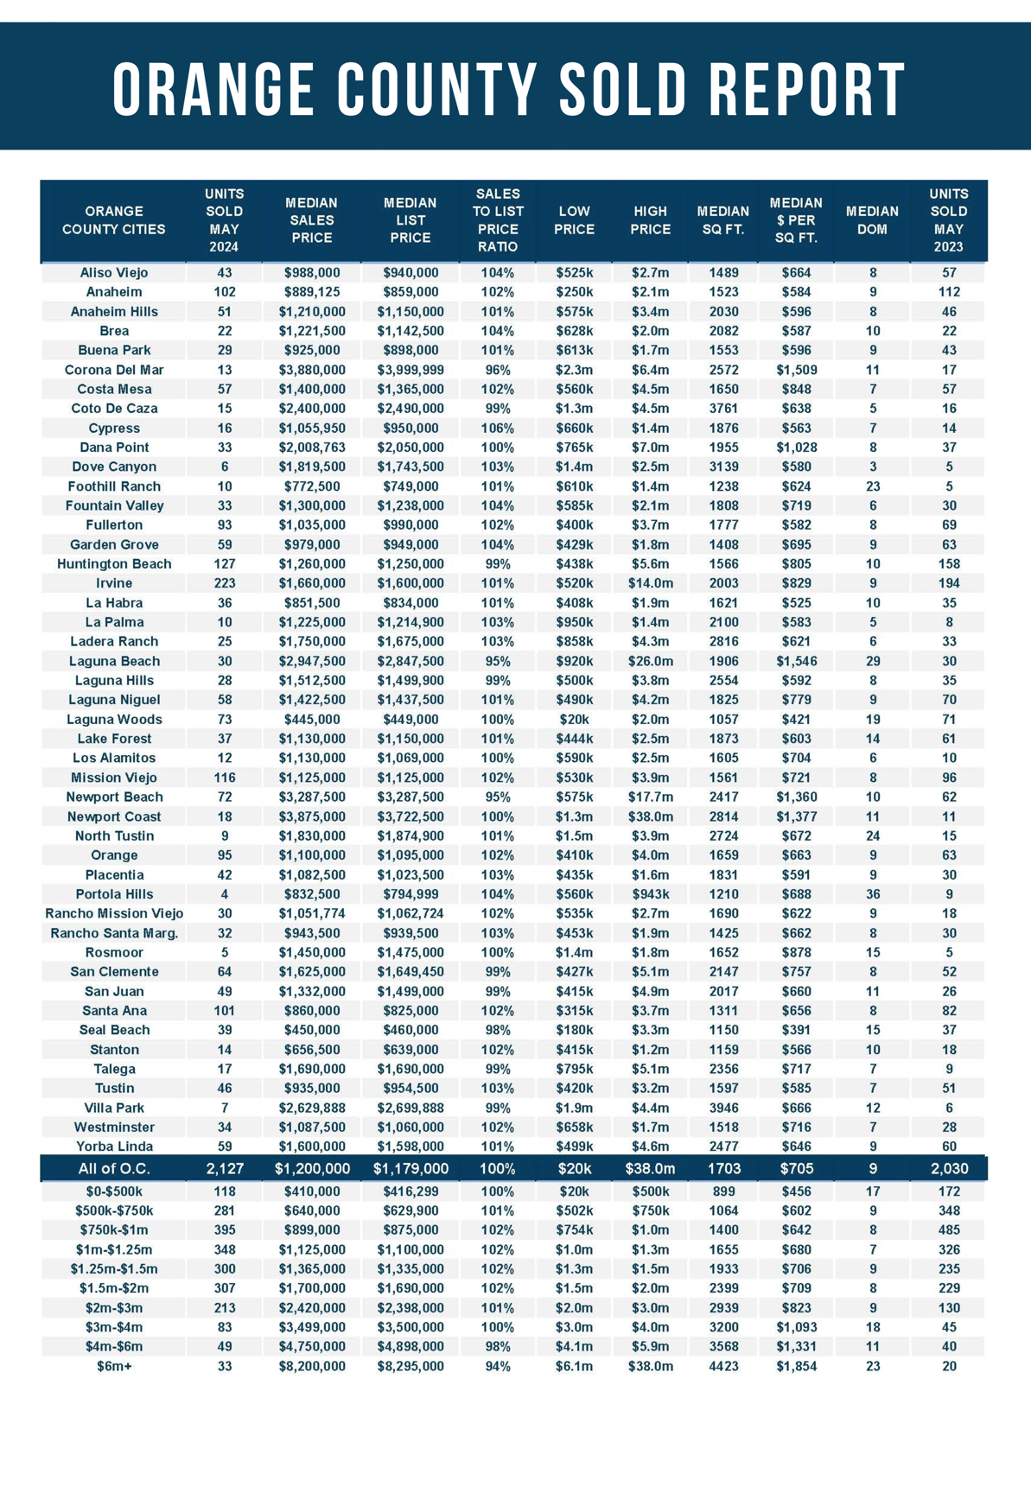
- There were 2,127 closed residential resales in May, up 5% compared to May 2023’s 2,030 and up 8% from April 2024. The sales-to-list price ratio was 100.3% for Orange County. Foreclosures accounted for 0.1% of all closed sales, and short sales accounted for 0.1%. That means that 99.8% of all sales were good ol’ fashioned sellers with equity.
Have a great week.
Sincerely,
Steven Thomas
Quantitative Economics and Decision Sciences
Copyright 2024—Steven Thomas, Reports On Housing—All Rights Reserved. This report may not be reproduced in whole or in part without express written permission from the author.