June 24, 2024
Housing is much different this year compared to last year, with more FOR-SALE signs, more OPEN HOUSE directional arrows, and longer market times.
Housing is Slowing
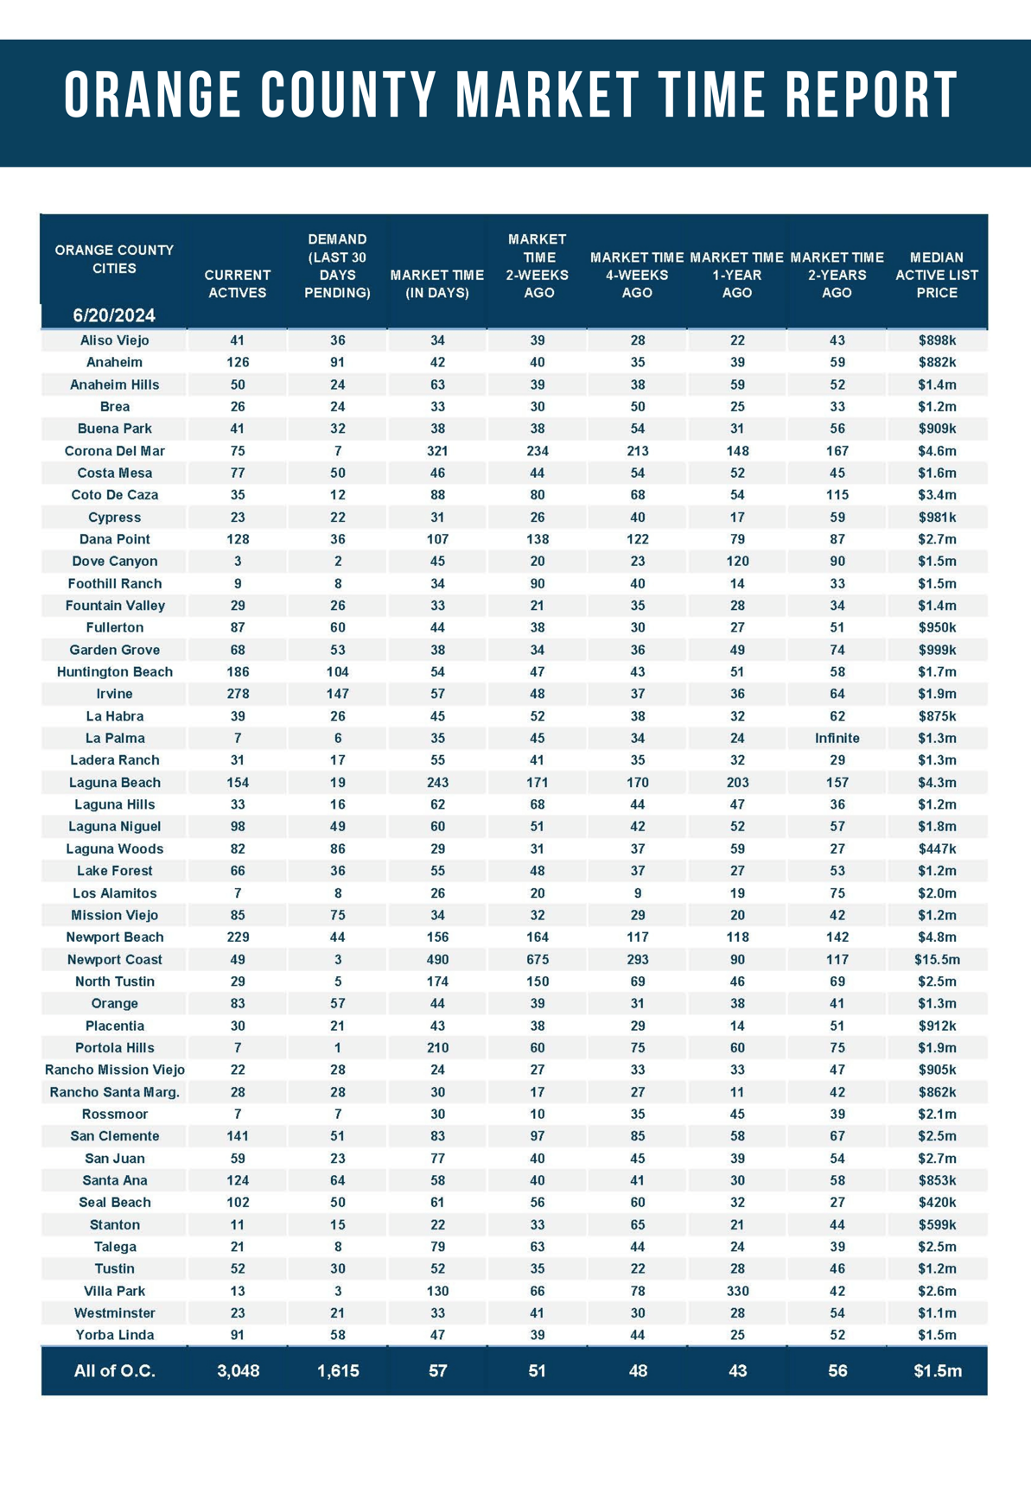
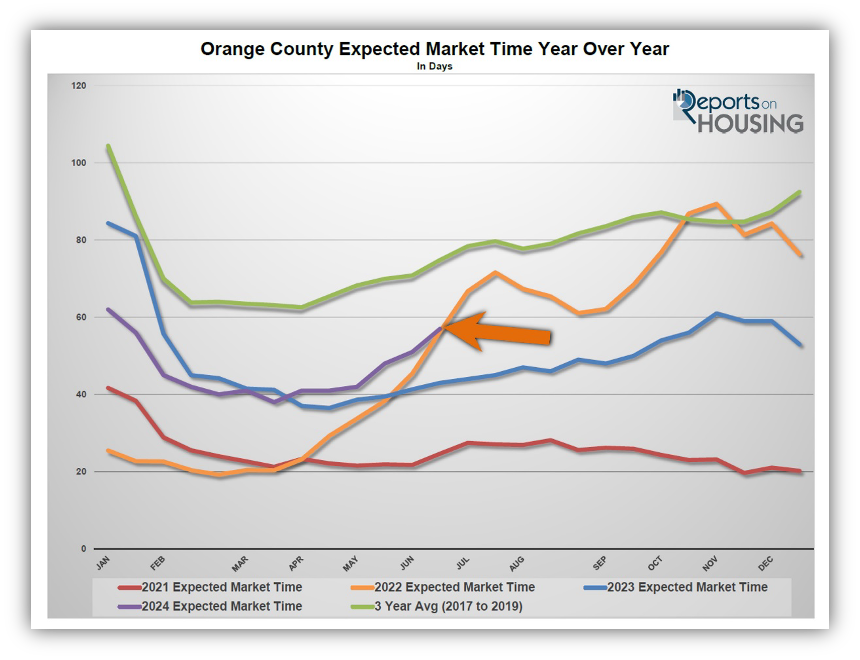
Since reaching a low of 37 days at the end of March, the Orange County Expected Market Time has swelled to 57 days.
Many times, there is a big difference between expectations and reality. Sellers are now coming on the market expecting a boatload of activity, throngs of buyers touring their homes, and instantaneous success after sifting through multiple offers. Yet, the market has evolved. A telltale sign that the market has changed is the growing number of OPEN HOUSE directional arrows that adorn busy intersections. It is now common to see the same OPEN HOUSE for multiple weekends in a row. The hot, high-paced, instant housing market has transformed into something completely different, throttling back and slowing from week to week.
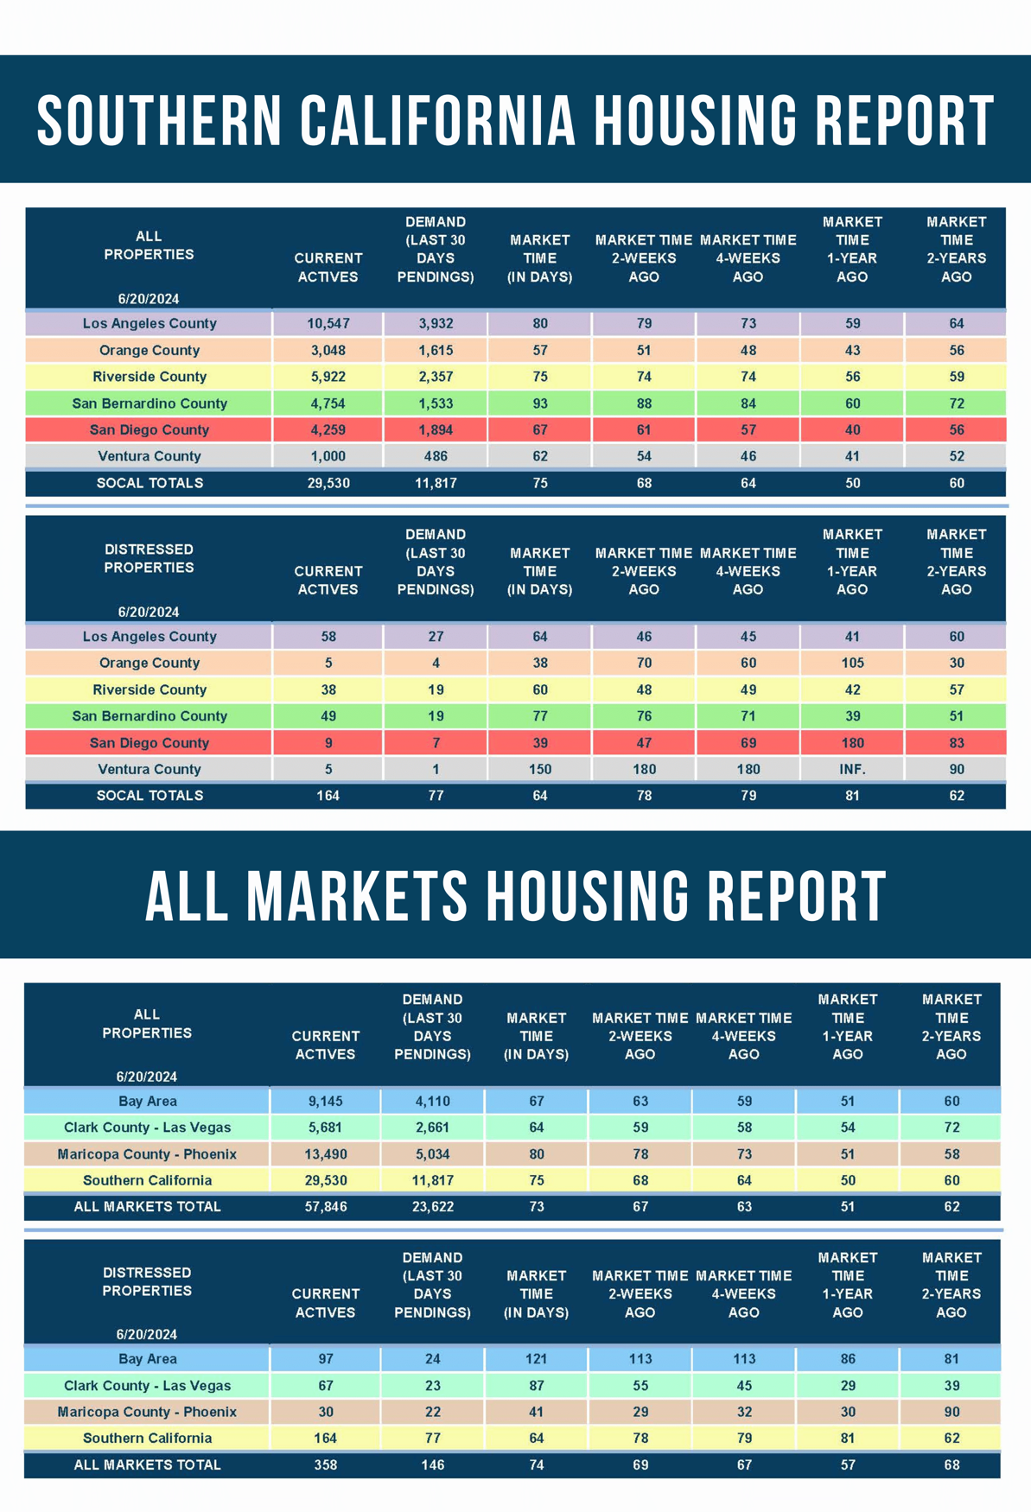
The Orange County housing market was insanely hot just a few months ago. The Expected Market Time (the number of days it takes to sell all listings at the current buying pace) grew from 37 days in March to 57 days today, the highest level for this time of year since 2019. An incredible 28% of all active listings have reduced their asking price at least once. 48% of available homes have been on the market for 30 days or more, and 25% have been exposed to the market for at least 60 days.
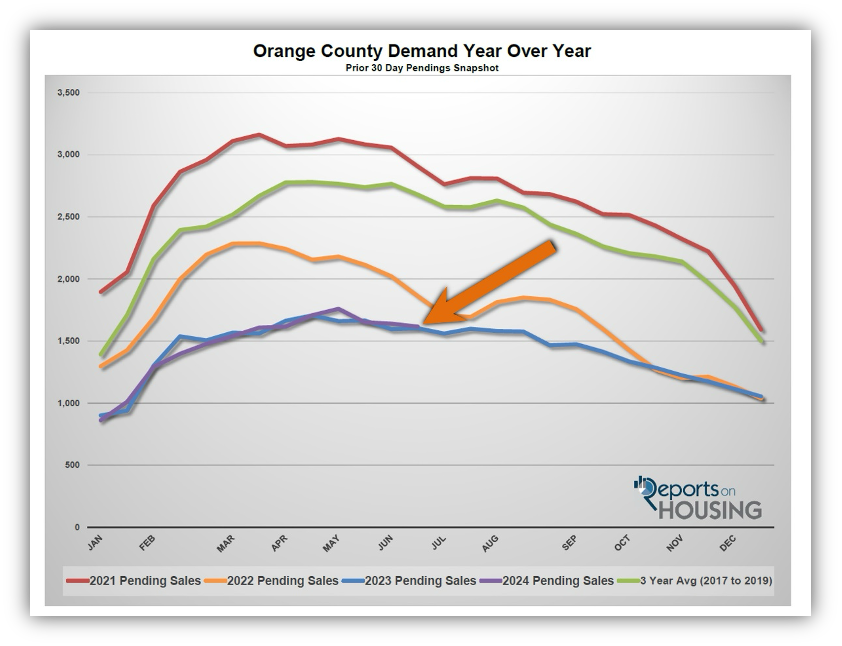
What happened in just a few short months? Buyer demand has been almost identical to last year. Year-over-year, demand (the number of pending sales over the prior 30 days) is up by only 1%, with an additional 13 pending sales. Like last year, demand is stuck at very low levels due to the sky-high mortgage rate environment. Mortgage rates have remained stubbornly above the 7% threshold for most of 2024. They will stay at these high levels until the Federal Reserve is able to reduce the short-term Federal Funds rate when the U.S. economy eventually cools. Until then, demand will persist at bare-bones levels, just like last year, due to affordability constraints. The market is slowing mainly because the inventory has grown much faster than in 2023. How can it be growing faster when demand is nearly identical to last year? More new sellers are coming on the market.
Many homeowners continue to “hunker down” in their homes, unwilling to move due to their current underlying, locked-in, low fixed-rate mortgage. Through May, 36% fewer homes came on the market compared to the 3-year average before COVID (2017 to 2019), 6,565 fewer FOR-SALE signs. Yet, there have been 1,652 additional sellers compared to last year, 16% more. The extra sellers are accumulating over time. Due to high mortgage rates, demand is not keeping up with the spike in inventory.
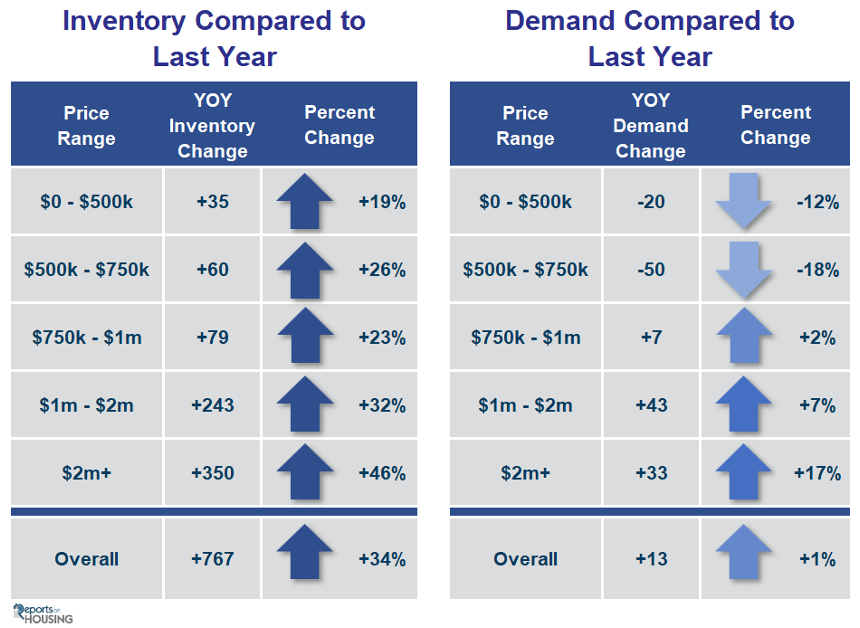
The inventory was lower year-over-year in March but is up 34% today with an extra 767 competing sellers. Every price range has more homes available to purchase. While luxury might enjoy 17% higher demand, there are 46% additional sellers.
Many sellers approach housing as if nothing has changed. They stretch the asking price and test the market. Unfortunately, OVERPRICED homes are much more common today. As market times grow longer, the number of price reductions will increase. The increasing number of OPEN HOUSE directional arrows illustrates the evolving market and necessitates a much different strategy to secure success.
ATTENTION SELLERS: Carefully arriving at the Fair Market Value by scrutinizing the most recent comparable and pending sales is essential to be successful, meticulously considering the condition, location, upgrades, and amenities. Accurate pricing is absolutely crucial. Overzealous sellers who require future price reductions will procure fewer interested buyers, fewer offers to purchase, and, ultimately, will net less money.
ATTENTION BUYERS: While the market is slower than at the start of the year, it is NOT a Buyer’s Market where prices are crumbling lower. Upgraded, nicely appointed, in good condition, and appropriately priced homes will fly off the market with plenty of activity and multiple offers. The longer a home has been on the market, the more willing a seller is to negotiate.
Active Listings
The active inventory jumped by 9% in the past couple of weeks.
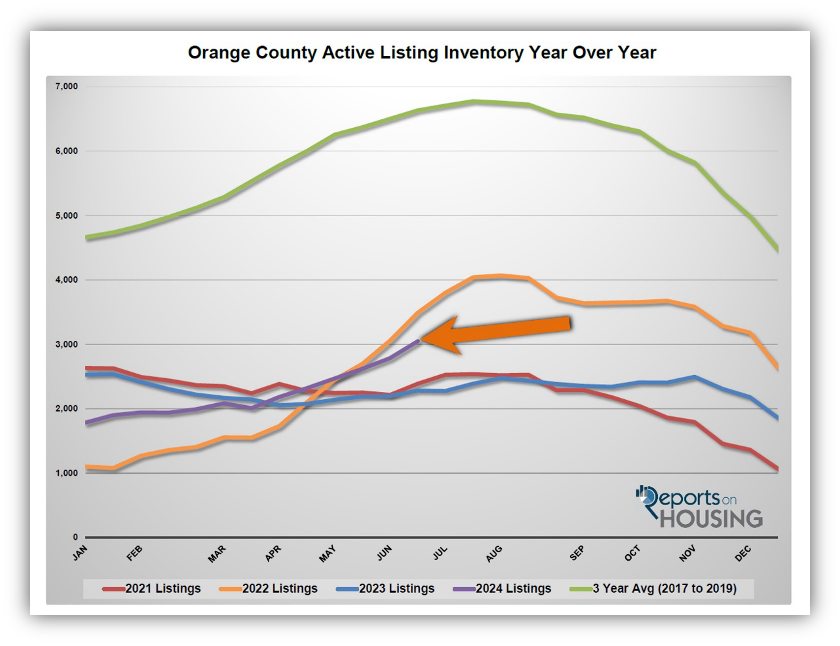
The active listing inventory increased by 262 homes in the past two weeks, up 9%, and now sits at 3,048, its largest rise of the year. It is the first time the inventory has surpassed 3,000 homes since December 2022. Housing is now knee-deep into the Summer Market, cyclically when the inventory rises and peaks between July and August and demand slowly falls. The market continues to slow until the inventory reaches its annual peak. Orange County is finally building a much-needed inventory of available homes. This will be necessary to absorb the increase in demand once rates fall sometime in the future.
Last year, the inventory was 2,281 homes, 25% lower, or 767 fewer. The 3-year average before COVID (2017 through 2019) was 6,633, an additional 3,585 homes, or 118% more, more than double the current level.
Homeowners continue to “hunker down” in their homes, unwilling to move due to their current underlying, locked-in, low fixed-rate mortgage. For May, 2,668 new sellers entered the market in Orange County, 1,497 fewer than the 3-year average before COVID (2017 to 2019), 36% less. Last April, there were 2,310 new sellers, 13% fewer than this year. More sellers are opting to sell compared to the previous year.
Demand
Demand dropped by 2% in the past couple of weeks.
Demand, a snapshot of the number of new pending sales over the prior month, decreased from 1,640 to 1,615 in the past couple of weeks, down 25 pending sales, or 2%. Demand levels closely resemble last year’s trajectory. Demand has been muted due to the high cost of housing and rates that have remained stubbornly above the 7% threshold. Even with an increasing inventory, the demand needle is not changing much because only a certain number of buyers can purchase in today’s environment. That will change as soon as rates drop. Rates will not fall until the U.S. economy downshifts from its hot pace. There are plenty of headwinds: the lowest consumer savings rate since 2009, sharply rising credit card debt, and swiftly rising serious delinquency rates for credit card and automobile debt. Eventually, the economy will cool.
As the Federal Reserve has indicated, it is essential to watch all economic releases for signs of slowing. These releases have the potential to move mortgage rates higher or lower, and it all depends upon how they stack up compared to market expectations. Last week’s retail sales, according to the Census Bureau, were lower than expected, which is good news for rates. The Federal Reserve’s preferred inflation gauge, Personal Consumption Expenditures (PCE), will be released this Friday, a critical date for mortgage rates.
Last year, demand was 1,602, 1% less than today, or 13 fewer pending sales. The 3-year average before COVID (2017 to 2019) was 2,679 pending sales, 66% more than today, or an additional 1,064.
With supply rising and demand falling, the Expected Market Time (the number of days it takes to sell all Orange County listings at the current buying pace) increased from 51 to 57 days in the past couple of weeks, its highest level since the very start of January. Last year, it was 43 days, faster than today. The 3-year average before COVID was 75 days, slower than today.
Luxury End
The luxury market cooled quite a bit in the past couple of weeks.
In the past couple of weeks, the luxury inventory of homes priced above $2 million swelled from 1,018 to 1,119 homes, up 101 or 10%, the highest level since November 2019. Luxury demand decreased by 27 pending sales, down 11%, and now sits at 222. With supply surging and demand falling, the Expected Market Time for luxury homes priced above $2 million jumped from 123 to 151 days, its highest level since the very start of January. Luxury has been rapidly slowing since March and the Expected Market Time has grown from 86 to 151 days. These longer market times require a careful approach to pricing with the knowledge that it may take a lot longer to secure success.
Year over year, the active luxury inventory is up by 350 homes or 46%, and luxury demand is up by 33 pending sales or 17%. Last year’s Expected Market Time was 122 days, faster than today.
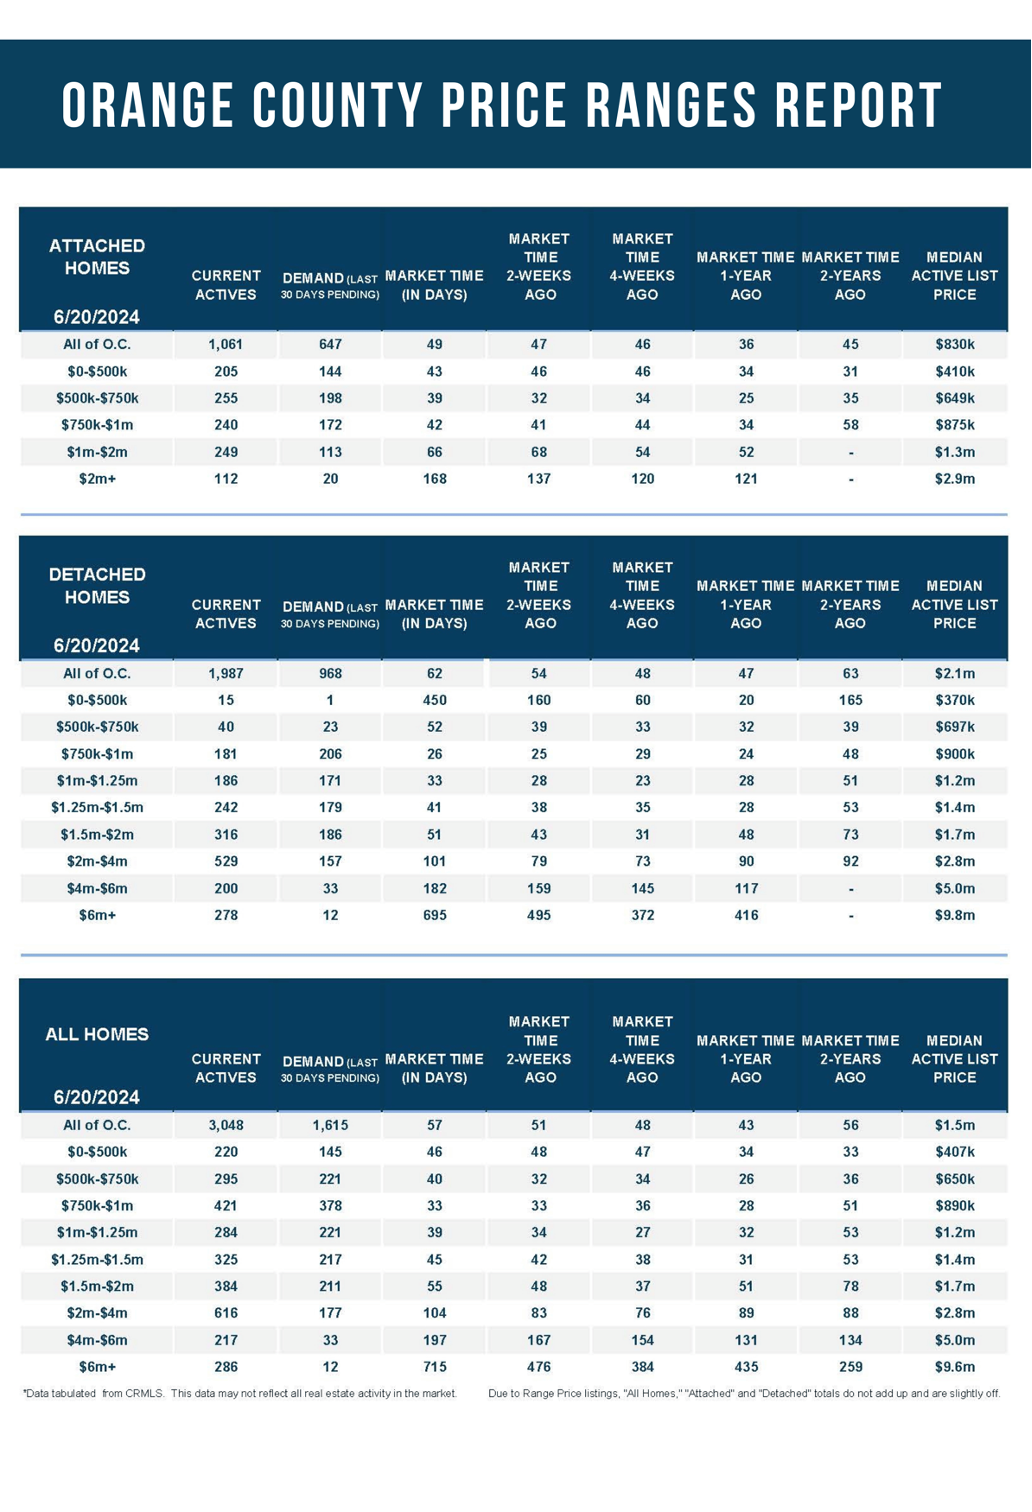
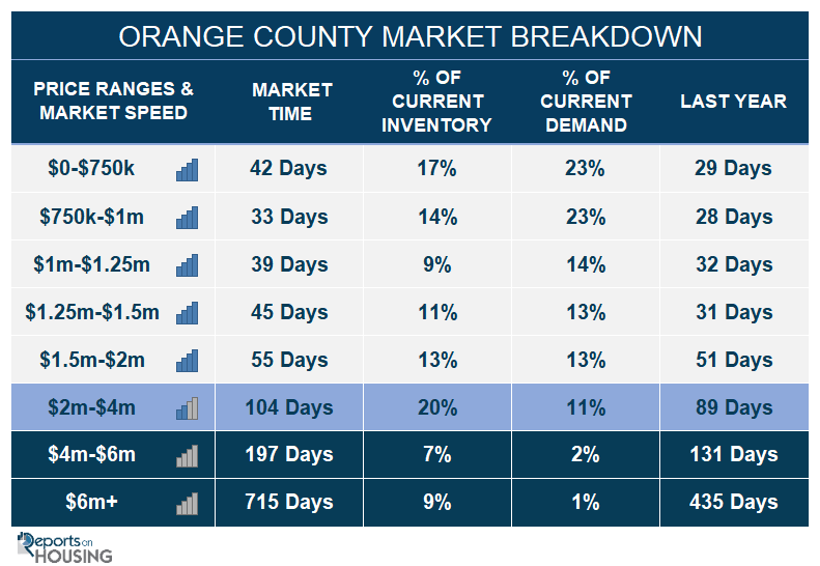
In the past two weeks, the expected market time for homes priced between $2 million and $4 million increased from 86 to 104 days. For homes priced between $4 million and $6 million, the Expected Market Time increased from 167 to 197 days. For homes priced above $6 million, the Expected Market Time increased from 476 to 715 days. At 715 days, a seller would be looking at placing their home into escrow around June 2026.
Orange County Housing Summary
- The active listing inventory in the past couple of weeks jumped by 262 homes, up 9%, and now sits at 3,048, its highest level since December 2022. In May, 36% fewer homes came on the market compared to the 3-year average before COVID (2017 to 2019), 1,497 less. 358 more sellers came on the market this May compared to May 2023. Last year, there were 2,281 homes on the market, 767 fewer homes, or 25% less. The 3-year average before COVID (2017 to 2019) was 6,633, or 118% extra, more than double.
- Demand, the number of pending sales over the prior month, decreased by 25 pending sales in the past two weeks, down 2%, and now totals 1,615. Last year, there were 1,602 pending sales, 1% less. The 3-year average before COVID (2017 to 2019) was 2,679, or 66% more.
- With supply rising and demand falling, the Expected Market Time, the number of days to sell all Orange County listings at the current buying pace, increased from 51 to 57 days in the past couple of weeks. It was 43 days last year, faster than today. The 3-year average before COVID (2017 to 2019) was 75 days, slower than today.
- In the past two weeks, the Expected Market Time for homes priced below $750,000 increased from 38 to 42 days. This range represents 17% of the active inventory and 23% of demand.
- The Expected Market Time for homes priced between $750,000 and $1 million remained unchanged at 33 days. This range represents 14% of the active inventory and 23% of demand.
- The Expected Market Time for homes priced between $1 million and $1.25 million increased from 34 to 39 days. This range represents 9% of the active inventory and 13% of demand.
- The Expected Market Time for homes priced between $1.25 million and $1.5 million increased from 42 to 45 days. This range represents 11% of the active inventory and 13% of demand.
- The Expected Market Time for homes priced between $1.5 million and $2 million increased from 48 to 55 days. This range represents 13% of the active inventory and 13% of demand.
- In the past two weeks, the expected market time for homes priced between $2 million and $4 million increased from 86 to 104 days. For homes priced between $4 million and $6 million, the Expected Market Time increased from 167 to 197 days. For homes priced above $6 million, the Expected Market Time increased from 476 to 715 days.
- The luxury end, all homes above $2 million, account for 36% of the inventory and 14% of demand.
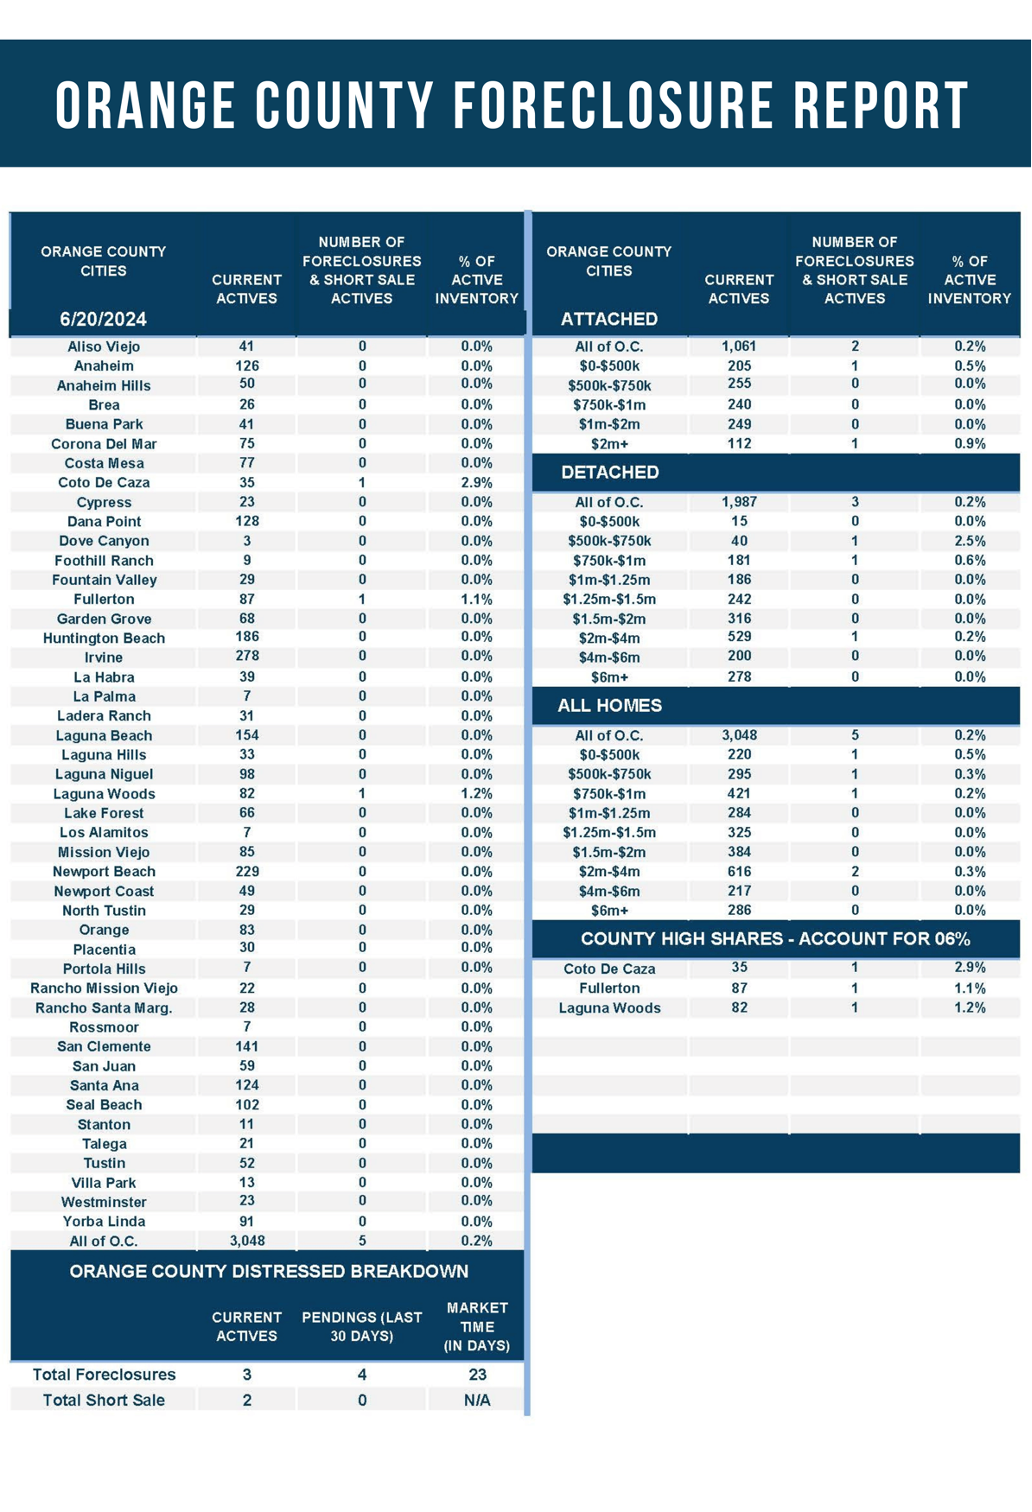
- Distressed homes, both short sales and foreclosures combined, comprised only 0.2% of all listings and 0.2% of demand. Only three foreclosures and two short sales are available today in Orange County, with five total distressed homes on the active market, down two from two weeks ago. Last year, seven distressed homes were on the market, similar to today.
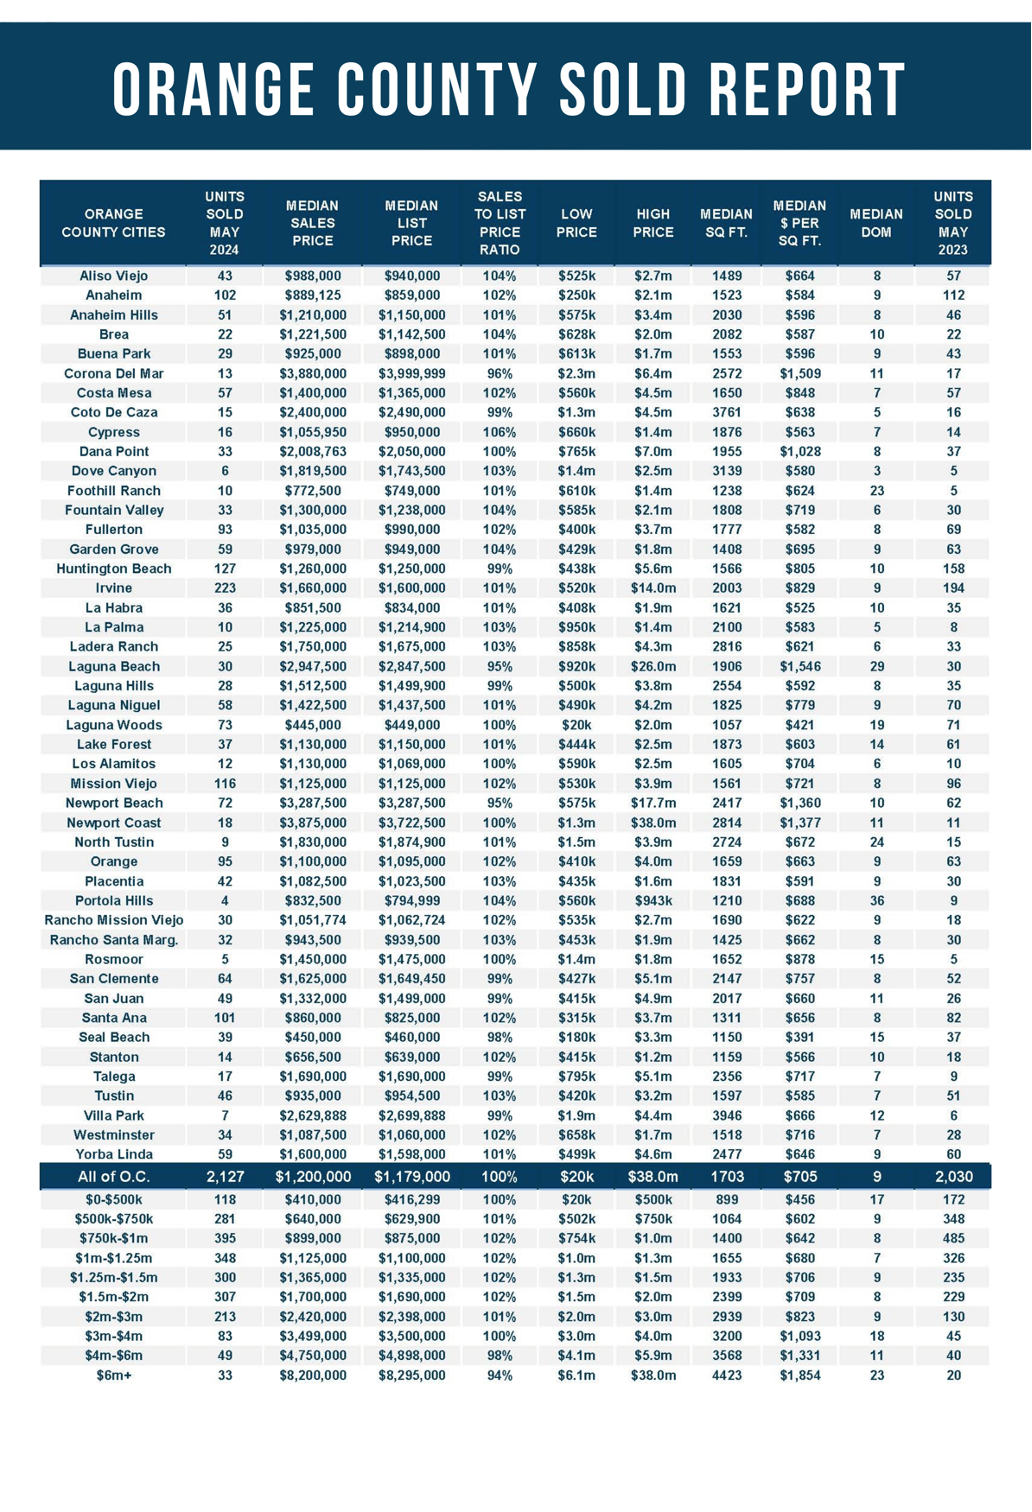
- There were 2,127 closed residential resales in May, up 5% compared to May 2023’s 2,030 and up 8% from April 2024. The sales-to-list price ratio was 100.3% for Orange County. Foreclosures accounted for 0.1% of all closed sales, and short sales accounted for 0.1%. That means that 99.8% of all sales were good ol’ fashioned sellers with equity.
Have a great week.
Sincerely,
Steven Thomas
Quantitative Economics and Decision Sciences
Copyright 2024—Steven Thomas, Reports On Housing—All Rights Reserved. This report may not be reproduced in whole or in part without express written permission from the author.