May 13, 2024
While the inventory may still be limited and not even close to returning to pre-pandemic levels, there are finally more homes coming on the market.
A Rise in Sellers
There are 18% more sellers than last year.
The pandemic severely disrupted the new car supply chain, resulting in inventories hitting an unprecedented low in 2021. New car dealerships looked like empty parking lots. Many interested buyers were forced to pre-order their new automobile purchases. Sales often included a premium and ultimately sold over retail. That all changed as the inventory slowly climbed along with rising interest rates. Finally, there are a lot more cars sitting on the lots. While they have not returned to averages before the pandemic, it is a healthy step in the right direction.
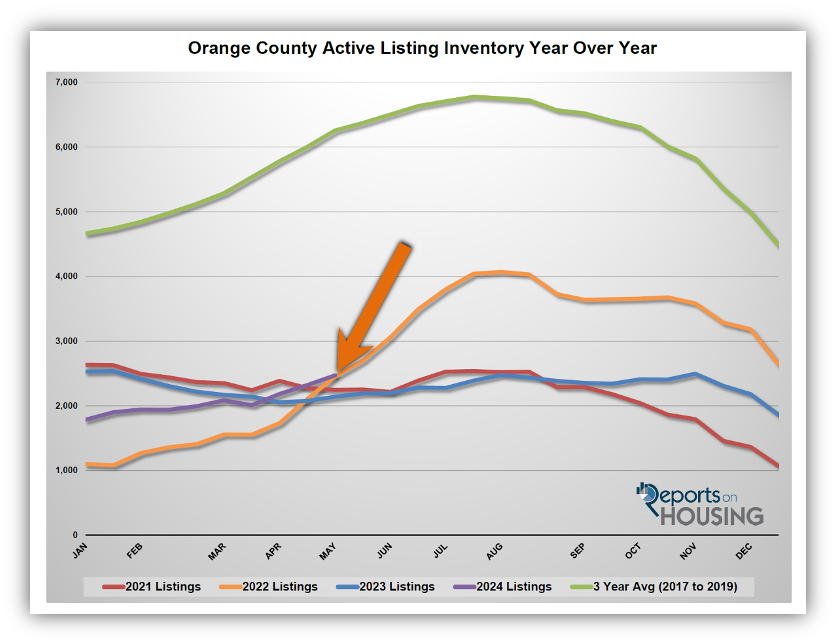
Similarly, housing inventories were severely disrupted during the pandemic. It was not until 2022, when mortgage rates climbed from 3.25% in January to 7.37% in October, that the Orange County inventory finally rose. The supply increased from 1,100 in January until it peaked in August at 4,069 homes, a rise of 269% or 2,969. Yet in 2023, the inventory fell from 2,536 in January to 2,053 in mid-April, a drop of 19%. It then slowly rose until peaking in November at 2,496, an increase of only 22% or 443 homes. Mortgage rates started the year at 6% and eclipsed 8% in October. Affordability was a significant issue, yet the inventory remained relatively flat all year. Intuitively, many thought the inventory would continue to climb rapidly as it did during the second half of 2022 due to the high mortgage rate environment. That was not the case. What happened? Too many homeowners “hunkered down” in their homes and opted not to sell.
The hunkering-down phenomenon developed because homeowners were unwilling to move due to their current underlying, locked-in, low fixed-rate mortgage. The difference between their low fixed rate and the prevailing rate of the day was substantial and precluded many homeowners from listing their homes for sale and moving to another house. Through the fourth quarter of 2023, according to the Federal Housing Finance Agency’s National Mortgage Database, 84% of all Californians with a mortgage have a mortgage rate at or below 5%. Two-thirds, 67%, have a rate at or below 4%. And an astonishing 30% are at or below 3%. In 2022, there were 22% fewer sellers compared to the 3-year average before COVID (2017 to 2019), or 8,450 missing FOR-SALE signs. In 2023, the lack of homeowners willing to participate
became an acute problem. There were 42% fewer sellers, or 16,024 missing signs. Considering that the 3-year pre-pandemic average annual closed sales was 29,361, a large share of the market was absent.
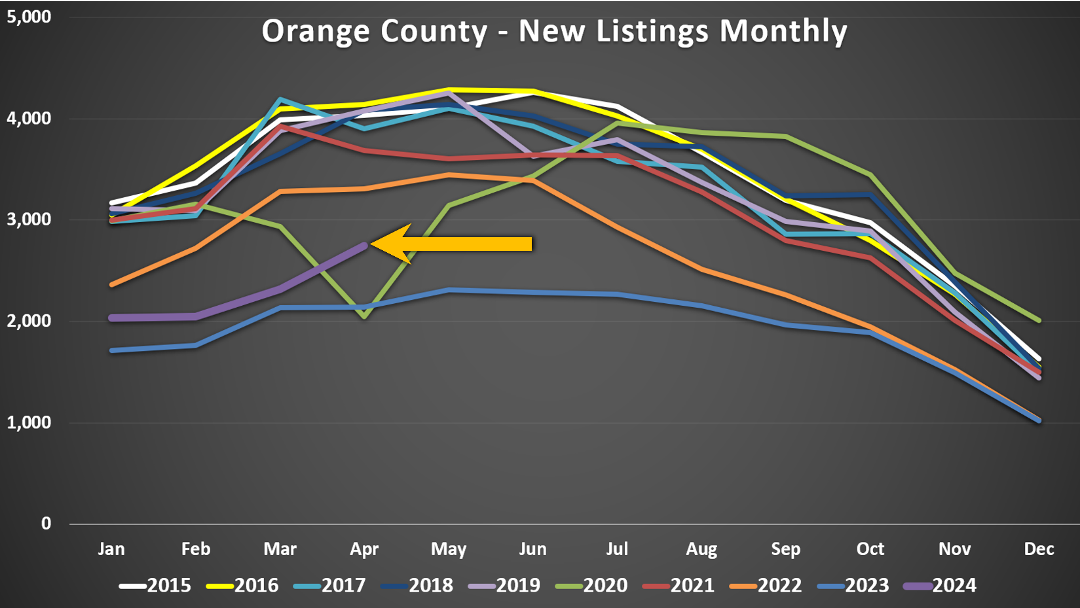
In 2024, a new trend developed. Rates have been stubbornly high for nearly two years, and many homeowners are tired of waiting for them to fall. The deficiency in home sellers over the past couple of years meant that many owners had placed their desire to sell on hold. They want to sell for a variety of reasons. Empty nesters want to downsize. Growing families want a larger home with a yard. Others want to relocate closer to their kids. There are a number of reasons people want to move, and they do not want to sit on the sidelines forever. So, in 2024, even though rates have remained high, more homeowners are finally coming on the market.
There were 18% more new listings through April compared to last year, which is an additional 1,396 FOR-SALE signs. While there is still an overabundance of homeowners sitting on the sidelines hunkering down, the extra signs compared to last year are a welcome step in the right direction for an inventory starved for more choices. In April, there were 28% more sellers compared to April 2023, the largest year-over-year rise so far. That is over 600 more new listings.
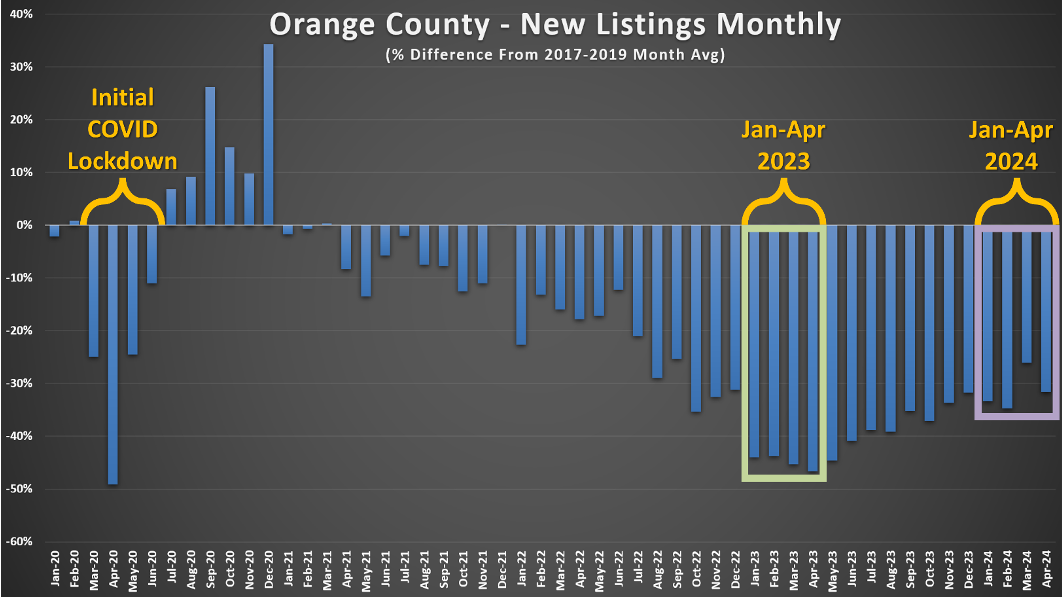
Compared to the 3-year average before COVID, there are still 35% fewer new listings or 4,966 missing signs through April. Yet, that is much better than last year’s 45% fewer listings or 6,362 missing signs. This new trend of more homes coming on the market occurred while rates exceeded 7% for over half of 2024. Mortgage rates hit 7.5% three times in April, according to Mortgage News Daily. They are forecasted to drop later this year, which will only incentivize more homeowners to list their homes for sale as the difference between their low fixed rate and the prevailing rate will narrow. The lower mortgage rates drop, the more homeowners sitting on the sidelines waiting to sell will jump in and list their homes.
As a result of more homes coming on the market, the active listing inventory has grown from 1,785 at the start of the year to 2,470 today, a rise of 38% or 685 homes. There are 15% more homes available today than last year. A meaningful rise in inventory is another excellent trend that developed this year. Finally, there are more choices.
Active Listings
The active inventory climbed by 6% in the past couple of weeks.
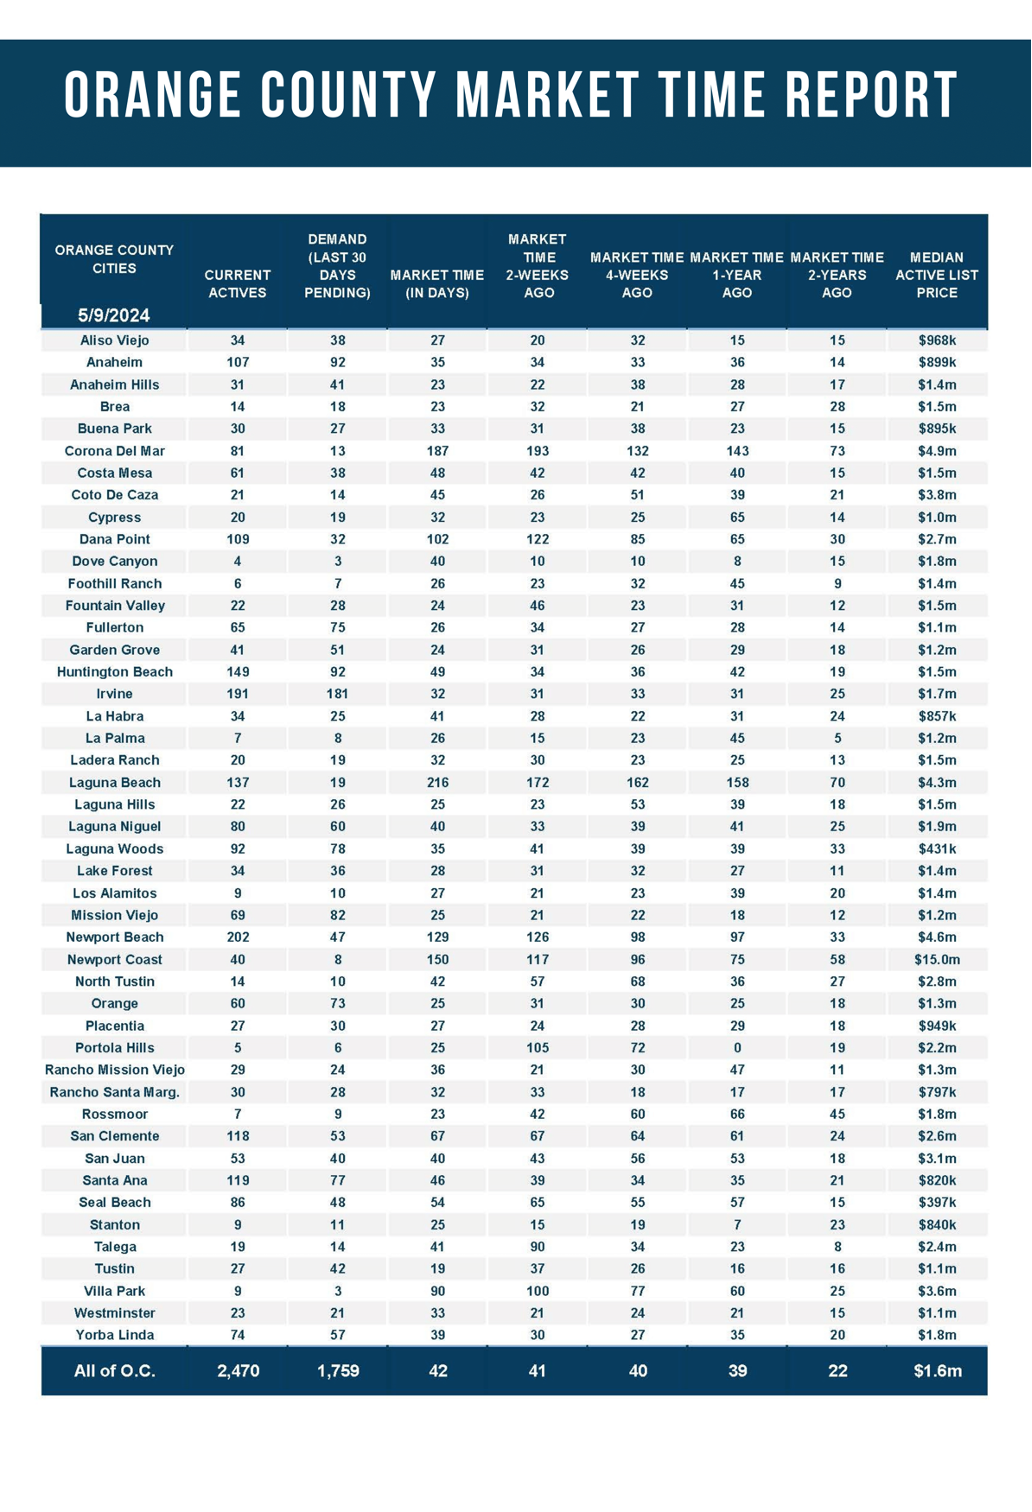
The active listing inventory increased by 150 homes in the past two weeks, up 6%, and now sits at 2,470, its highest level since last year’s November peak of 2,496. The inventory has climbed by 460 homes or 23% in the past six weeks. Until rates fall below 7%, the inventory will continue to climb. At this point, it appears that a typical cycle peak will be reached sometime between July and August.
Last year, the inventory was 2,139 homes, 13% lower, or 331 fewer. The 3-year average before COVID (2017 through 2019) was 6,255, an additional 3,785 homes, or 153% more, more than double the current level.
Demand
Demand increased by 3% in the past couple of weeks.
Demand, a snapshot of the number of new pending sales over the prior month, increased from 1,707 to 1,759 in the past couple of weeks, up 52 pending sales, or 3%, its highest level since September 2022. Demand has not reached its 2024 peak yet. Typically, demand peaks between April and May. Yet, if rates drop later this year, as forecasted by many experts, demand is expected to improve, which could result in a much later peak. The Federal Reserve has indicated that it will cut rates sometime this year. They are currently very “data dependent,” meaning they are waiting to see trends suggesting a cooling economy and falling inflation. The path of inflation and the economy will dictate the direction of mortgage rates and the number of rate cuts ahead.
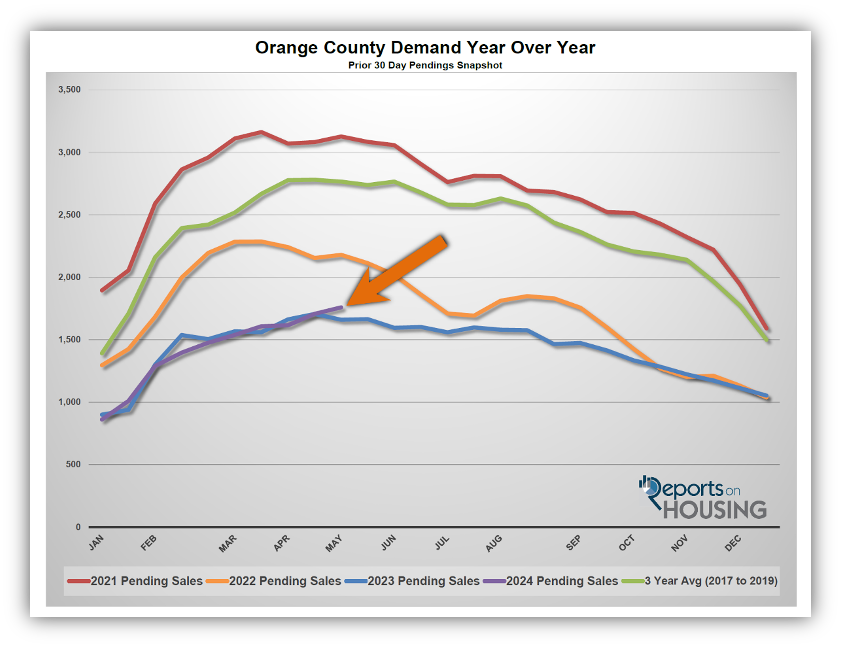
Last year, demand was 1,660, 6% less than today, or 99 fewer pending sales. The 3-year average before COVID (2017 to 2019) was 2,765 pending sales, 57% more than today, or an additional 1,006.
With supply rising faster than demand, the Expected Market Time (the number of days it takes to sell all Orange County listings at the current buying pace) increased from 41 to 42 days in the past couple of weeks. Last year, it was 39 days, similar to today. The 3-year average before COVID was 68 days, slower than today.
Luxury End
Luxury supply and demand are rising at similar rates.
In the past couple of weeks, the luxury inventory of homes priced above $2 million increased from 851 to 935 homes, up 84 or 10%, the highest level since October 2020. Luxury demand increased by 25 pending sales, up 10%, and now sits at 275, its highest level since May 2021. With supply and demand rising at a similar pace, the Expected Market Time for luxury homes priced above $2 million decreased slightly from 103 to 102 days. The 102-day level is hot for luxury, a direct result of financial markets reaching all-time highs this year.
Year over year, the active luxury inventory is up by 228 homes or 32%, and luxury demand is up by 82 pending sales or 42%. Last year’s Expected Market Time was 110 days, similar to today.
In the past two weeks, the expected market time for homes priced between $2 million and $4 million increased from 65 to 66 days. For homes priced between $4 million and $6 million, the Expected Market Time decreased from 184 to 167 days. For homes priced above $6 million, the Expected Market Time decreased from 439 to 413 days. At 413 days, a seller would be looking at placing their home into escrow around June 2025.
Orange County Housing Summary
- The active listing inventory in the past couple of weeks increased by 150 homes, up 6%, and now sits at 2,470. In April, 32% fewer homes came on the market compared to the 3-year average before COVID (2017 to 2019), 1,272 less. 604 more sellers came on the market this April compared to 2023. Last year, there were 2,139 homes on the market, 331 fewer homes, or 13% less. The 3-year average before COVID (2017 to 2019) was 6,255, or 153% extra, more than double.
- Demand, the number of pending sales over the prior month, increased by 52 pending sales in the past two weeks, up 3%, and now totals 1,759. Last year, there were 1,660 pending sales, 6% fewer. The 3-year average before COVID (2017 to 2019) was 2,765, or 57% more.
- With supply rising faster than demand, the Expected Market Time, the number of days to sell all Orange County listings at the current buying pace, increased from 41 to 42 days in the past couple of weeks. It was 39 days last year, similar to today. The 3-year average before COVID (2017 to 2019) was 68 days, slower than today.
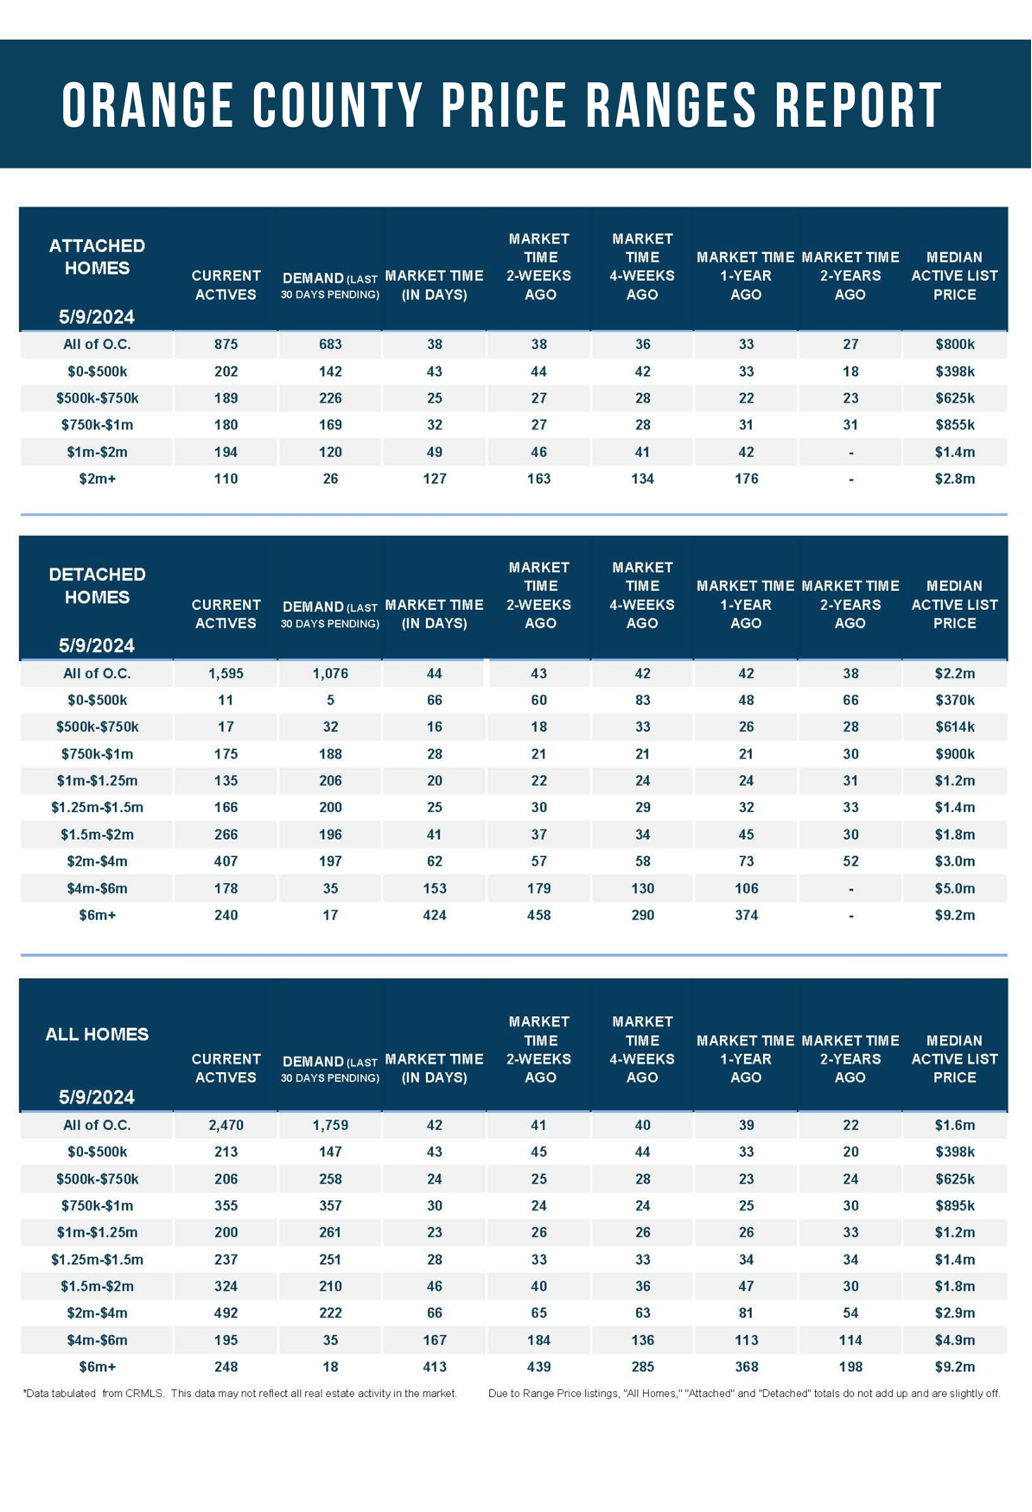
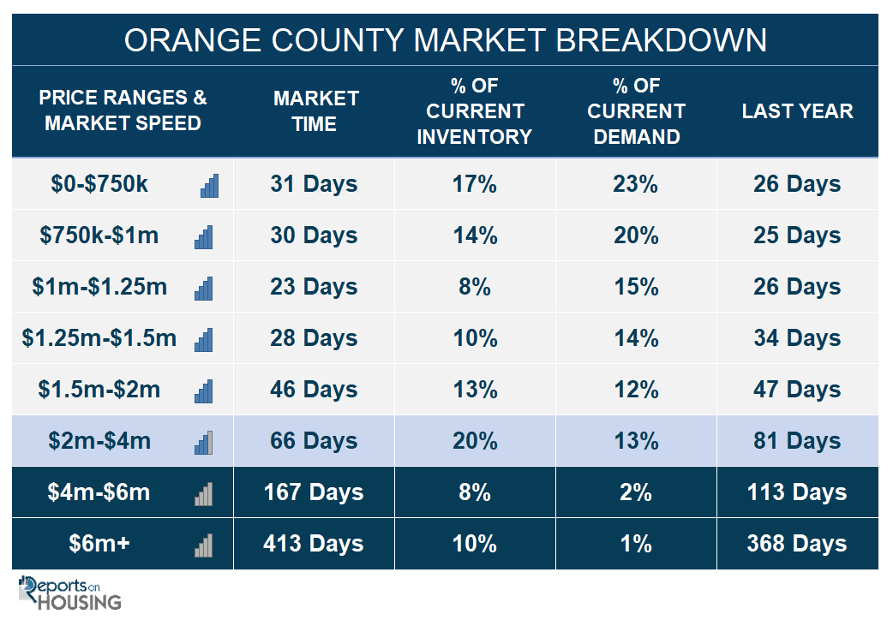
- In the past two weeks, the Expected Market Time for homes priced below $750,000 decreased from 32 to 31 days. This range represents 17% of the active inventory and 23% of demand.
- The Expected Market Time for homes priced between $750,000 and $1 million decreased from 24 to 23 days. This range represents 14% of the active inventory and 20% of demand.
- The Expected Market Time for homes priced between $1 million and $1.25 million increased from 26 to 28 days. This range represents 10% of the active inventory and 14% of demand.
- The Expected Market Time for homes priced between $1.25 million and $1.5 million decreased from 33 to 28 days. This range represents 10% of the active inventory and 14% of demand.
- The Expected Market Time for homes priced between $1.5 million and $2 million increased from 40 to 46 days. This range represents 13% of the active inventory and 12% of demand.
- In the past two weeks, the expected market time for homes priced between $2 million and $4 million increased from 65 to 66 days. For homes priced between $4 million and $6 million, the Expected Market Time decreased from 184 to 167 days. For homes priced above $6 million, the Expected Market Time decreased from 439 to 413 days.
- The luxury end, all homes above $2 million, account for 38% of the inventory and 16% of demand.
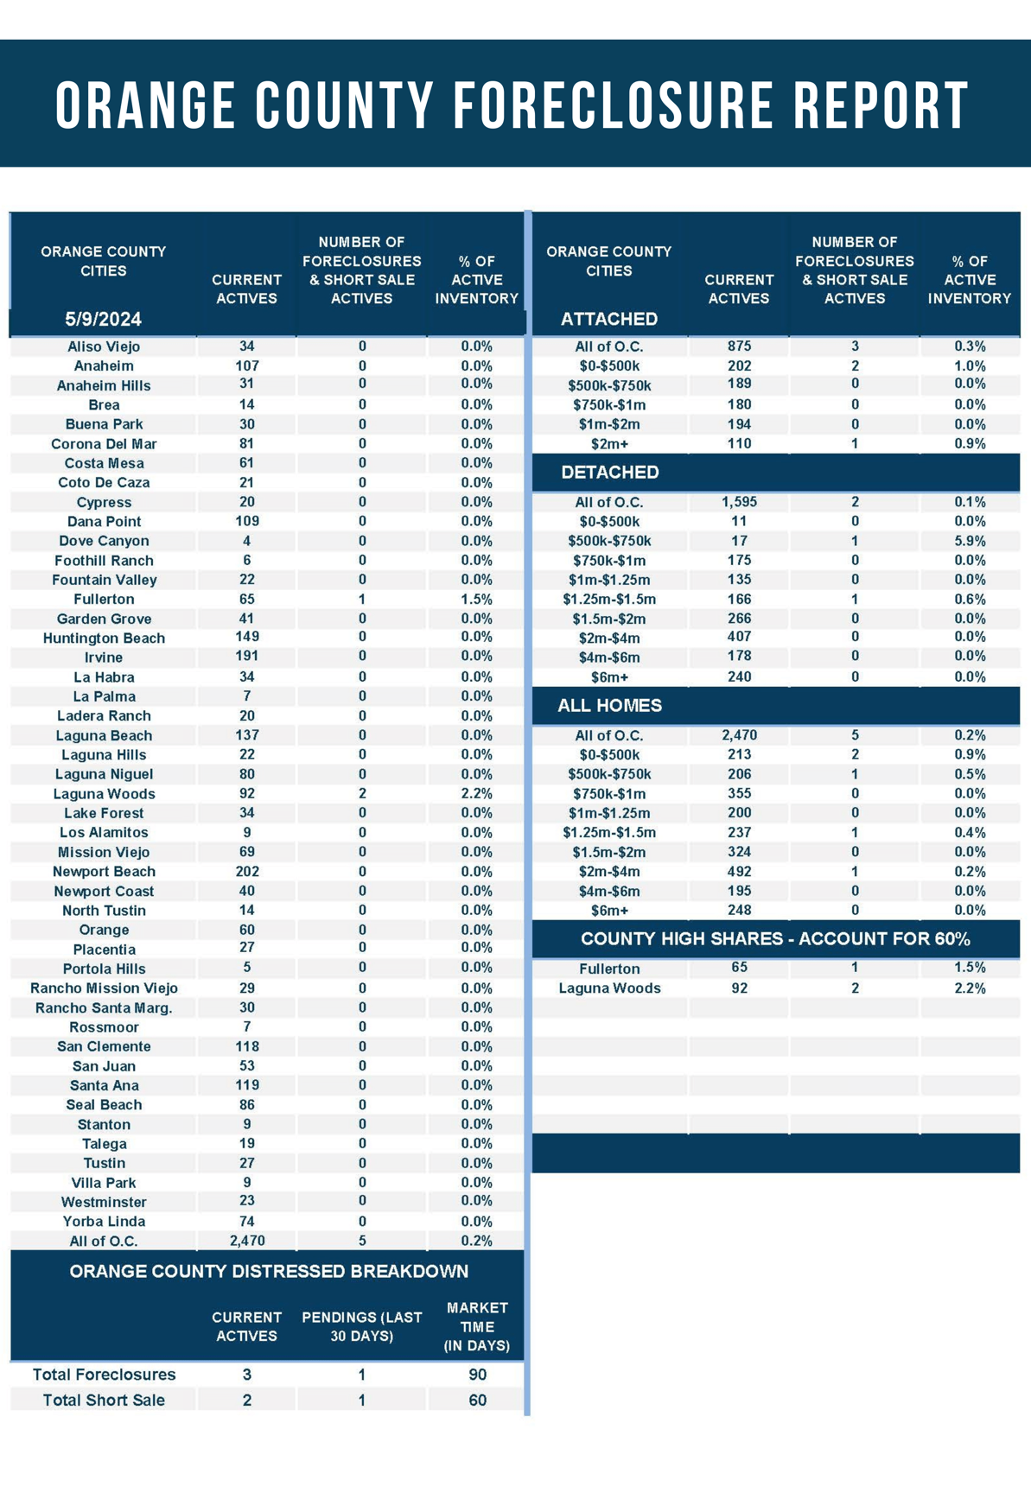
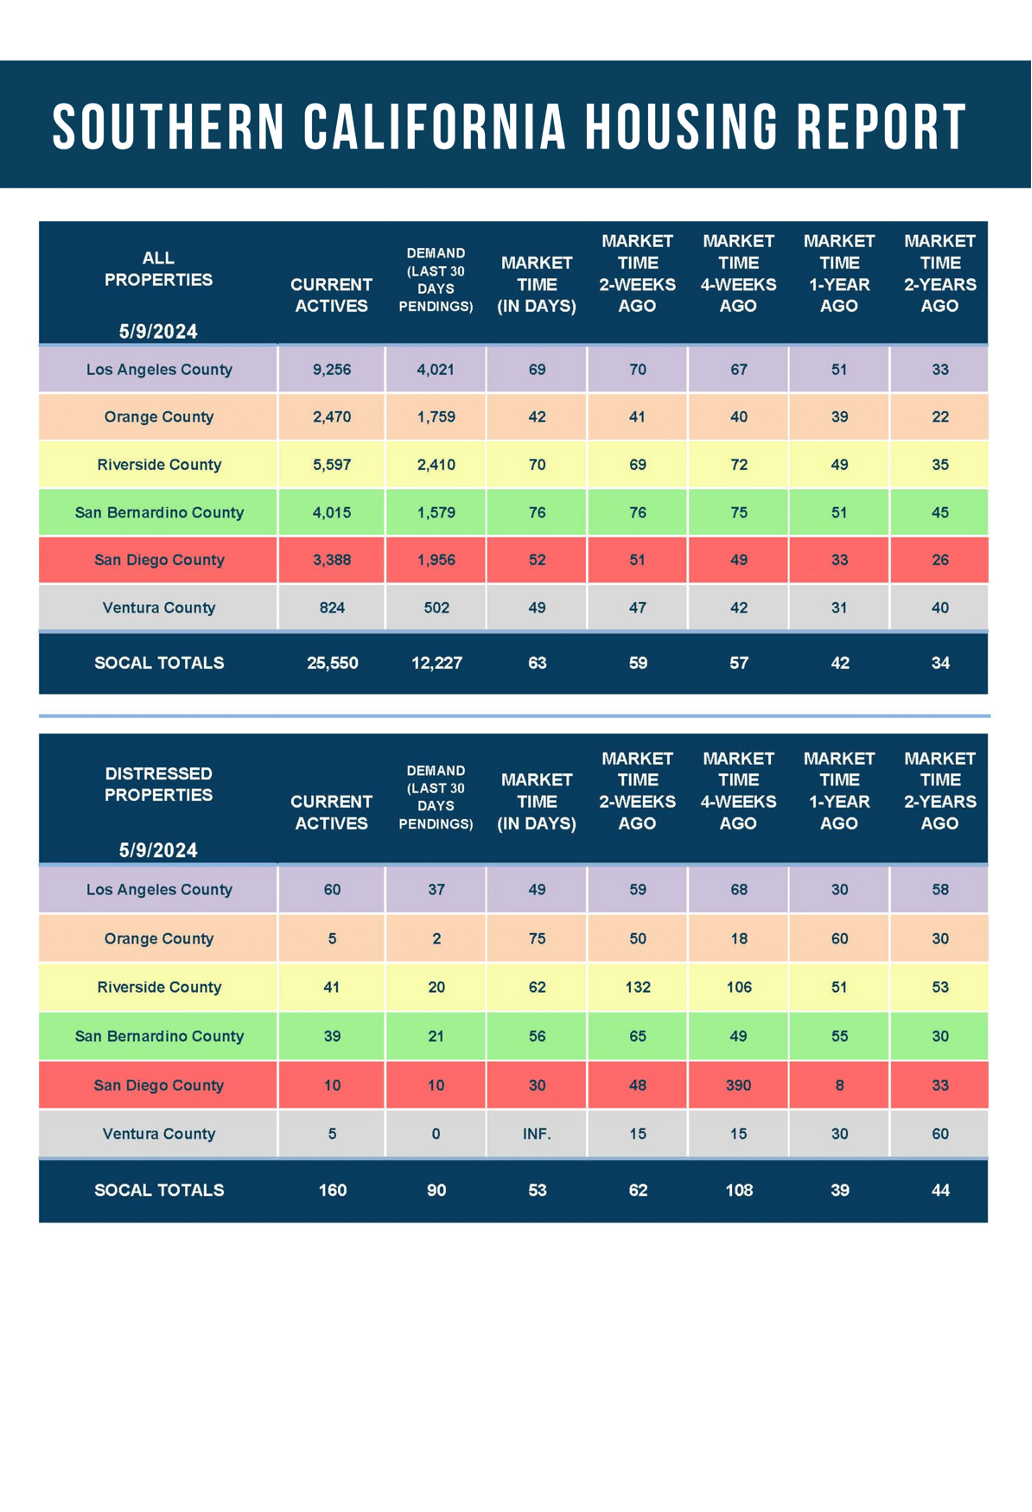
- Distressed homes, both short sales and foreclosures combined, comprised only 0.2% of all listings and 0.1% of demand. Only three foreclosures and two shorts sales are available today in Orange County, with five total distressed homes on the active market, up one from two weeks ago. Last year, ten distressed homes were on the market, similar to today.
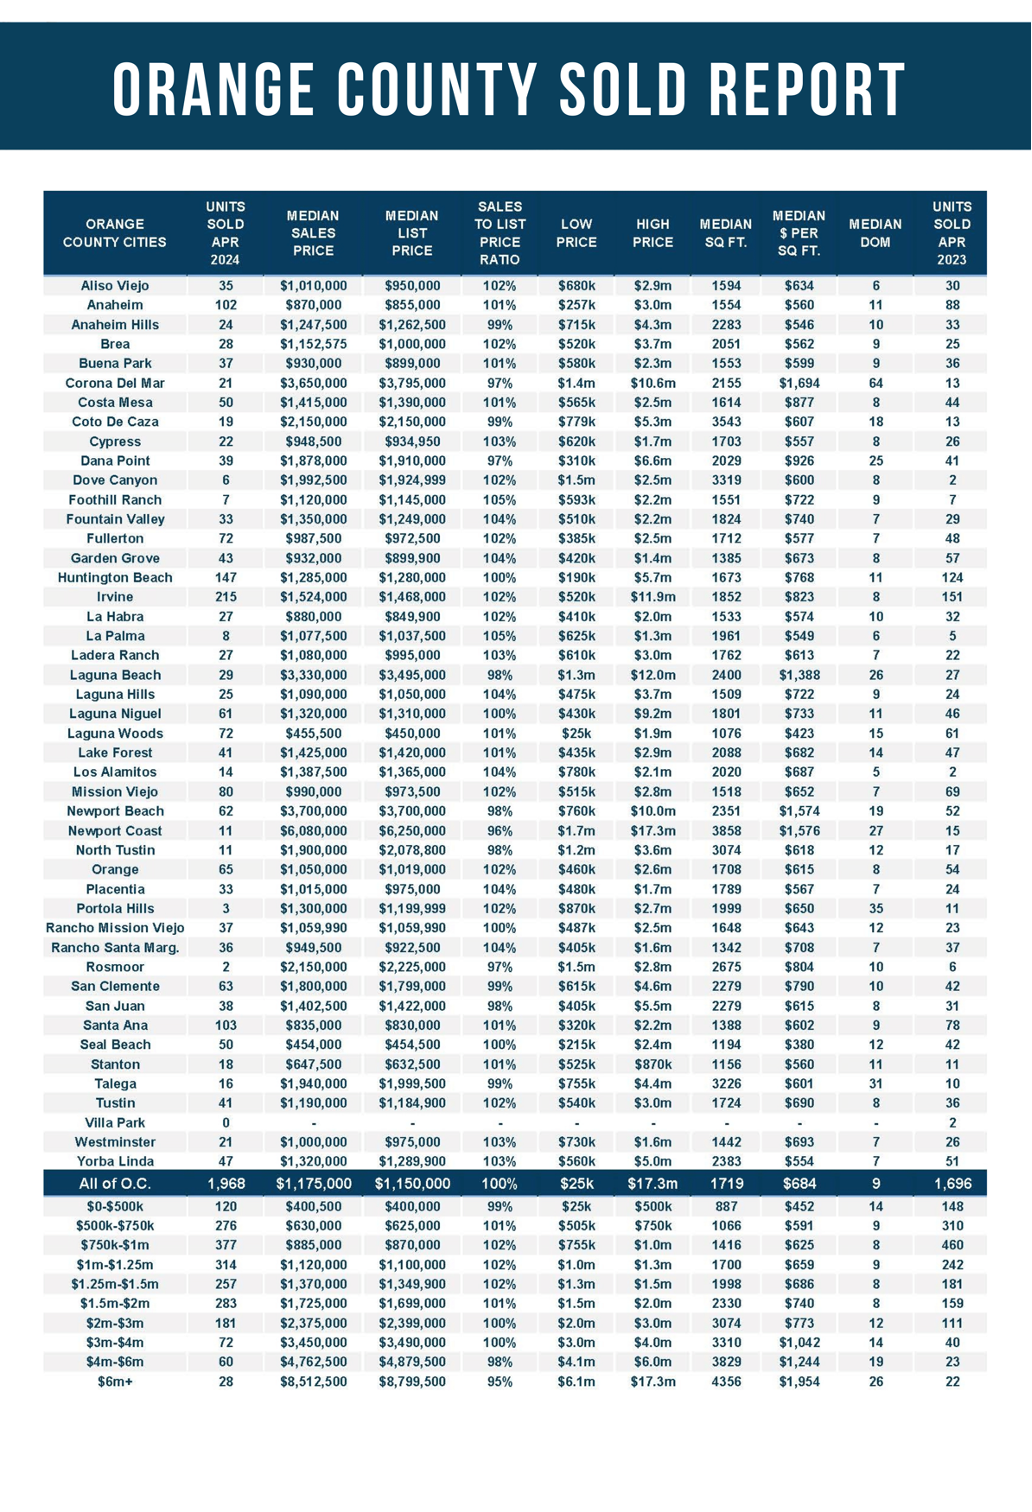
- There were 1,968 closed residential resales in April, up 16% compared to April 2023’s 1,696, and up 10% from March 2024. The sales-to-list price ratio was 100.4% for Orange County. Foreclosures accounted for 0.05% of all closed sales, and short sales accounted for 0.15%. That means that 99.8% of all sales were good ol’ fashioned sellers with equity.
Have a great week.
Sincerely,
Steven Thomas
Quantitative Economics and Decision Sciences
Copyright 2024—Steven Thomas, Reports On Housing—All Rights Reserved. This report may not be reproduced in whole or in part without express written permission from the author.