
February 17, 2022
HOUSING HAS ONLY GROWN HOTTER DESPITE MORTGAGE RATES RISING CONSIDERABLY SINCE RINGING IN A NEW YEAR, INDICATING IT WILL TAKE FURTHER CHANGES FOR THE MARKET TO SLOW.
Today’s society is accustomed to getting information immediately and from a variety of different sources. Nobody really has to wait for the 5:00 newscast or the morning paper to get the latest news. Everything now can be found on the web and on a smartphone in an instant. The Wall Street Journal, CNBC, MSNBC, FOX, CNN, CBS, ABC, BBC, and the countless millions of other websites allow everyone to be plugged into all the constant world changes. It is reported live 24 hours a day, seven days a week. When a bad earnings report for a company is announced… BOOM! The company stock drops in an instant. The Consumer Price Index (inflation) rises a lot higher than estimates… BOOM! The DOW, S&P 500, and NADAQ all plummet immediately. Yet, changes in the housing market are far from instant.
The transformation of the housing market occurs over time. It just does not change in the snap of a finger. Houses are not traded on Wall Street. They are not stocks that are easily bought and sold. Instead, they are homes, a place to rest, relax, and unwind, a place to start or raise a family. Everyone needs shelter and must live somewhere. It is understandable that in tracking housing, new trends slowly shift the tide and eventually reveal a change in the housing market.
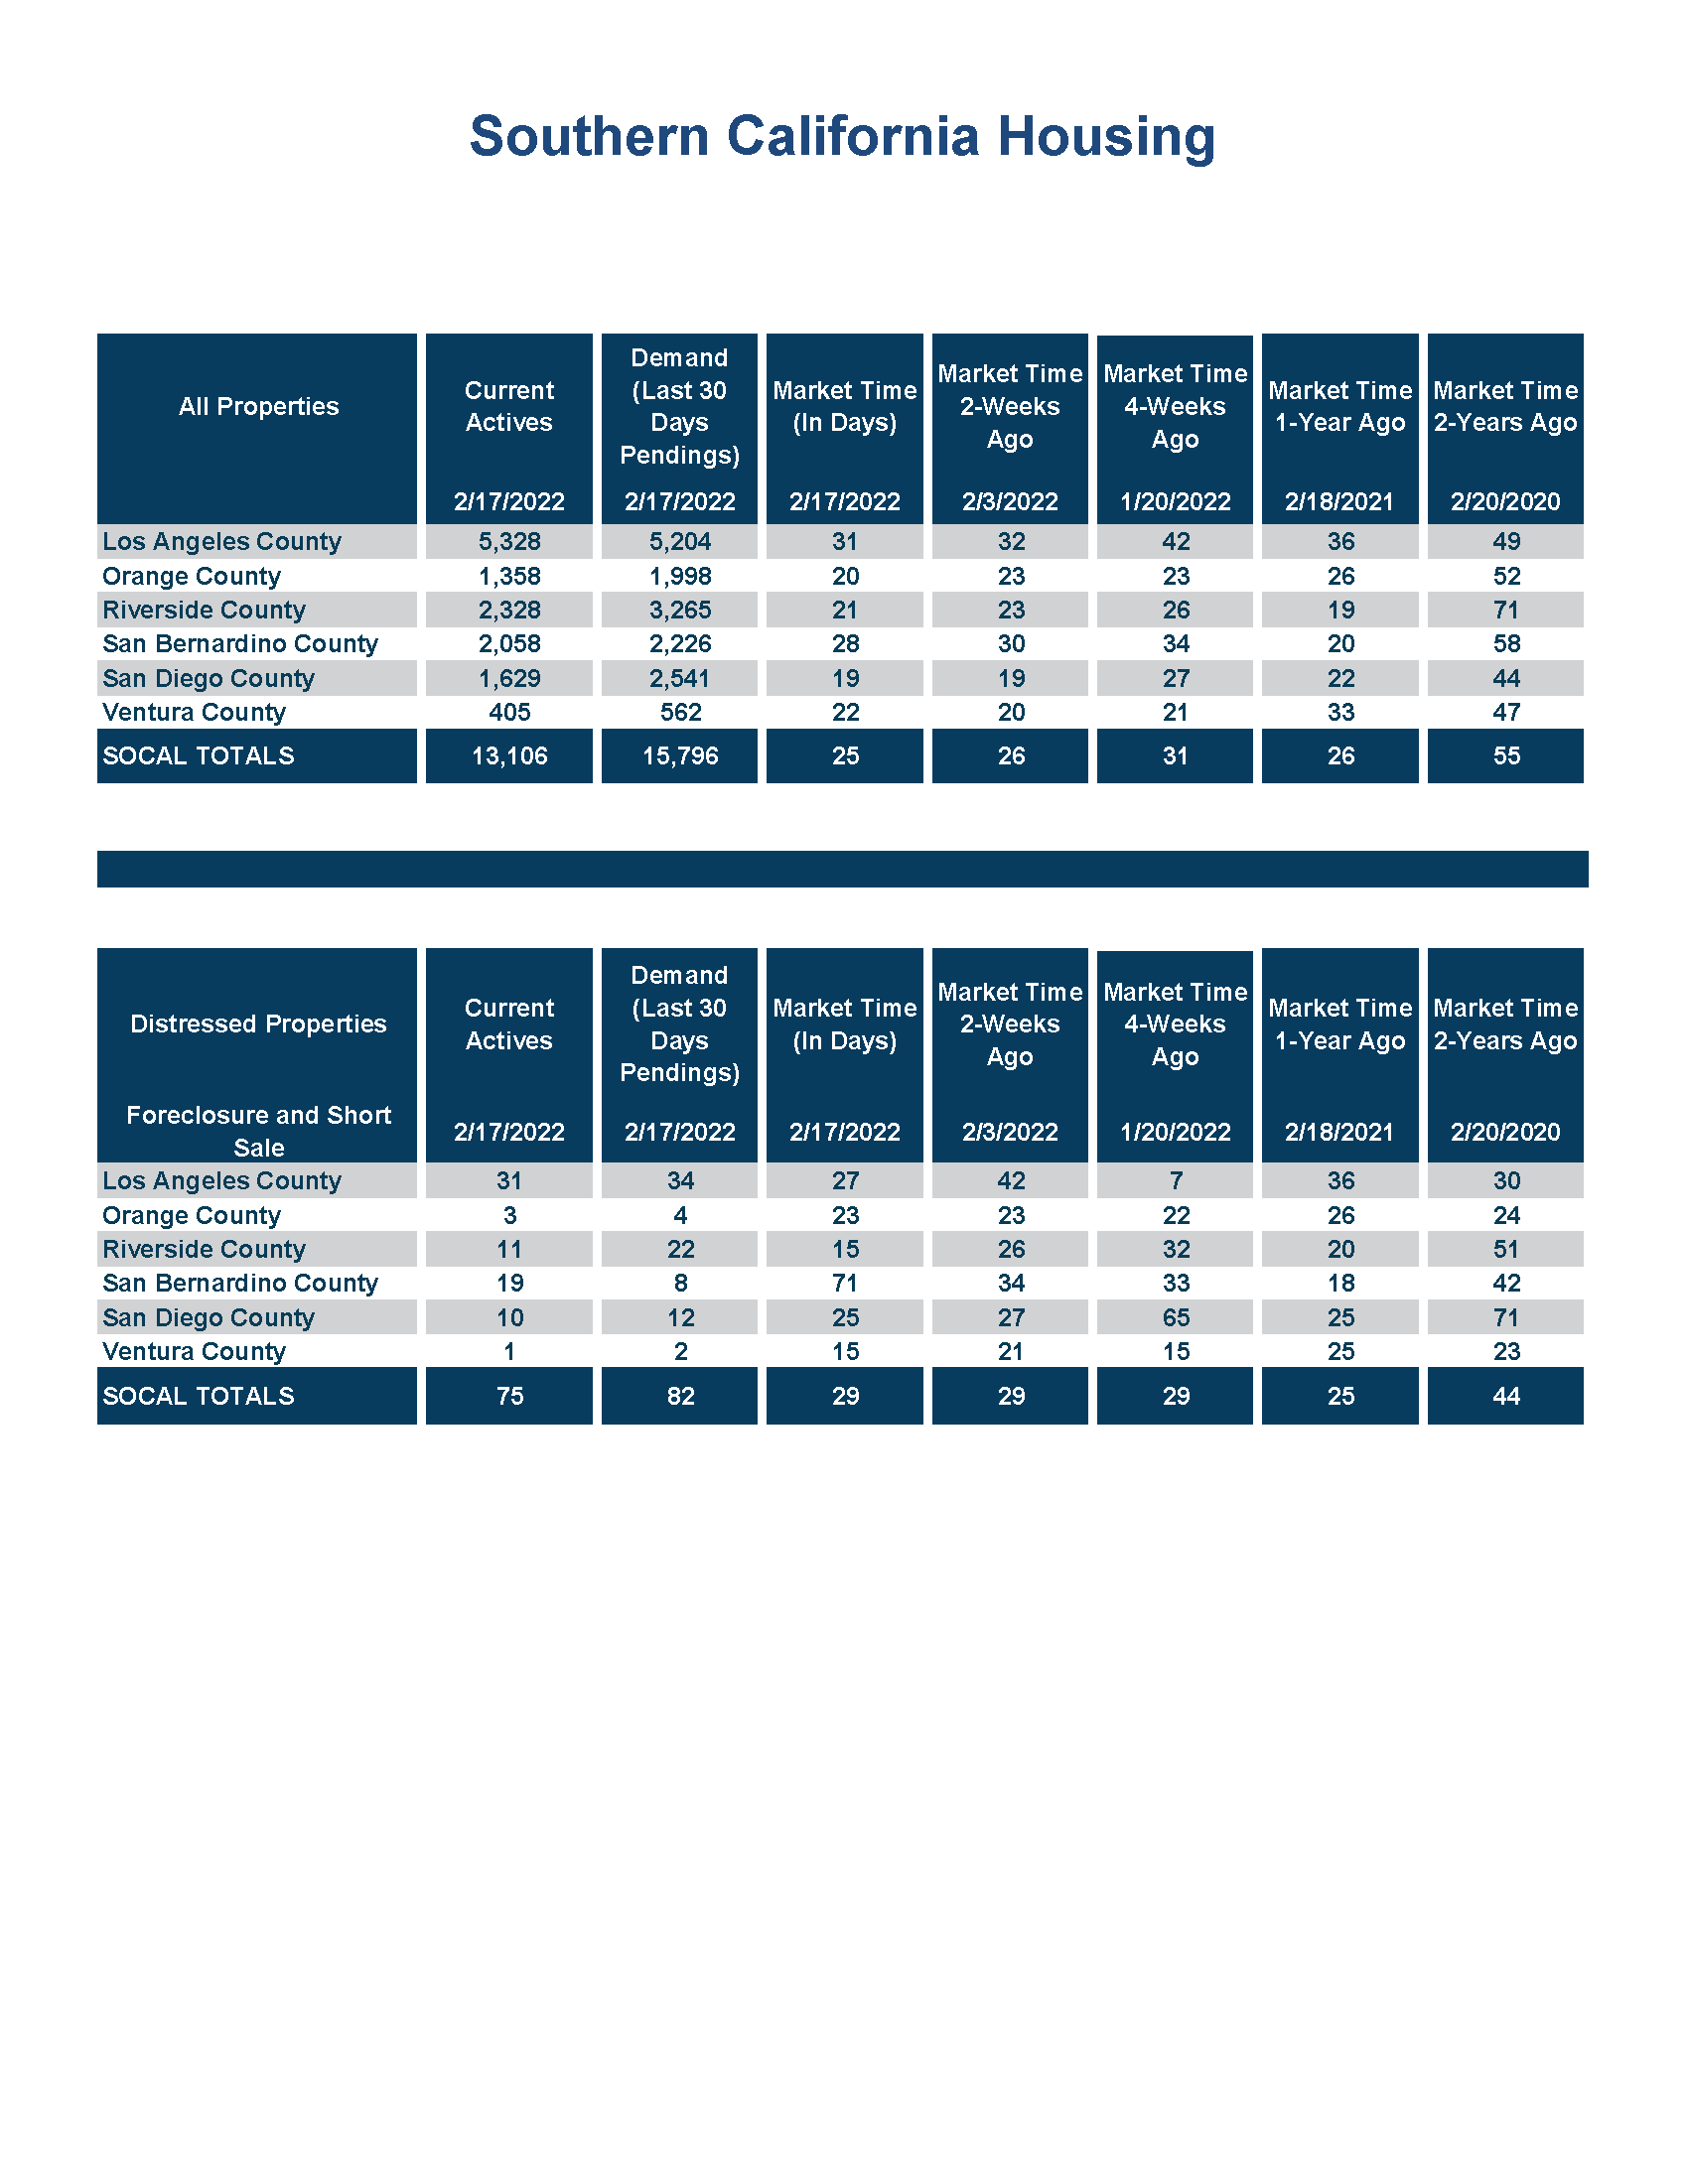
ORANGE COUNTY ACTIVE LISTING INVENTORY AND RATES 2013 VS 2021
A new trend has emerged this year, rising rates. According to Freddie Mac’s Primary Mortgage Market Survey®, 30-year fixed rates have risen from 3.05% on December 23rd to 3.92% on February 17th, nearly a full percent higher in only 8-short weeks. Yet, the market remains insanely, white hot. In fact, in the past two weeks, the Expected Market Time in Orange County (the time between pounding in the FOR-SALE sign to opening escrow) dropped from 23 to 20 days, matching levels reached in November and December of last year and the lowest level since tracking began 19 years ago. The market is growing hotter because that is what occurs during the Winter Market, when the inventory does not change much and demand surges. There are plenty of buyers bumping into each other at open houses and property showings, but there are very few homes currently available and not enough homeowners placing their homes on the market right now. More homes come on during the Spring Market, from mid-March through mid-June. Families prefer to place their home on the market during the spring, open escrow, and then close during the summer when the kids are out of school.
The trend in rising rates has occurred before and eventually led to a market change in 2013 when there was a very limited supply of available homes to purchase as well.
Similarly to today, the Expected Market Time dropped, and the market got hotter at the beginning of the year. It declined from 47 days in January to 33 days by mid-March. At the same time, mortgage rates rose from 3.34% to 3.63%, yet the market just got hotter. But, as more homeowners came on the market during the spring, the number of available homes began to rise substantially for the first time in nearly two years, growing from 3,183 in March to 4,423 by mid-June, adding 1,240 homes, up 39%. At the same time, mortgage rates had climbed to 3.93%. The inventory continued to grow through the Summer and Autumn Markets and did not peak until mid-October at 6,350 homes. A typical peak occurs during the summer between July and August. From March to October the number of available homes had soared from 3,183 to 6,350, almost doubling by adding 3,167 homes. The Expected Market Time slowed from 33 to 82 days, and mortgage rates had surpassed 4.5% in September before retreating to 4.23% by mid-October.
The fundamental trend of persistent rising rates from 3.34% at the start of 2013 to 4.5% in September, paved the way to a shift in the market from an Insane Seller’s Market to a Slight Seller’s Market. Demand downshifted due to enduring climbing rates. With a bit less demand, overpriced listings sat on the market and accumulated over time, allowing for the inventory of available homes to rise. With a rising supply and muted demand, the overall speed of the market slowed, and Expected Market Times climbed.
For the market in 2022 to experience a similar shift. Mortgage rates cannot substantially drop from here. They must persist at these higher levels, between 3.75% and 4%, and then eventually climb above 4% with staying power. If that occurs, as more homes come on the market during the spring and summer, demand will be muted, and the inventory will substantially climb for the first time in 3-years. Higher rates must endure for that to occur.
Last year mortgage rates started the year at 2.65% and had climbed to 3.18% by April 1st, up a little over a half a percent. The rise was short lived as mortgage rates dropped back down to 3% by the end of April, and to 2.77% in August. Rising rates did not persist and the Insanely Hot Seller’s Market could not be stopped.
The Orange County housing market has been below 40-days since August 2020. At these levels there are a ton of showings, sellers get to call all the shots during the negotiating process, multiple offers are the norm, and home values are rising rapidly. At this point, only higher rates can slow the housing freight train that has been barreling down the tracks for nearly two years.

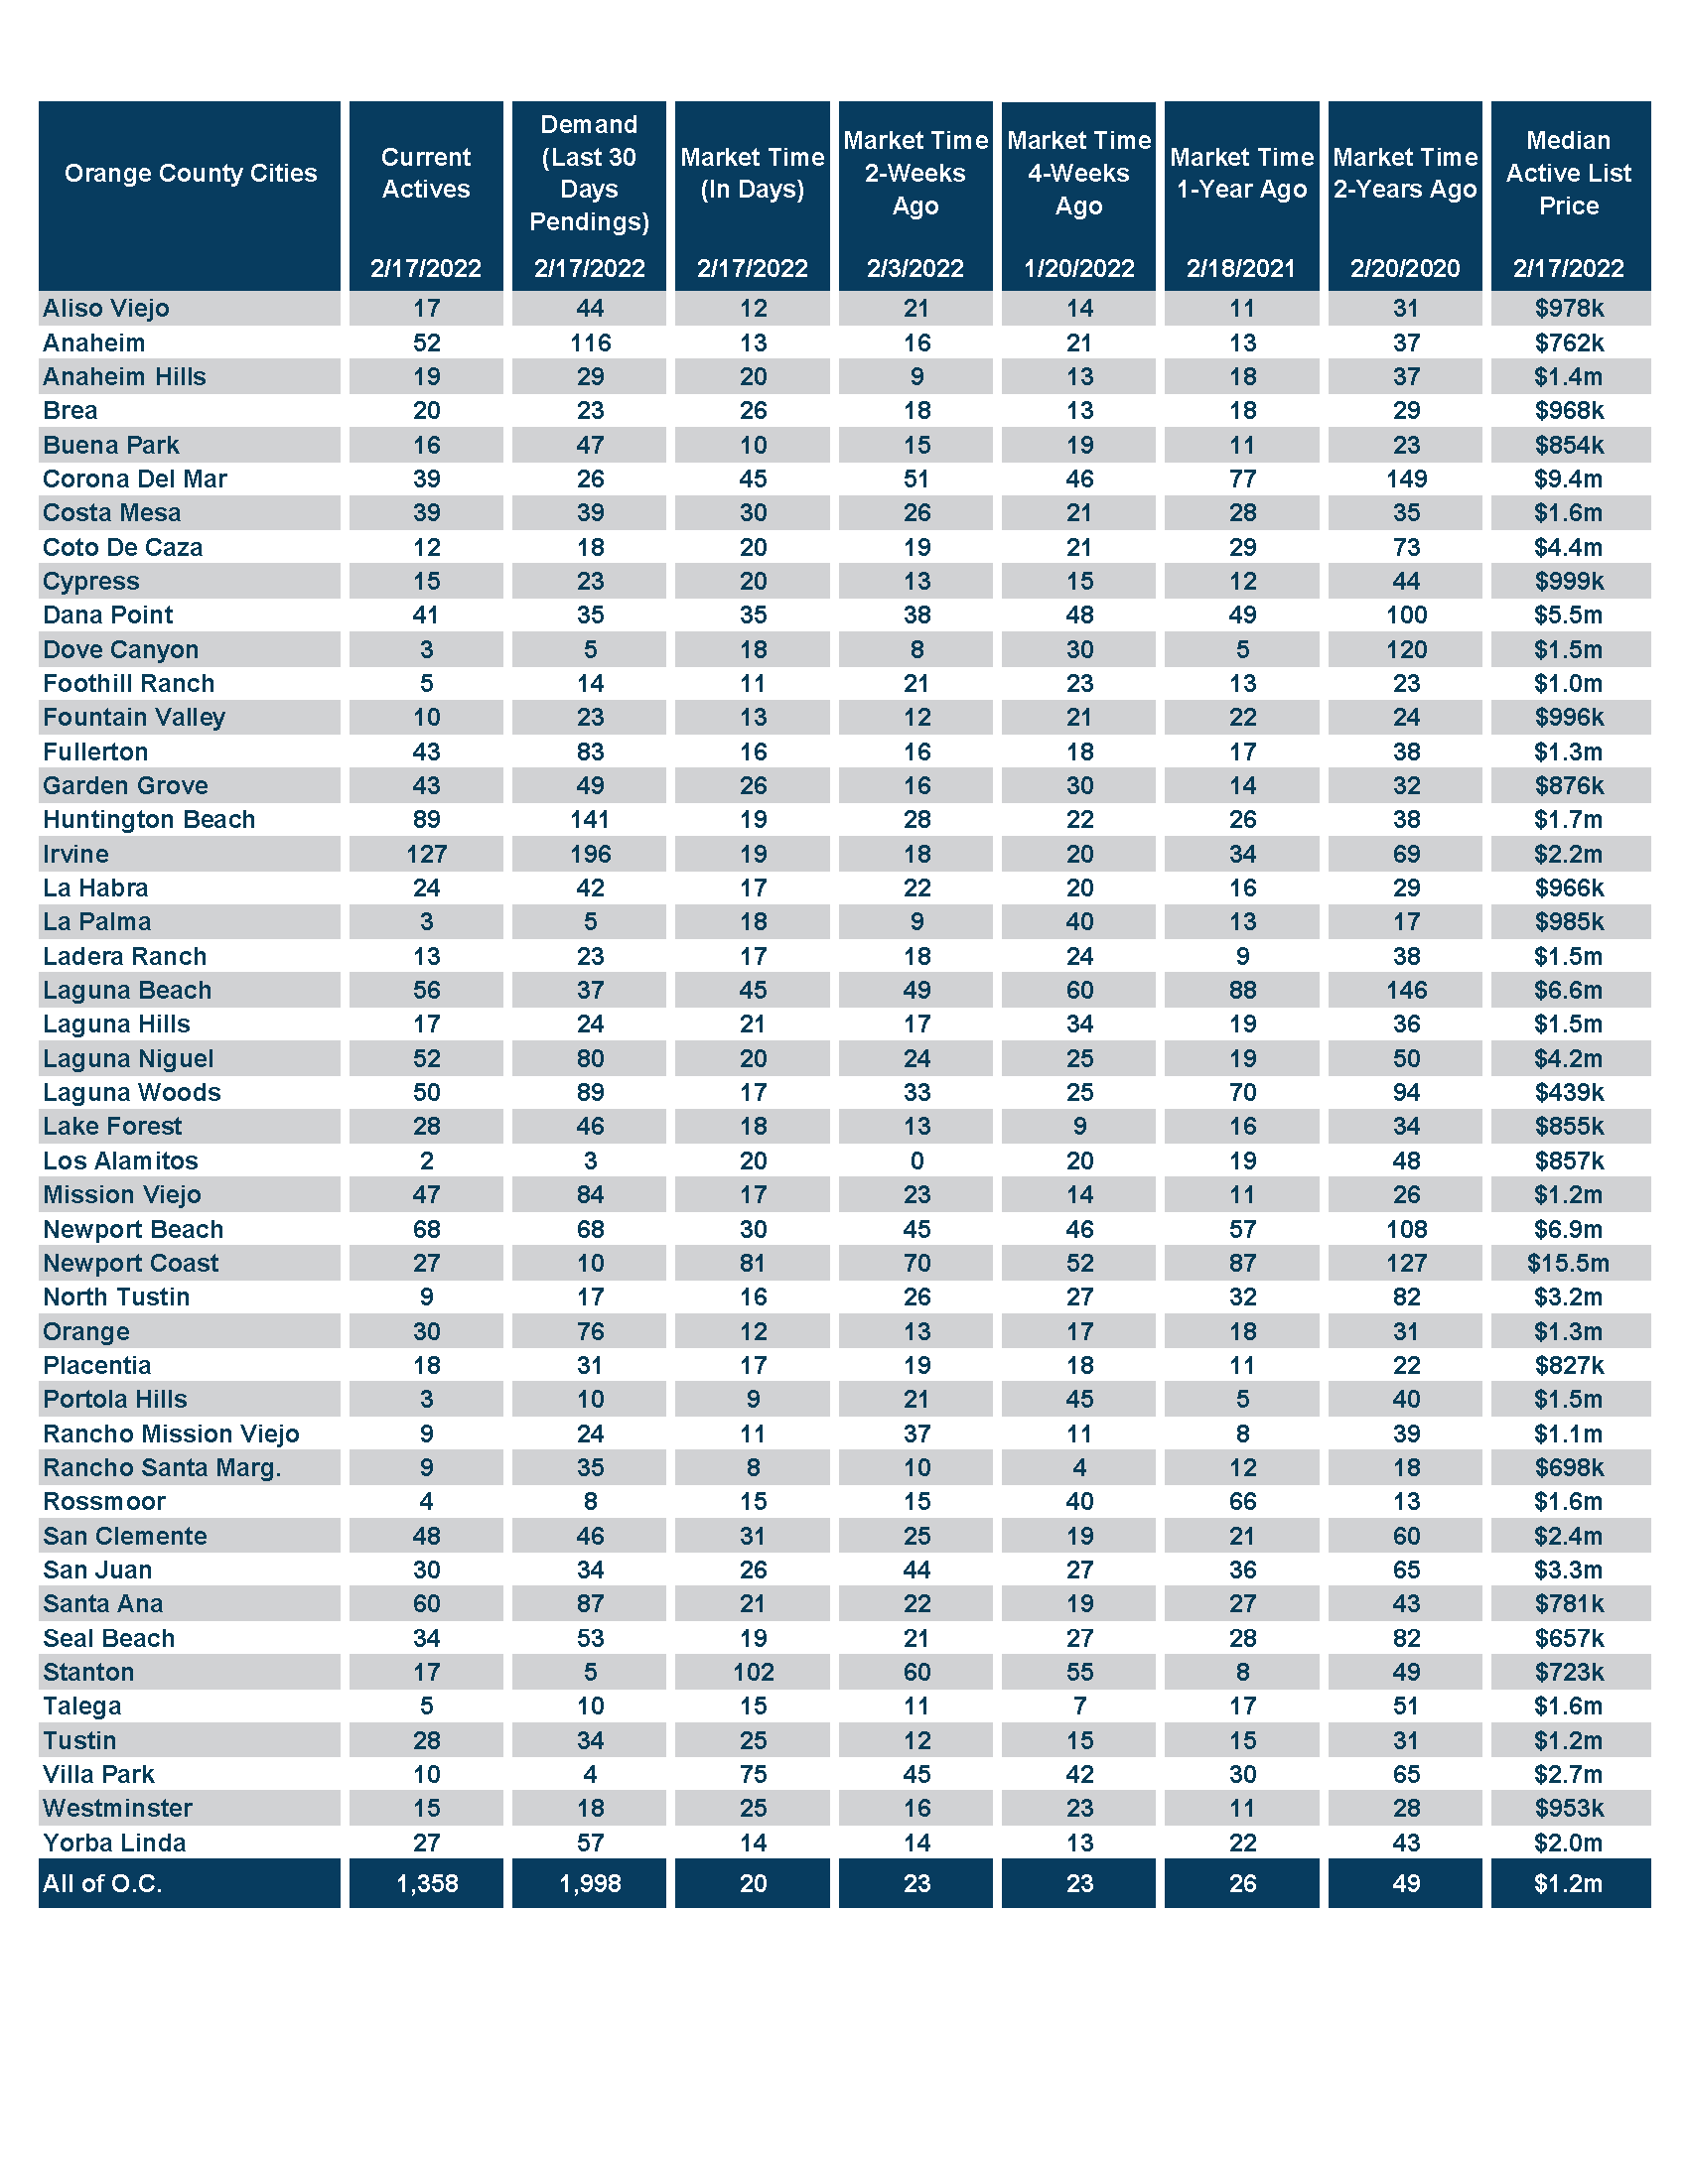
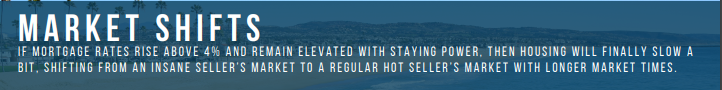
The active listing inventory increased by 88 homes in the past couple of weeks, up 7%, and now sits at 1,358 homes. It is the Winter Market. Cyclically, that is when very few homes come on the market because it just is not the most favorable time for a family to make a move, during the middle of the school year. That all changes in the spring, but that is still another month from now. Until then, get used to very few new homes entering the fray. Plus, this year is even worse. In January, there were 703 fewer new FOR SALE signs compared to the 3-year average before COVID (2017 to 2019), or 23% less. For the first two weeks of February, there were 20% fewer signs. The trend of fewer and fewer homes coming on the market is just magnifying the inventory crisis. Buyers are already sitting on the sidelines waiting for the next new listings to arrive on the housing scene. When there are buyers waiting in the wings, most homes coming on obtain offers in less than a week and are slapped into escrow almost immediately. It is like a revolving door, making it extremely difficult for the inventory to grow.
Last year, the inventory was at 2,438, 80% more, or an additional 1,080 homes. The biggest complaint last year was that there were not enough homes on the market, yet there were more homes available compared to today. The 3-year average prior to COVID (2017 through 2019) is 4,977, an extra 3,619 homes, or 267% more, three-an-a-half times more than today. There were a lot more choices back then.
ORANGE COUNTY ACTIIVE LIISTIING IINVENTORY
YEAR-OVER-YEAR ((2019-2022))

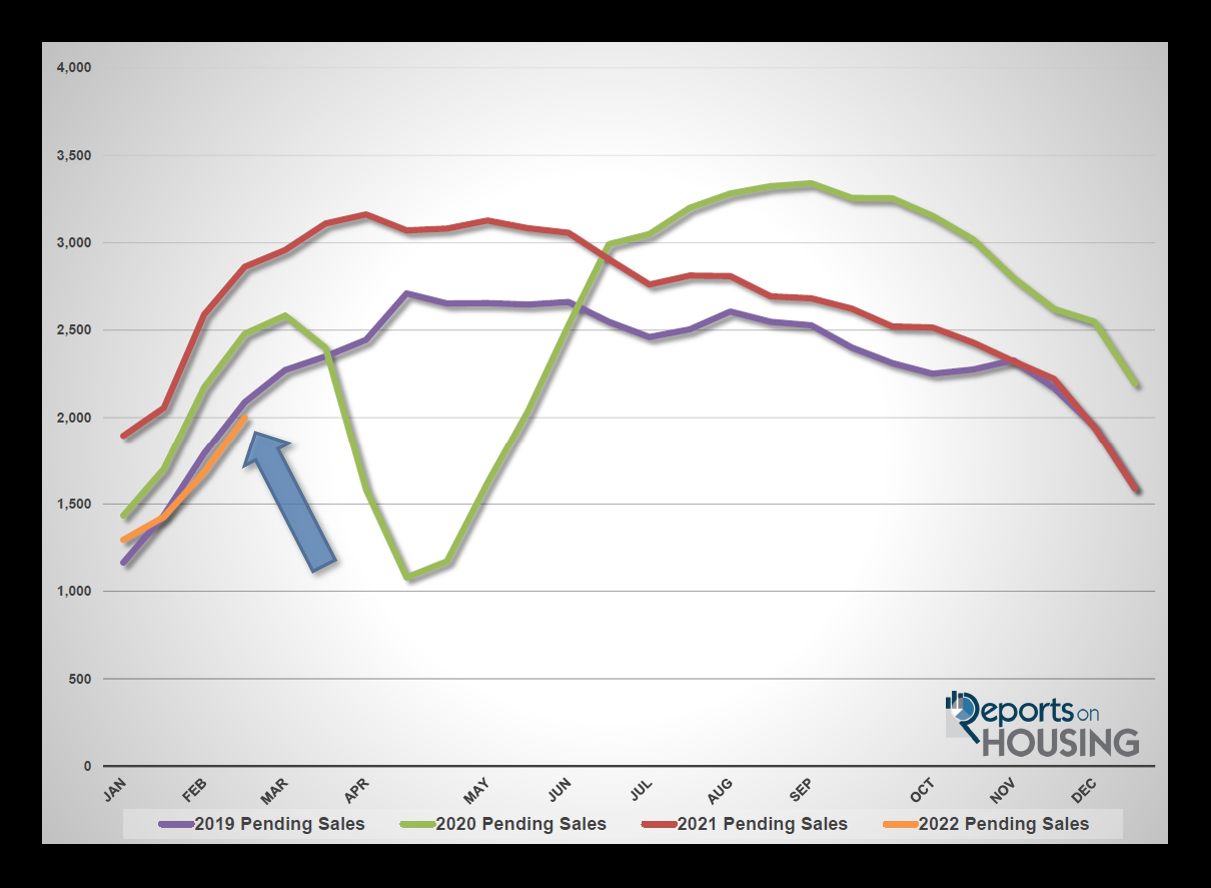
Demand, a snapshot of the number of new escrows over the prior month, increased from 1,683 to 1,998 in the past couple of weeks, adding 315 pending sales, up 19% and the largest gain so far in 2022. Yet, the current demand level is the lowest reading for this time of the year since 2008. The lack of available homes combined with fewer homes coming on the market is taking a significant bite out of today’s demand readings. Expect demand to continue to rise, but at a slightly slower pace until it peaks sometime between mid-April to the end of May. Lower demand will translate to fewer closed sales compared to last year as well until the trend of fewer new listings subsides. Only time will tell when that will be.
Last year, demand was at 2,863, 43% more than today, or an extra 865. Year over year comparisons will be off through the rest of this month due to market changes because of COVID. A much better comparison is looking at the 3-year average prior to COVID (2017 to 2019), which was 2,393 pending sales, 20% more than today. In Orange County, current demand readings have obviously been muted by a lack of available homes and not enough coming on the market.
ORANGE COUNTY DEMAND YEAR-OVER-YEAR ((2018-2021 ))
PRIIOR 30 DAYS PENDIINGS SNAPSHOT
With demand surging compared to the smaller rise in the inventory, the Expected Market Time (the number of days to sell all Orange County listings at the current buying pace) dropped from 23 to 20 days, tying the lowest level ever reached since tracking began 19 years ago in both November and December of last year. At 20 days, it is an insane, Hot Seller’s Market (less than 60 days) where there are a ton of showings, sellers get to call the shots during the negotiating process, multiple offers are the norm, and home values are rising rapidly. Last year the Expected Market Time was at 26 days, similar to today. The 3-year average prior to COVID was at 64 days, substantially slower than today and a Slight Seller’s Market (between 60 and 90 days).

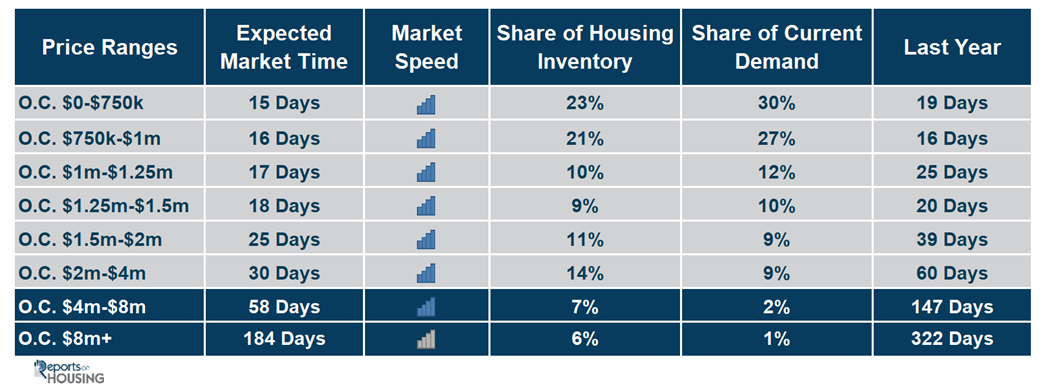
The luxury market in Orange County has continued to surge. In fact, luxury demand of homes priced above $2 million in the past couple of weeks increased by 27 pending sales, up 12%, and now sits at 244. The luxury inventory of homes priced above $2 million decreased by 19 homes, down 5%, and now sits at 363. With supply dropping and demand surging, the overall Expected Market Time for luxury homes priced above $2 million decreased from 53 to 45 days, an extremely hot market for luxury.
Year over year, luxury demand is down by 29 pending sales or 11%, and the active luxury listing inventory is down by 360 homes or 50%. The Expected Market Time last year was at 79 days, exceptionally hot for luxury, but slower than today, indicating just how unbelievably hot the luxury market is right now.
For homes priced between $2 million and $4 million, the Expected Market in the past two weeks decreased from 34 to 30 days. For homes priced between $4 million and $8 million, the Expected Market Time decreased from 79 to 58 days. For homes priced above $8 million, the Expected Market Time decreased from 219 to 184 days. At 184 days, a seller would be looking at placing their home into escrow around August 2022.

- The active listing inventory increased by 88 homes, up 7%, and now totals 1,358 homes, its lowest level for this time of the year since tracking began 19 years ago. In January, there were 23% fewer homes that came on the market compared to the 3-year average prior to COVID (2017 to 2019), 709 fewer. Last year, there were 2,438 homes on the market, 1,080 additional homes, or 80% more.
- Demand, the number of pending sales over the prior month, surged by 315 pending sales in the past two weeks, up 19%, and now totals 1,998. Last year, there were 2,863 pending sales, 43% more than today due to the impact of COVID on housing. The 3-year average prior to COVID (2017 to 2019) was 2,393, or 20% more.
- With demand surging compared to the smaller rise in the inventory, the Expected Market Time, the number of days to sell all Orange County listings at the current buying pace, dropped from 23 to 20 days in the past couple of weeks, an insanely Hot Seller’s Market (less than 60 days). 20 days ties the lowest reading since tracking began 19 years ago, which was also reached in November and December 2021. It was at 26 days in mid-February last year, similar to today.
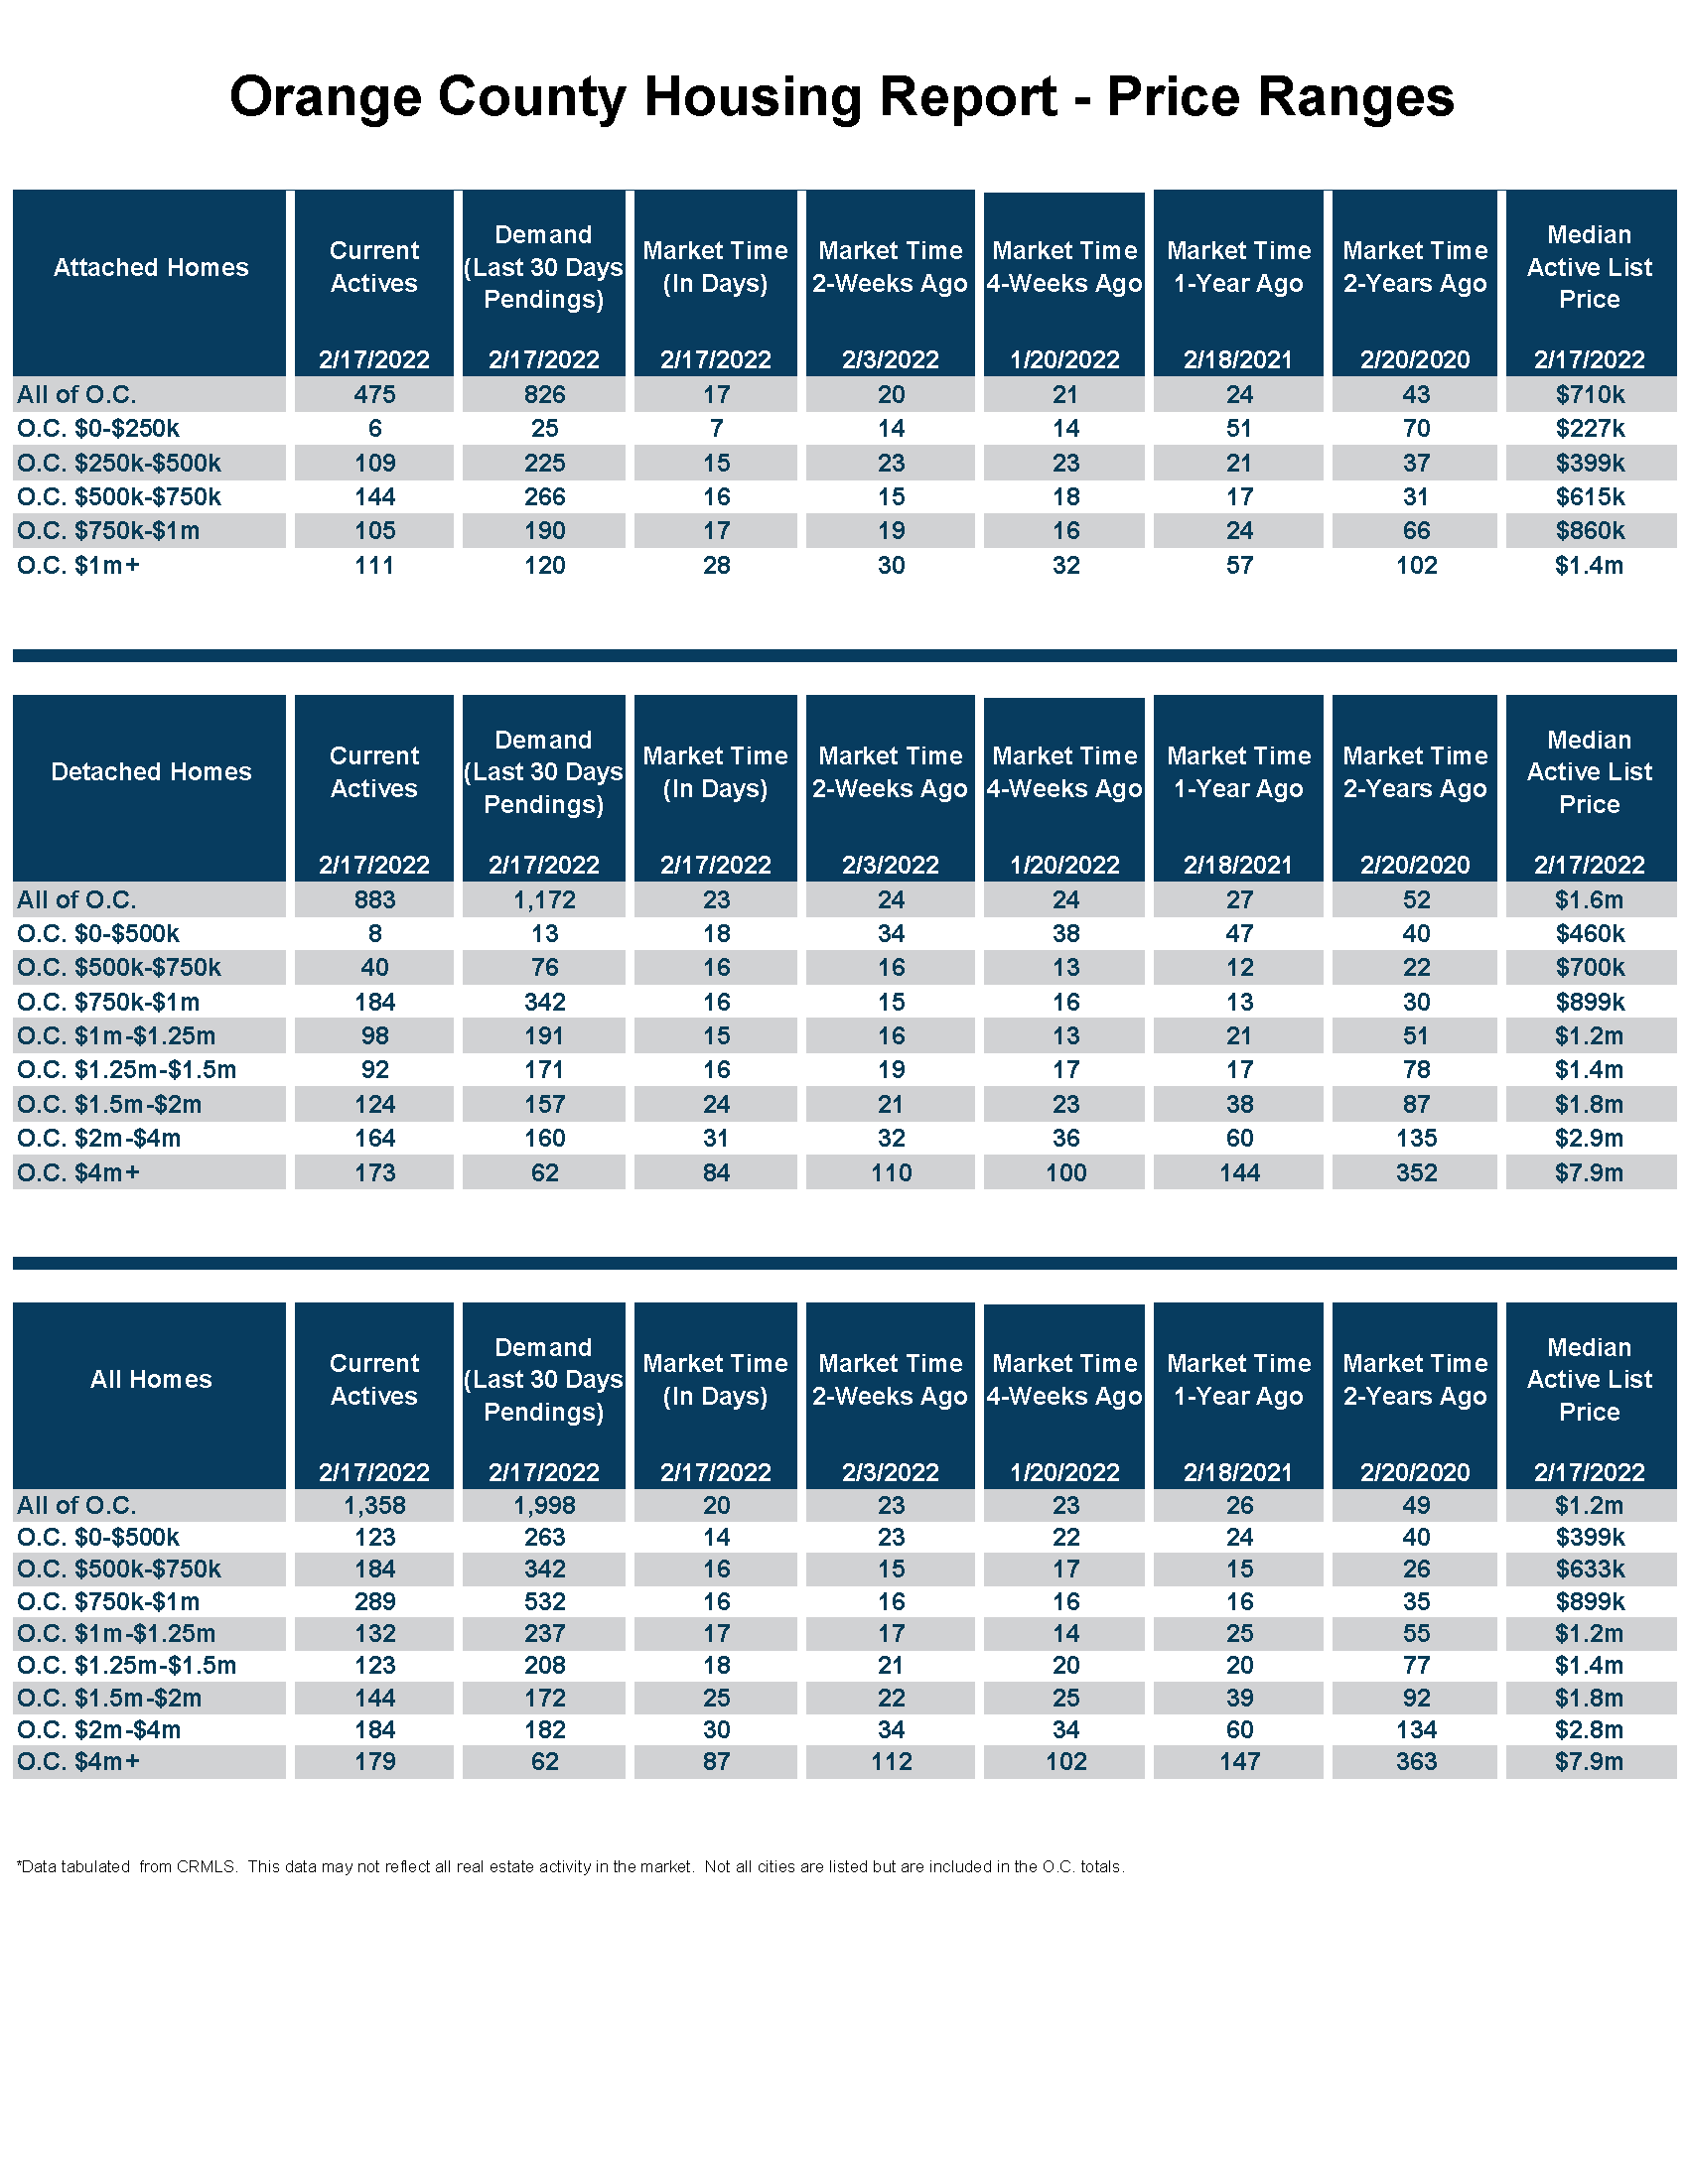
- For homes priced below $750,000, the market is a Hot Seller’s Market (less than 60 days) with an Expected Market Time of 15 days. This range represents 23% of the active inventory and 30% of demand.
- For homes priced between $750,000 and $1 million, the Expected Market Time is 16 days, a Hot Seller’s Market. This range represents 21% of the active inventory and 27% of demand.
- For homes priced between $1 million to $1.25 million, the Expected Market Time is 17 days, a Hot Seller’s Market. This range represents 10% of the active inventory and 12% of demand.
- For homes priced between $1.25 million to $1.5 million, the Expected Market Time is 18 days, a Hot Seller’s Market. This range represents 9% of the active inventory and 10% of demand.
- For homes priced between $1.5 million to $2 million, the Expected Market Time is 25 days, a Hot Seller’s Market. This range represents 11% of the active inventory and 9% of demand.
- For homes priced between $2 million and $4 million, the Expected Market in the past two weeks decreased from 34 to 30 days. For homes priced between $4 million and $8 million, the Expected Market Time decreased from 79 to 58 days. For homes priced above $8 million, the Expected Market Time decreased from 219 to 184 days.
- The luxury end, all homes above $2 million, accounts for 27% of the inventory and 12% of demand.
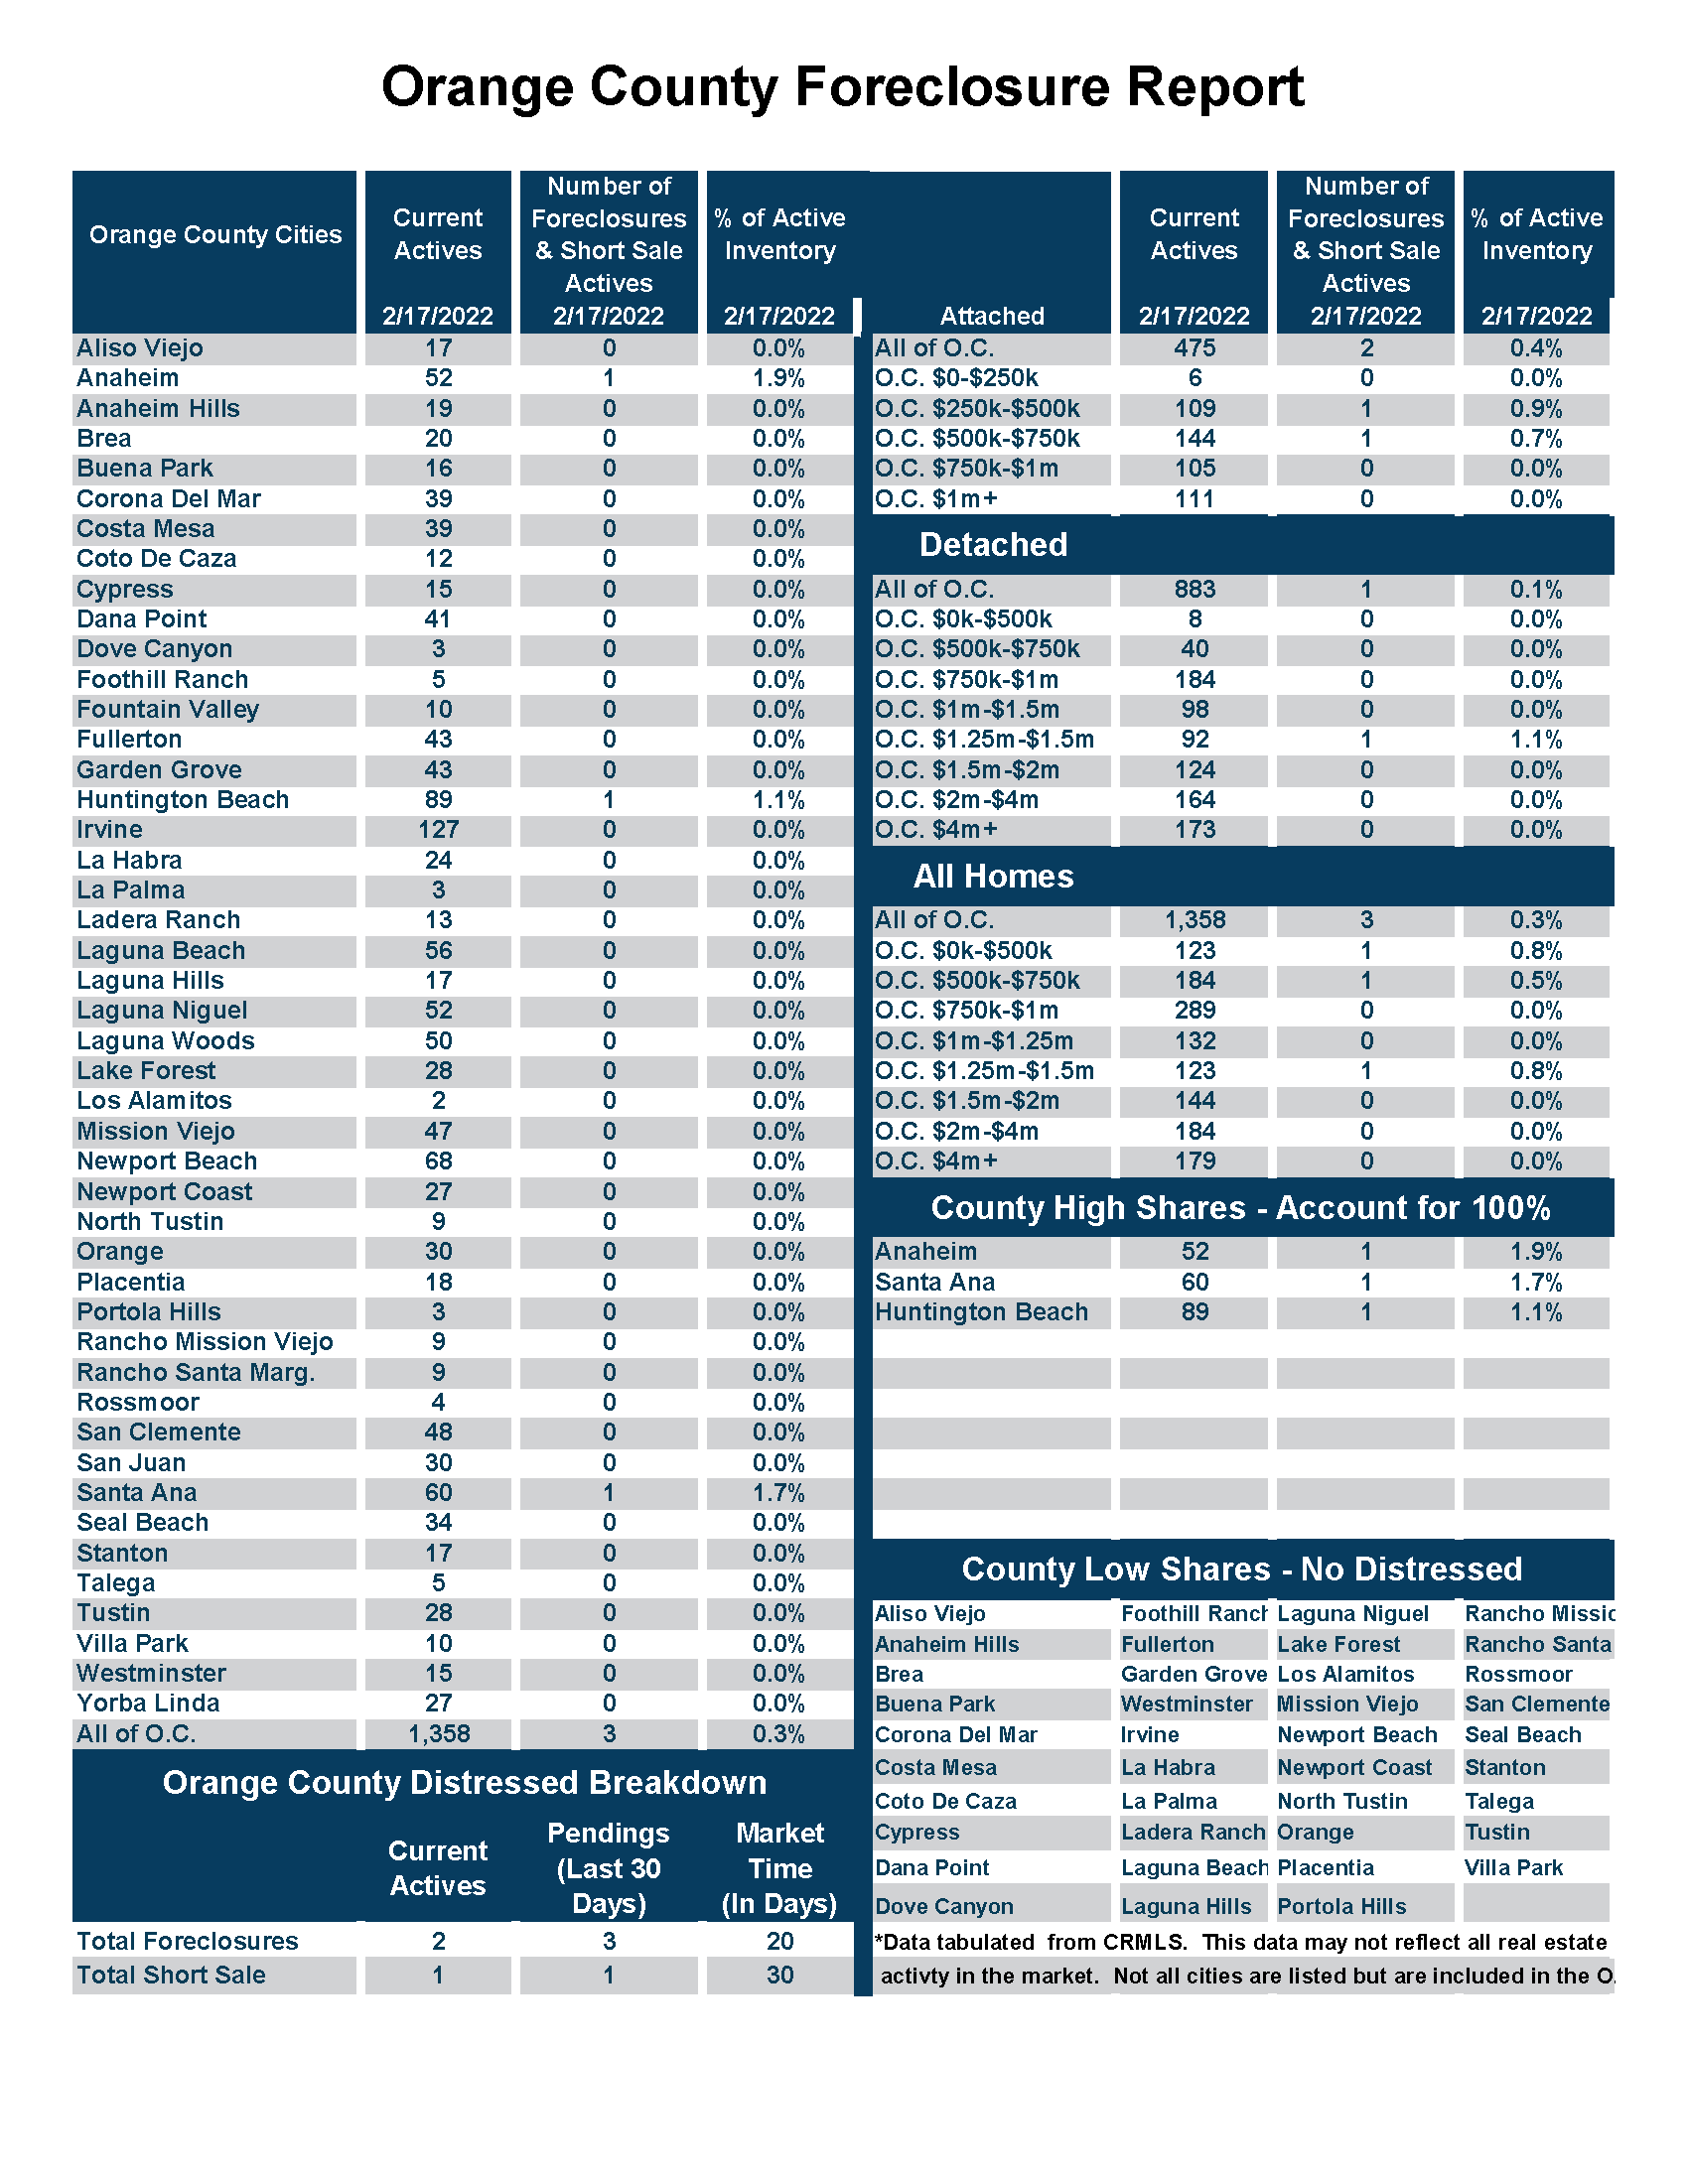
- Distressed homes, both short sales and foreclosures combined, made up only 0.2% of all listings and 0.2% of demand. There are only 2 foreclosure and 1 short sale available to purchase today in all of Orange County, 3 total distressed homes on the active market, unchanged from two weeks ago. Last year there were 6 total distressed homes on the market, similar to today.
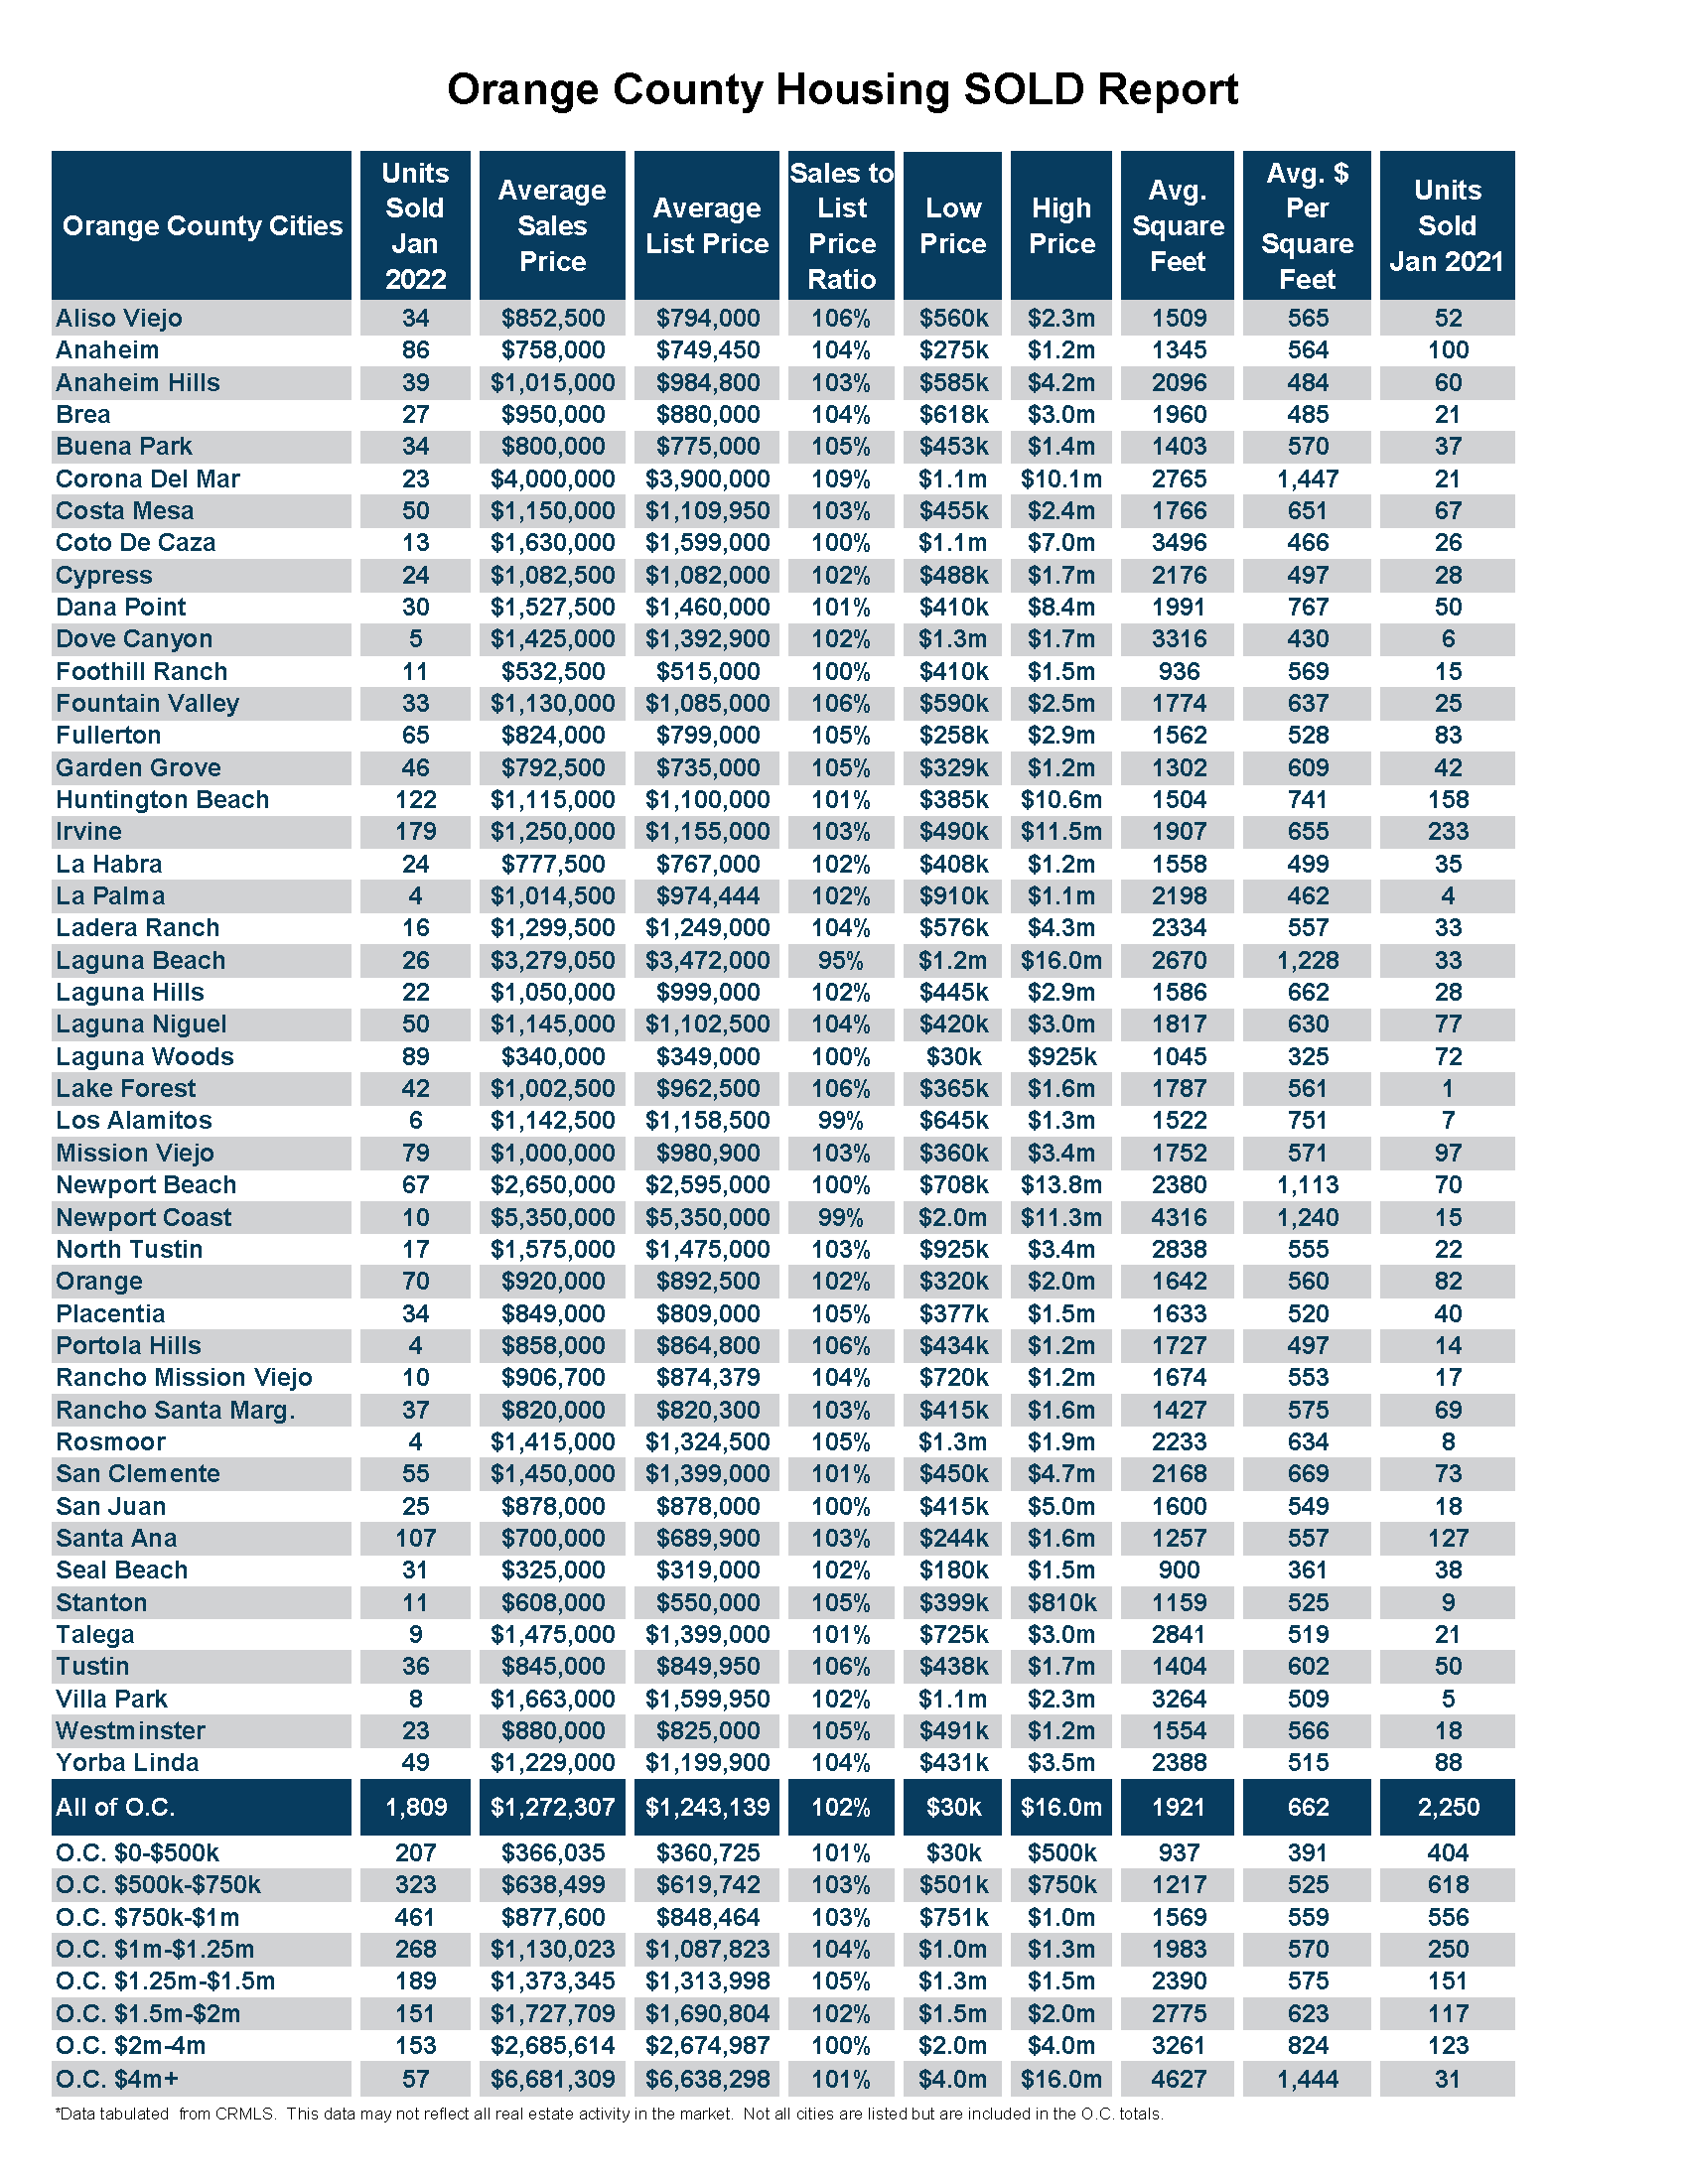
- There were 1,811 closed residential resales in January, 20% less than January 2021’s 2,250 closed sales. January marked a 27% drop compared to December 2021. The sales to list price ratio was 102.3% for all of Orange County. Foreclosures accounted for just 0.3% of all closed sales, and there were no closed short sales. That means that 99.7% of all sales were good ol’ fashioned sellers with equity.
Have a great week.
Sincerely,
Steven Thomas
Quantitative Economics and Decision Sciences
Copyright 2022- Steven Thomas, Reports On Housing – All Rights Reserved. This report may not be reproduced in whole or part without express written permission by author.