January 6, 2022
The COVID-19 pandemic has severely disrupted the supply of goods and commodities. Initially, back in March 2020, there was a relentless run on toilet paper when people stood in long lines for hours as new shipments arrived. As the pandemic evolved, so did the impact on the supply of computer chips, which ultimately hit the automobile industry the hardest. Flash forward to today and new car lots are empty, there is a COVID premium on the sticker price, and many must wait weeks or months for delivery. It is just as challenging to obtain a used car and prices have gone through the roof. It boils down to supply and demand. Even when demand levels do not change much, yet inventories drop substantially, prices soar.
That is precisely what is occurring in the Orange County housing market today. The supply of homes available to purchase today is at a staggering, mind blowing, record low level, and it is matched with strong demand that is not much different than prior to the pandemic. As a result, the market has been white hot, insane, from day one of 2022. It is an unprecedented start to the year that is without comparison. On January 3, 2013, according to the Primary Mortgage Market Survey conducted by Freddie Mac for the past 51-years, mortgage rates were at 3.34%, slightly higher than the record low, at the time, of 3.31% achieved on November 21, 2012. On January 7, 2021, mortgage rates hit a 17th record low since the start of the pandemic, dropping to 2.65%. That rate remains the record today, a year later. On January 6, 2022, mortgage rates had risen to 3.22%, the highest level since May 2020. Even with higher, rising mortgage rates, the housing market already has exceptionally strong momentum.
As the inventory dropped, housing has grown hotter and hotter. Today, there are only 1,100 homes available to purchase, an unmatched, ultra-low supply of homes that shattered the prior record low achieved in January 2021, at 2,633 homes. Last year’s start crushed the 2013 record start of 3,161 homes. The active inventory had been dropping prior to COVID, but the pandemic further disrupted housing and intensified the inventory crisis. The crisis had evolved into a catastrophe by the end of 2021 as the fewest number of homes come on the market in December and the second fewest occurs in November. That set up the unprecedented start to this year.
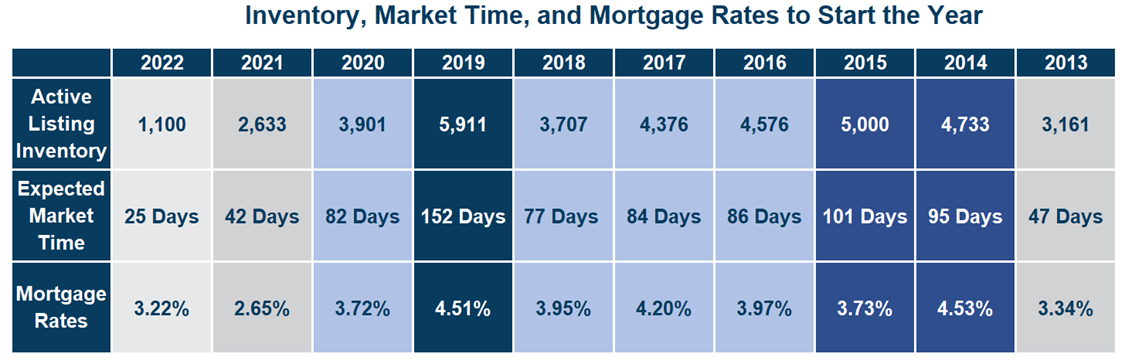
When the inventory is this low, just about everything that is placed on the market is thrown into escrow after being exposed to the marketplace for less than a week. As a result, the Expected Market Time (the time between hammering in the FOR-SALE sign to opening escrow) started this year at 25 days, shattering last year’s record 42-day start. At 42 days, Orange County housing is a Hot Seller’s Market (less than 60 days). At 25 days, it is an Insane Seller’s Market (less than 40 days) where buyers trip over each other to see every home that enters the fray, sellers call the shots, multiple offers and bidding wars are the norm, and home values are skyrocketing. As the market time reaches lower and lower levels, falling further below the 40 day “insanity” mark, there are more showing, more multiple offers, and higher sales prices. With nearly nothing on the market, home values are soaring, and today’s higher mortgage rates are not deterring buyers from purchasing.
ATTENTION BUYERS: Waiting for the market to get easier for buyers is not the answer. Home values are on the rise and mortgage rates have been on the rise as well. Values are slated to climb between 8 to 10% in Orange County, and mortgage rates could reach or even exceed 3.5%. With rising values and higher rates, payments increase, and home affordability will slowly erode. For buyers, waiting is not an option. Instead, buyers should pursue a purchase with patience and a steadfast determination. It may take 30 offers to hit paydirt. But it is that kind of persistence that is ultimately rewarded with success.
ATTENTION SELLERS: Take advantage of the hot market by pricing a home as close to the last comparable or pending sale. Carefully pricing will allow a seller to tap into the throngs of buyers waiting for every home that hits the market. A realistic price will allow a seller to attract a ton of offers. The bidding war that follows will allow a seller to obtain a very high sales price, typically selling for a lot higher than the asking price. Sellers who stretch the asking price too much and grossly overprice will result in wasted market time and less activity as the price is adjusted down the road. In this market, it is best to take advantage of the enormous buyer pool carefully watching and waiting for every new home that matches their search. Longer market times due to overpricing could result in fewer showings and fewer offers.
Active Listings
The current active inventory grew by 3% in the past two weeks.
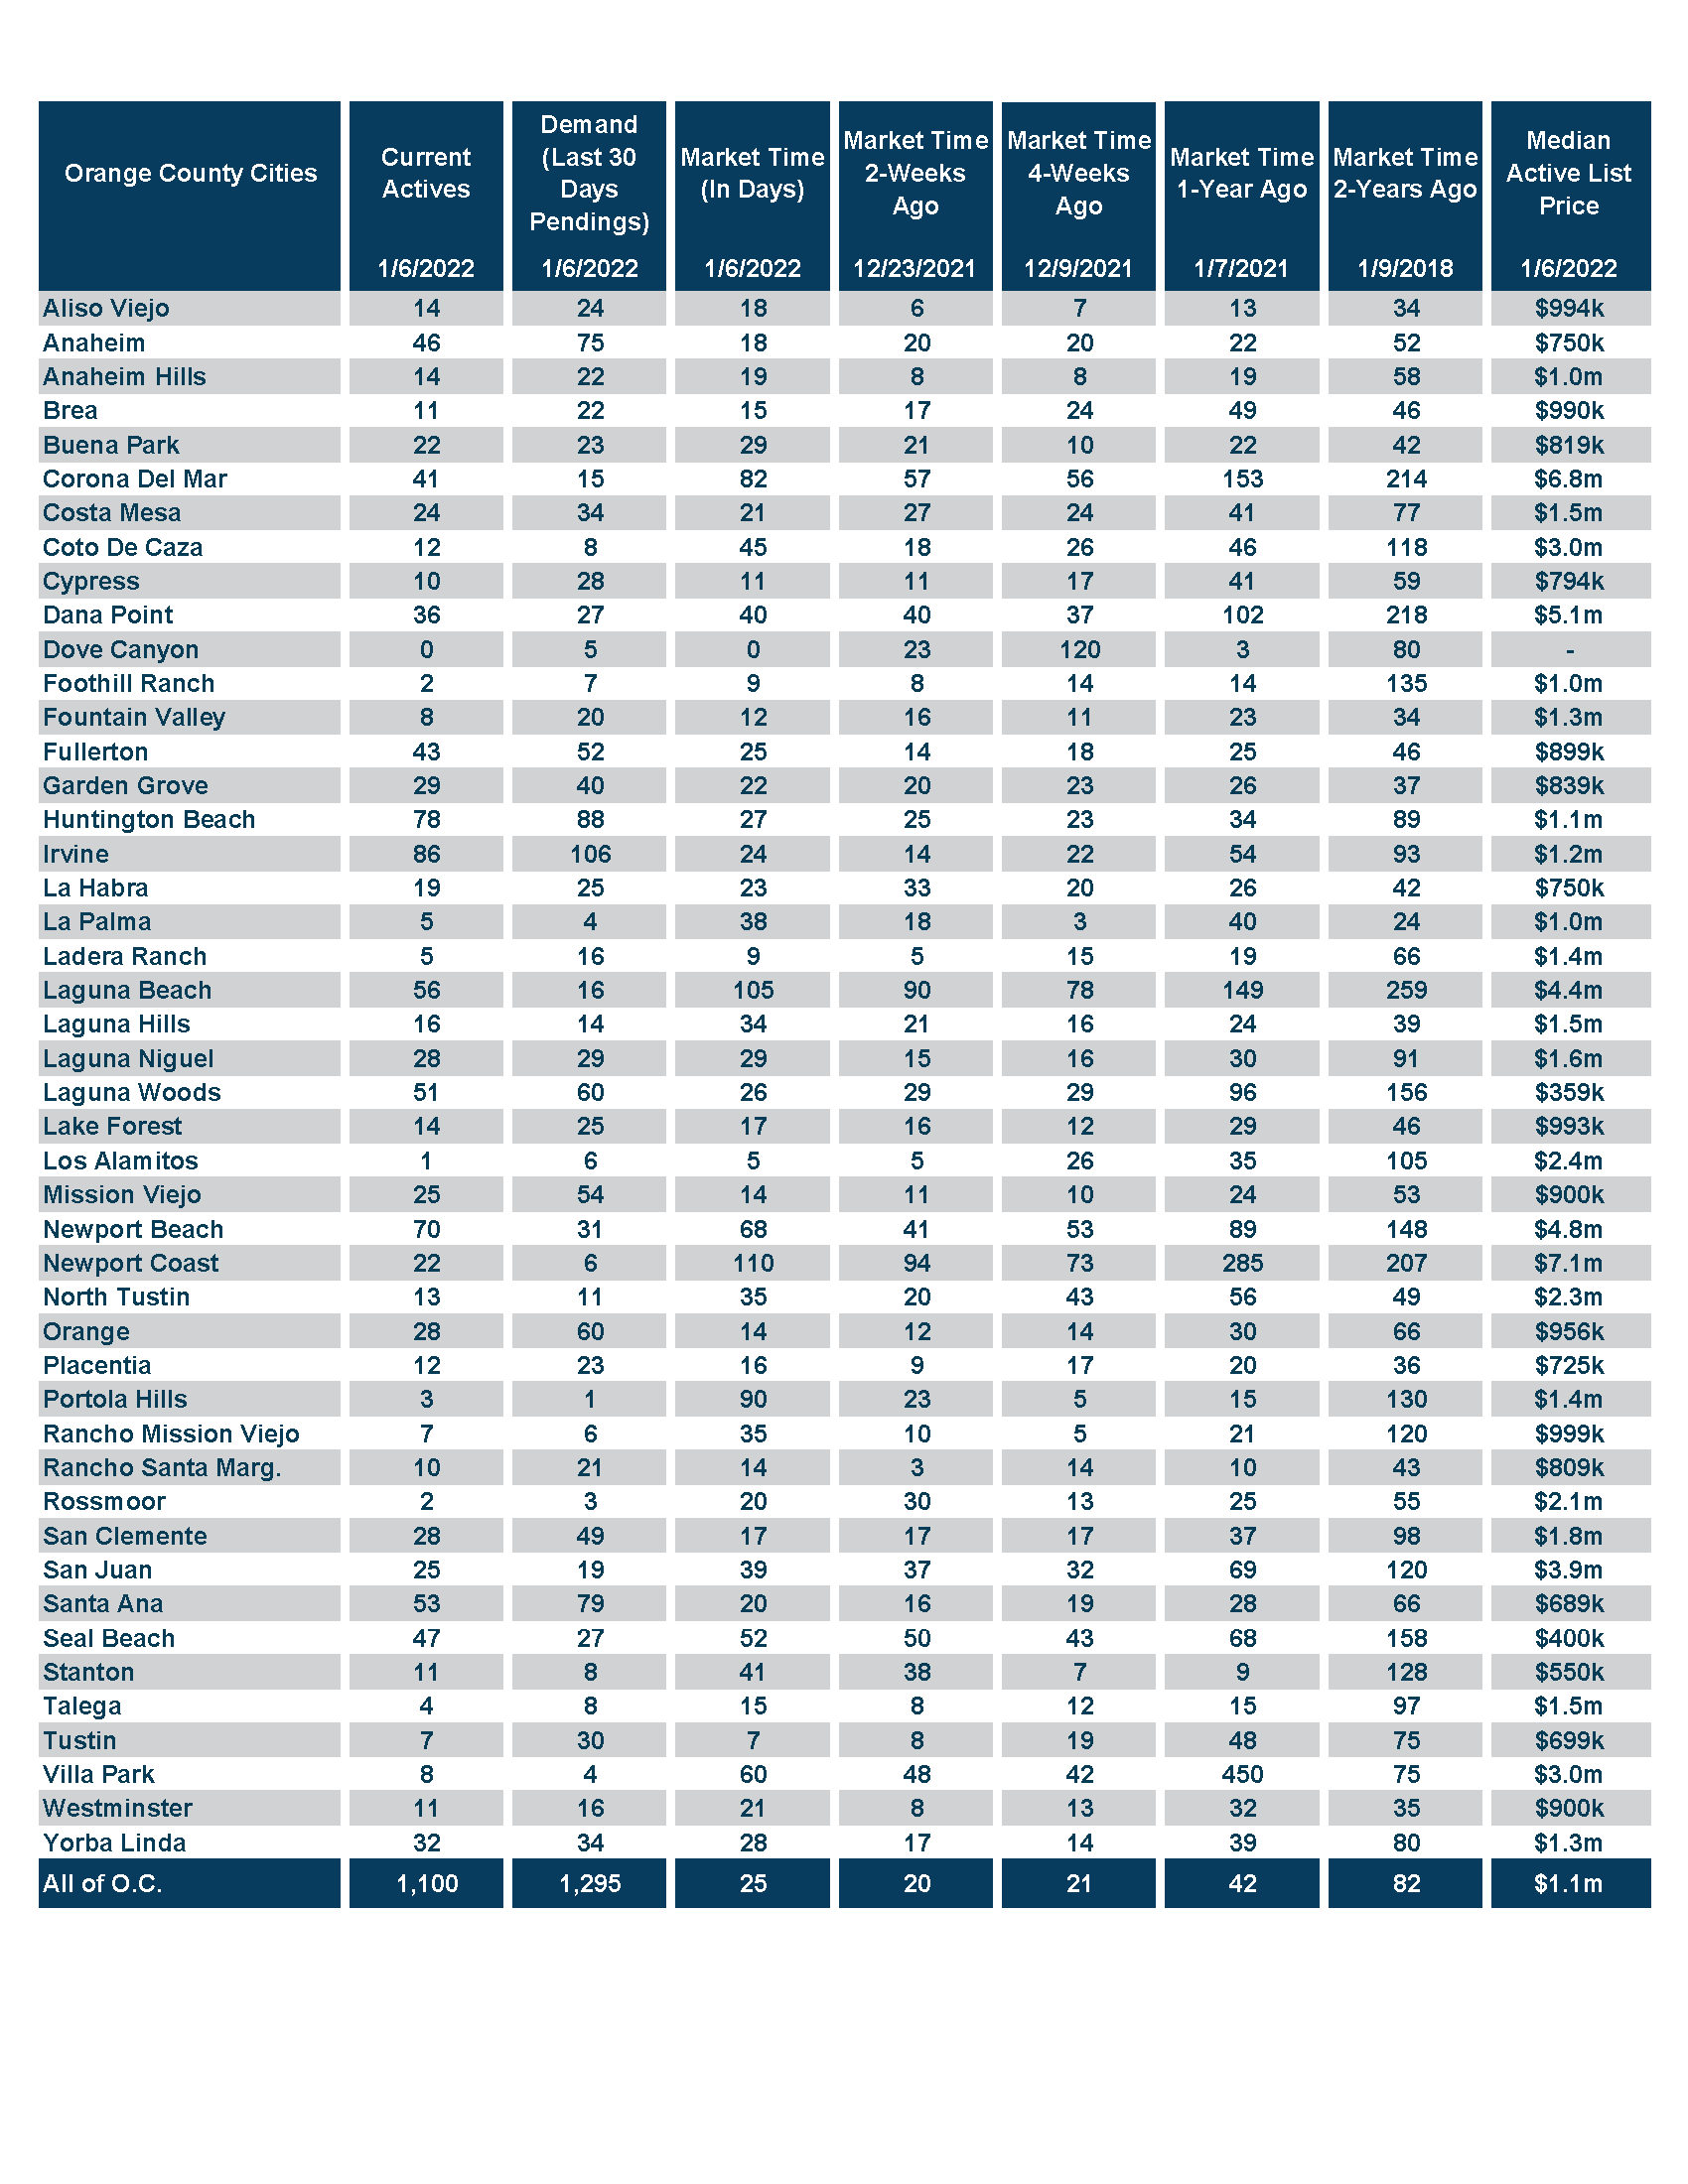
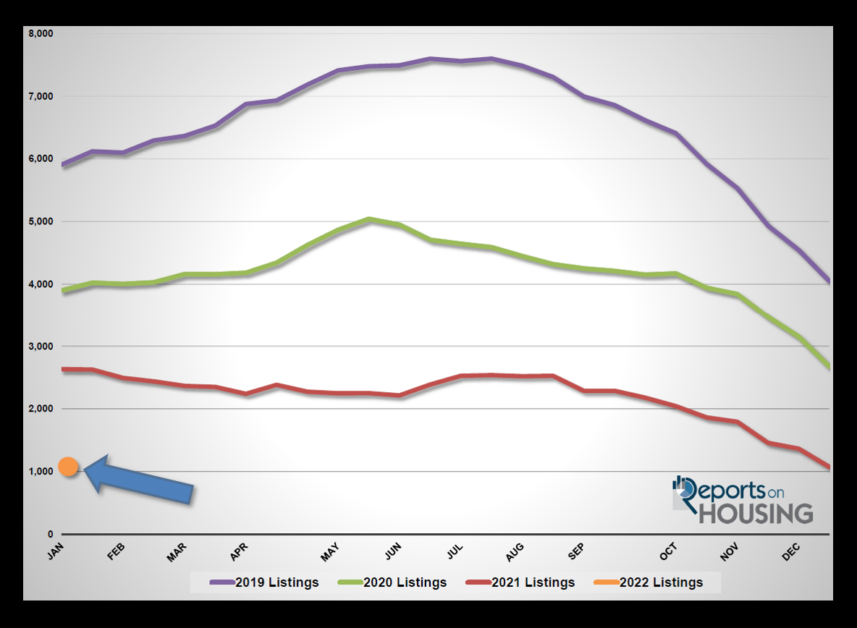
The active listing inventory increased by 28 homes in the past couple of weeks, up 3%, and now sits at 1,100 homes. Two weeks ago, December 23rd, the inventory had plunged to 1,072 homes. It sank further on January 1st to 954 homes, the lowest level since tracking began 18 years ago. Since New Year’s Day, the inventory has risen by 15%, adding 146 homes. Typically, the inventory slowly and methodically rises from the start of the year until it peaks between July and August. But during the pandemic, housing has not been typical at all. Last year the inventory continued to drop after ringing in New Year until the first week of June, far from ordinary. The big difference this year is a rising mortgage rate environment. The further rates climb, the more the inventory will cllimb over the coming months. As a seller, watching the direction of rates is an important strategy to deploy.
Last year, the inventory was at 2,633, 139% more, or an additional 1,533 homes. The 3-year average prior to COVID (2017 through 2019) is 4,665, an extra 3,902 homes, or 324% more, quadruple compared to today. There were a lot more choices back then.
For December, there were 1,429 new FOR-SALE signs in Orange County, only 65 fewer than the 3-year average from 2017 to 2019, 4% less. Every single missing sign magnifies the inventory crisis.
Demand
Demand plunged by 19% in the past couple of weeks.
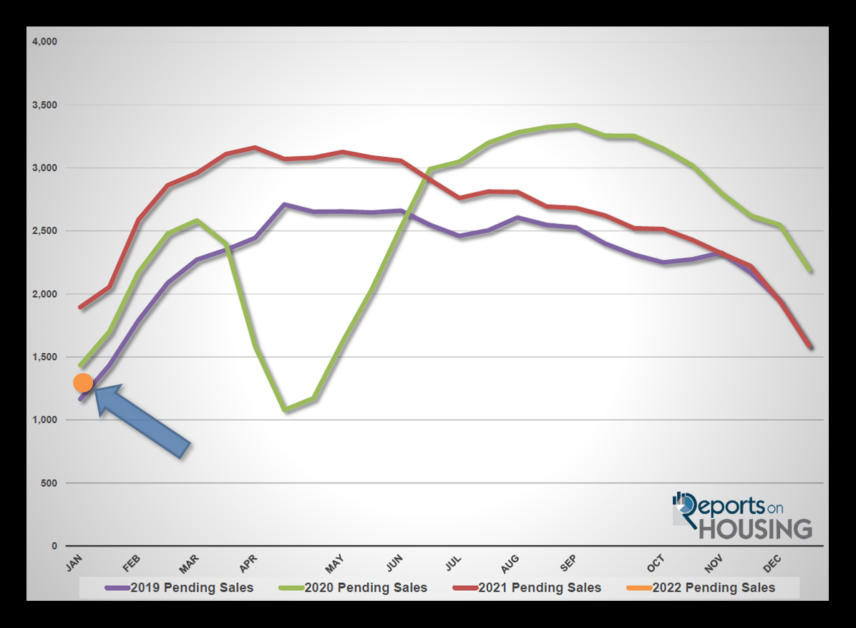
Demand, a snapshot of the number of new escrows over the prior month, decreased from 1,591 to 1,295 in the past couple of weeks, shedding 296 pending sales, down 19%. Yet, the low demand reading is more a reflection of the acute inventory crisis where only 1,429 homes were placed on the market last month. The limited supply of available homes is eating into the potential number of escrows. True demand, the number of buyers in the marketplace, is considerably higher than tracked demand based upon escrow activity. True demand is impossible to gauge, but the throngs of showings for just about every home that hits the market combined with the sheer volume of multiple offers generated illustrates that there is a vast pool of buyers looking to secure a home. As more homes come on the market, expect demand levels based upon escrow activity to climb swiftly. At this point, rising mortgage rates are not impacting measured demand.
Last year, demand was at 1,895, 46% more than today due to the surge in the market during the second half of the year because of COVID. The 3-year average prior to COVID (2017 to 2019) was 1,391 pending sales, 7% more than today.
With a large drop in demand and a small rise in the inventory, the Expected Market Time (the number of days to sell all Orange County listings at the current buying pace) increased from 20 to 25 days, its lowest level for a start to the year since tracking began in 2004. At 25 days, it is an insane, Hot Seller’s Market (less than 60 days) where there are a ton of showings, sellers get to call the shots during the negotiating process, multiple offers are the norm, and home values are rising rapidly. The 3-year average prior to COVID was at 104 days, much slower than today and a Balanced Market (between 90 and 120 days).
Luxury End
A new benchmark has been reached for luxury in Orange County.
There has been a big change in Orange County’s luxury home market. Luxury is defined as the top 10% of an area. For all of Orange County, it reached $1.25 million in 2016. The bar for tracking luxury increased from $1 million to $1.25 million. The luxury home market surged in 2020. As a result, the bar for luxury changed once again from $1.25 million to $1.5 million. In 2021, luxury was a disproportionate number of home sales and values skyrocketed. Consequently, the threshold for luxury changed to $2 million. From this point forward, luxury will now be defined as $2 million and greater for Orange County.
In the past two weeks the luxury inventory of homes priced above $2 million decreased by 4 homes, down 1%, and now sits at 352. Luxury demand decreased by 27 pending sales, down 19%, and now sits at 116. With a larger drop in the demand compared to the supply, the overall Expected Market Time for luxury homes priced above $2 million increased from 75 to 91 days. At 91 days, it is still an extremely hot market for luxury.
Year over year, luxury demand is down by 19 pending sales or 14%, and the active luxury listing inventory is down by 414 homes or 54%. The Expected Market Time last year was at 170 days, exceptionally hot for luxury, but nearly double where it stands today, indicating just how unbelievably hot the luxury market is today.
For homes priced between $2 million and $4 million, the Expected Market increased from 44 to 55 days. For homes priced between $4 million and $8 million, the Expected Market Time increased from 101 to 159 days. For homes priced above $8 million, the Expected Market Time decreased from 713 to 210 days. At 210 days, a seller would be looking at placing their home into escrow around August 2022.
Orange County Housing Summary
- The active listing inventory added 28 homes, up by 3%, and now totals 1,100 homes, its lowest start to the year since tracking began 18 years ago. In December, there were 4% fewer homes that came on the market compared to the 3-year average prior to COVID (2017 to 2019), 65 fewer. Last year, there were 2,633 homes on the market, 1,533 additional homes, or 139% more.
- Demand, the number of pending sales over the prior month, decreased by 296 pending sales in the past two weeks, down 19%, and now totals 1,295. Last year, there were 1,895 pending sales, 46% more than today due to a delay in the 2020 Spring Market because of COVID.
- With demand plunging coupled with a slight rise in the supply, the Expected Market Time, the number of days to sell all Orange County listings at the current buying pace, increased from 20 to 25 days in the past couple of weeks, its lowest level to start a year and an insanely Hot Seller’s Market (less than 60 days). It was at 42 days last year, slower than today.
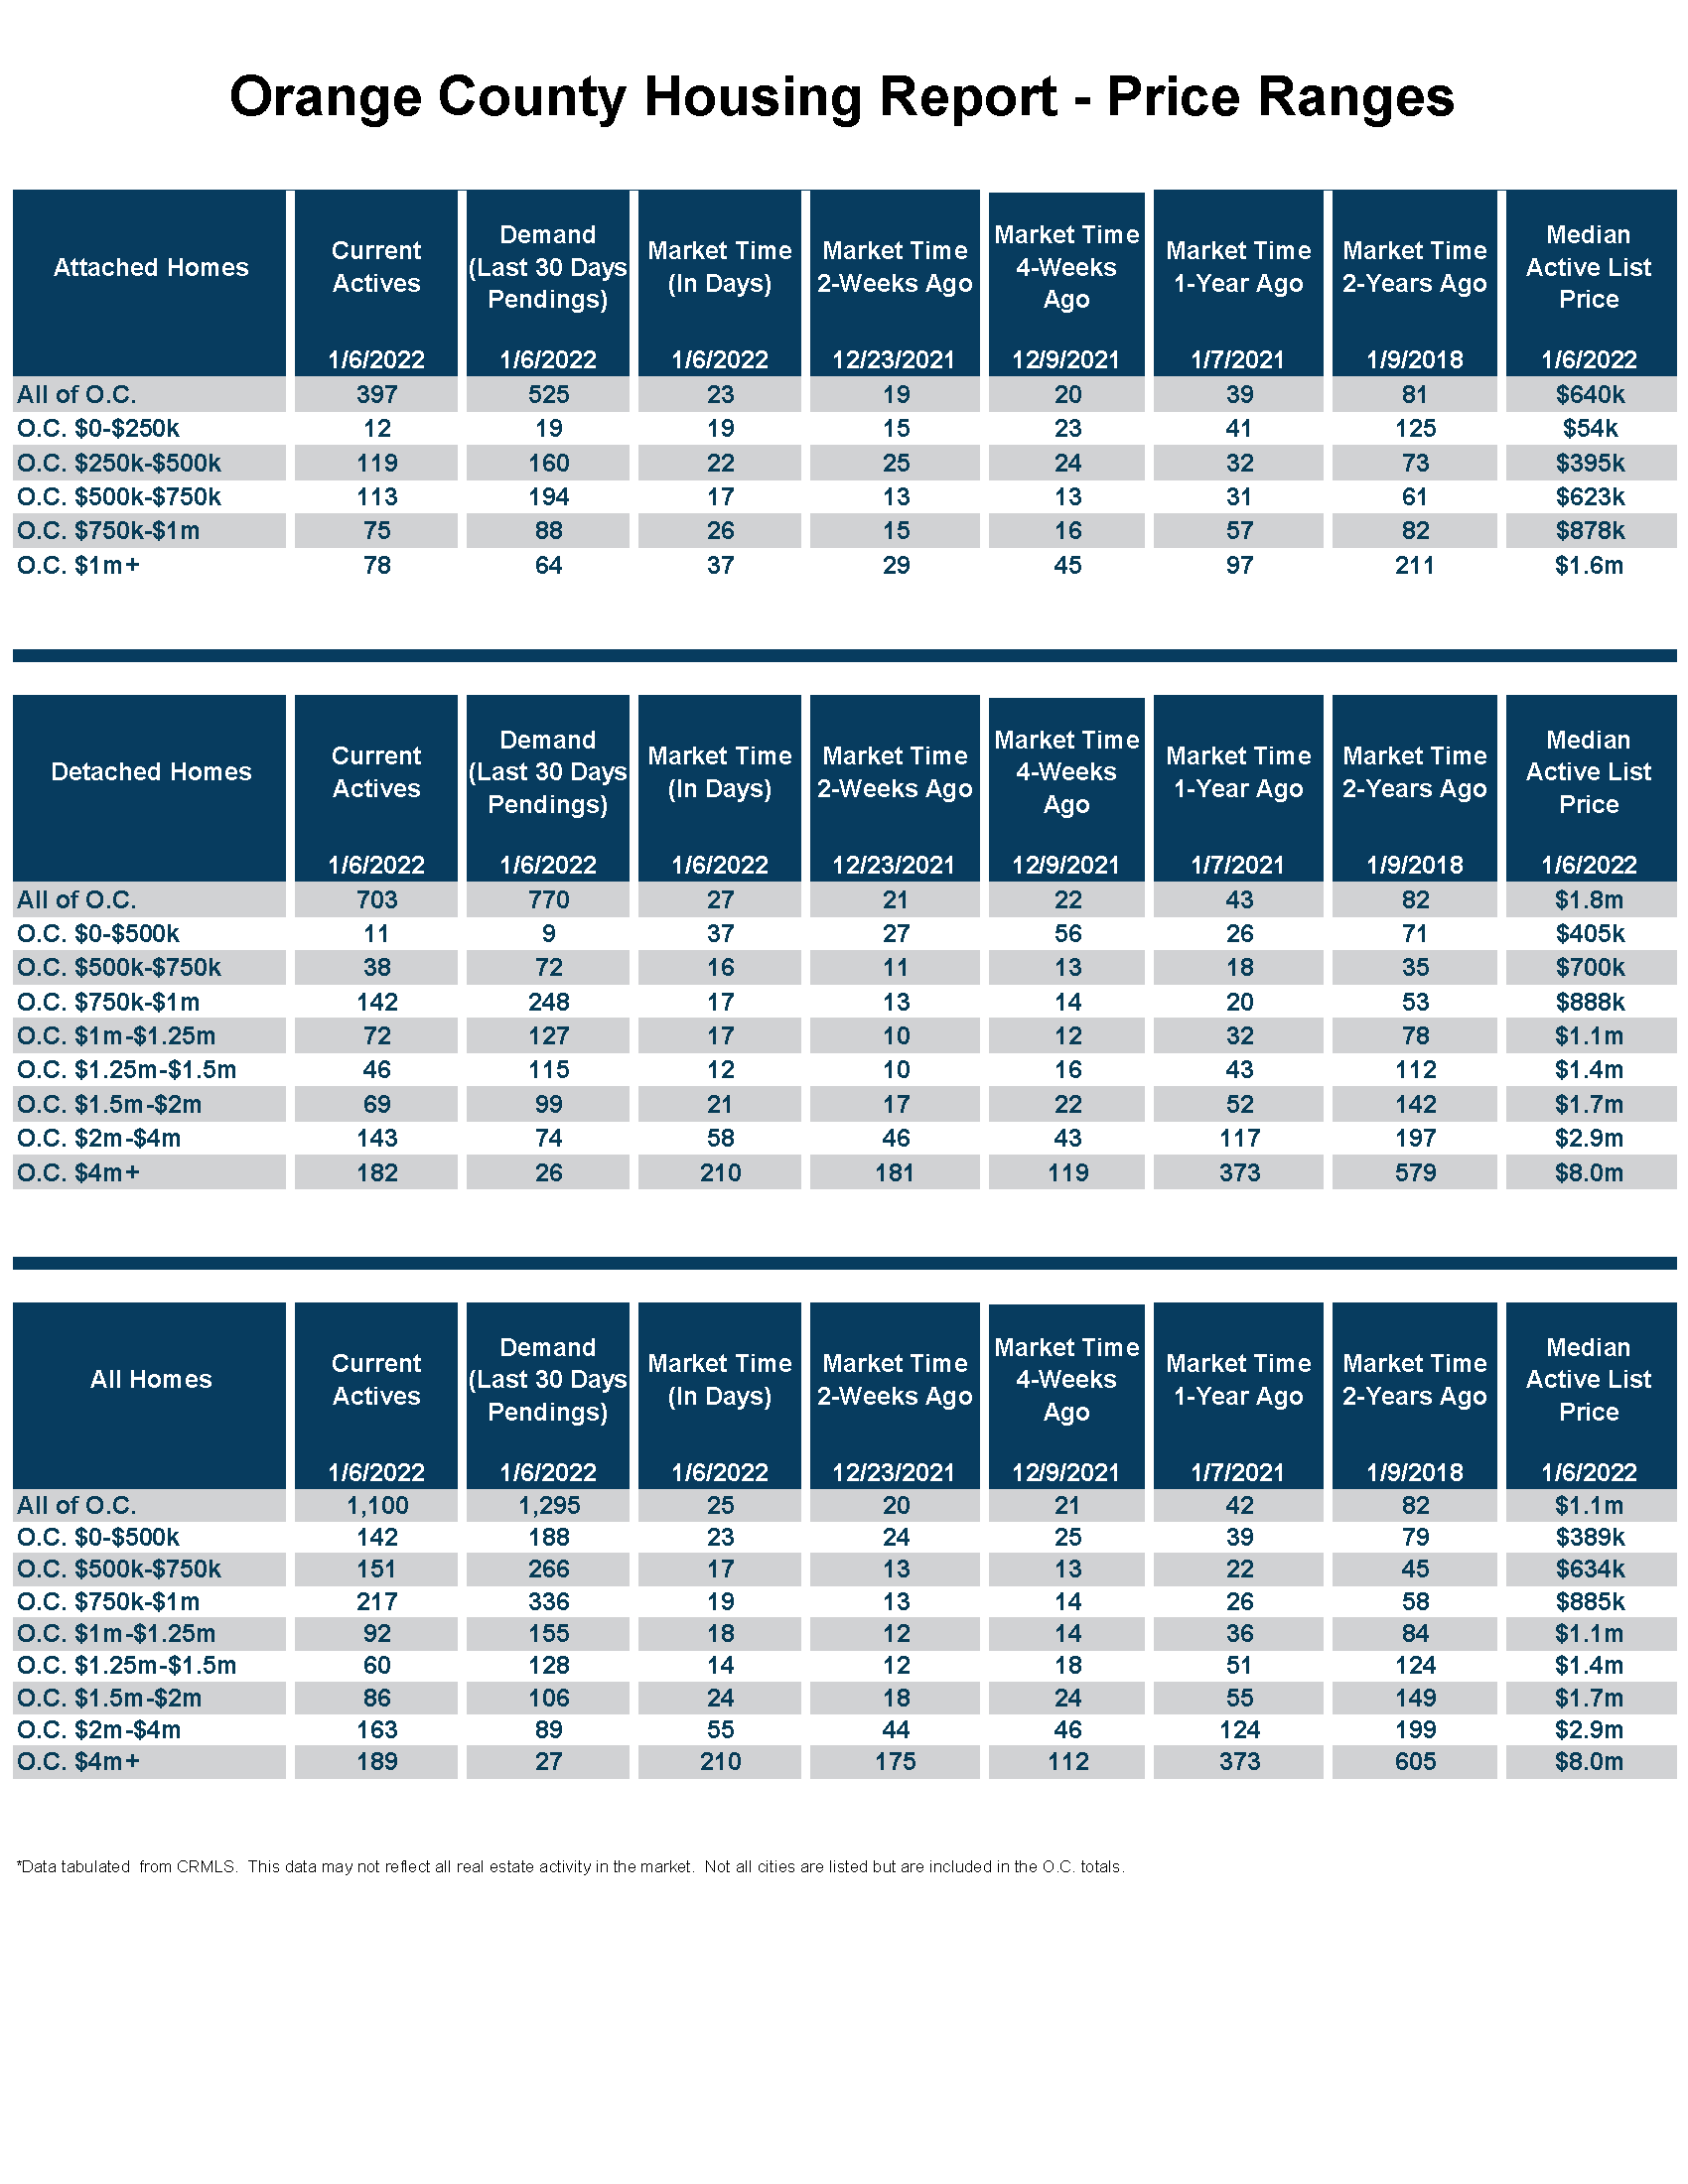
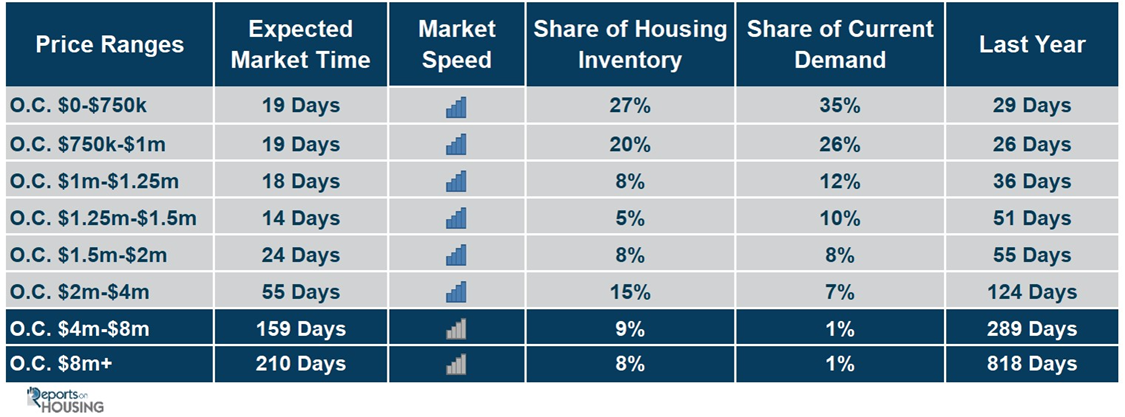
- For homes priced below $750,000, the market is a Hot Seller’s Market (less than 60 days) with an Expected Market Time of 19 days. This range represents 27% of the active inventory and 35% of demand.
- For homes priced between $750,000 and $1 million, the Expected Market Time is 19 days, a Hot Seller’s Market. This range represents 20% of the active inventory and 26% of demand.
- For homes priced between $1 million to $1.25 million, the Expected Market Time is 18 days, a Hot Seller’s Market. This range represents 8% of the active inventory and 12% of demand.
- For homes priced between $1.25 million to $1.5 million, the Expected Market Time is 14 days, a Hot Seller’s Market. This range represents 5% of the active inventory and 10% of demand.
- For homes priced between $1.5 million to $2 million, the Expected Market Time is 24 days, a Hot Seller’s Market. This range represents 8% of the active inventory and 8% of demand.
- For homes priced between $2 million and $4 million, the Expected Market increased from 44 to 55 days. For homes priced between $4 million and $8 million, the Expected Market Time increased from 101 to 159 days. For homes priced above $8 million, the Expected Market Time decreased from 713 to 210 days.
- The luxury end, all homes above $2 million, accounts for 32% of the inventory and 9% of demand.
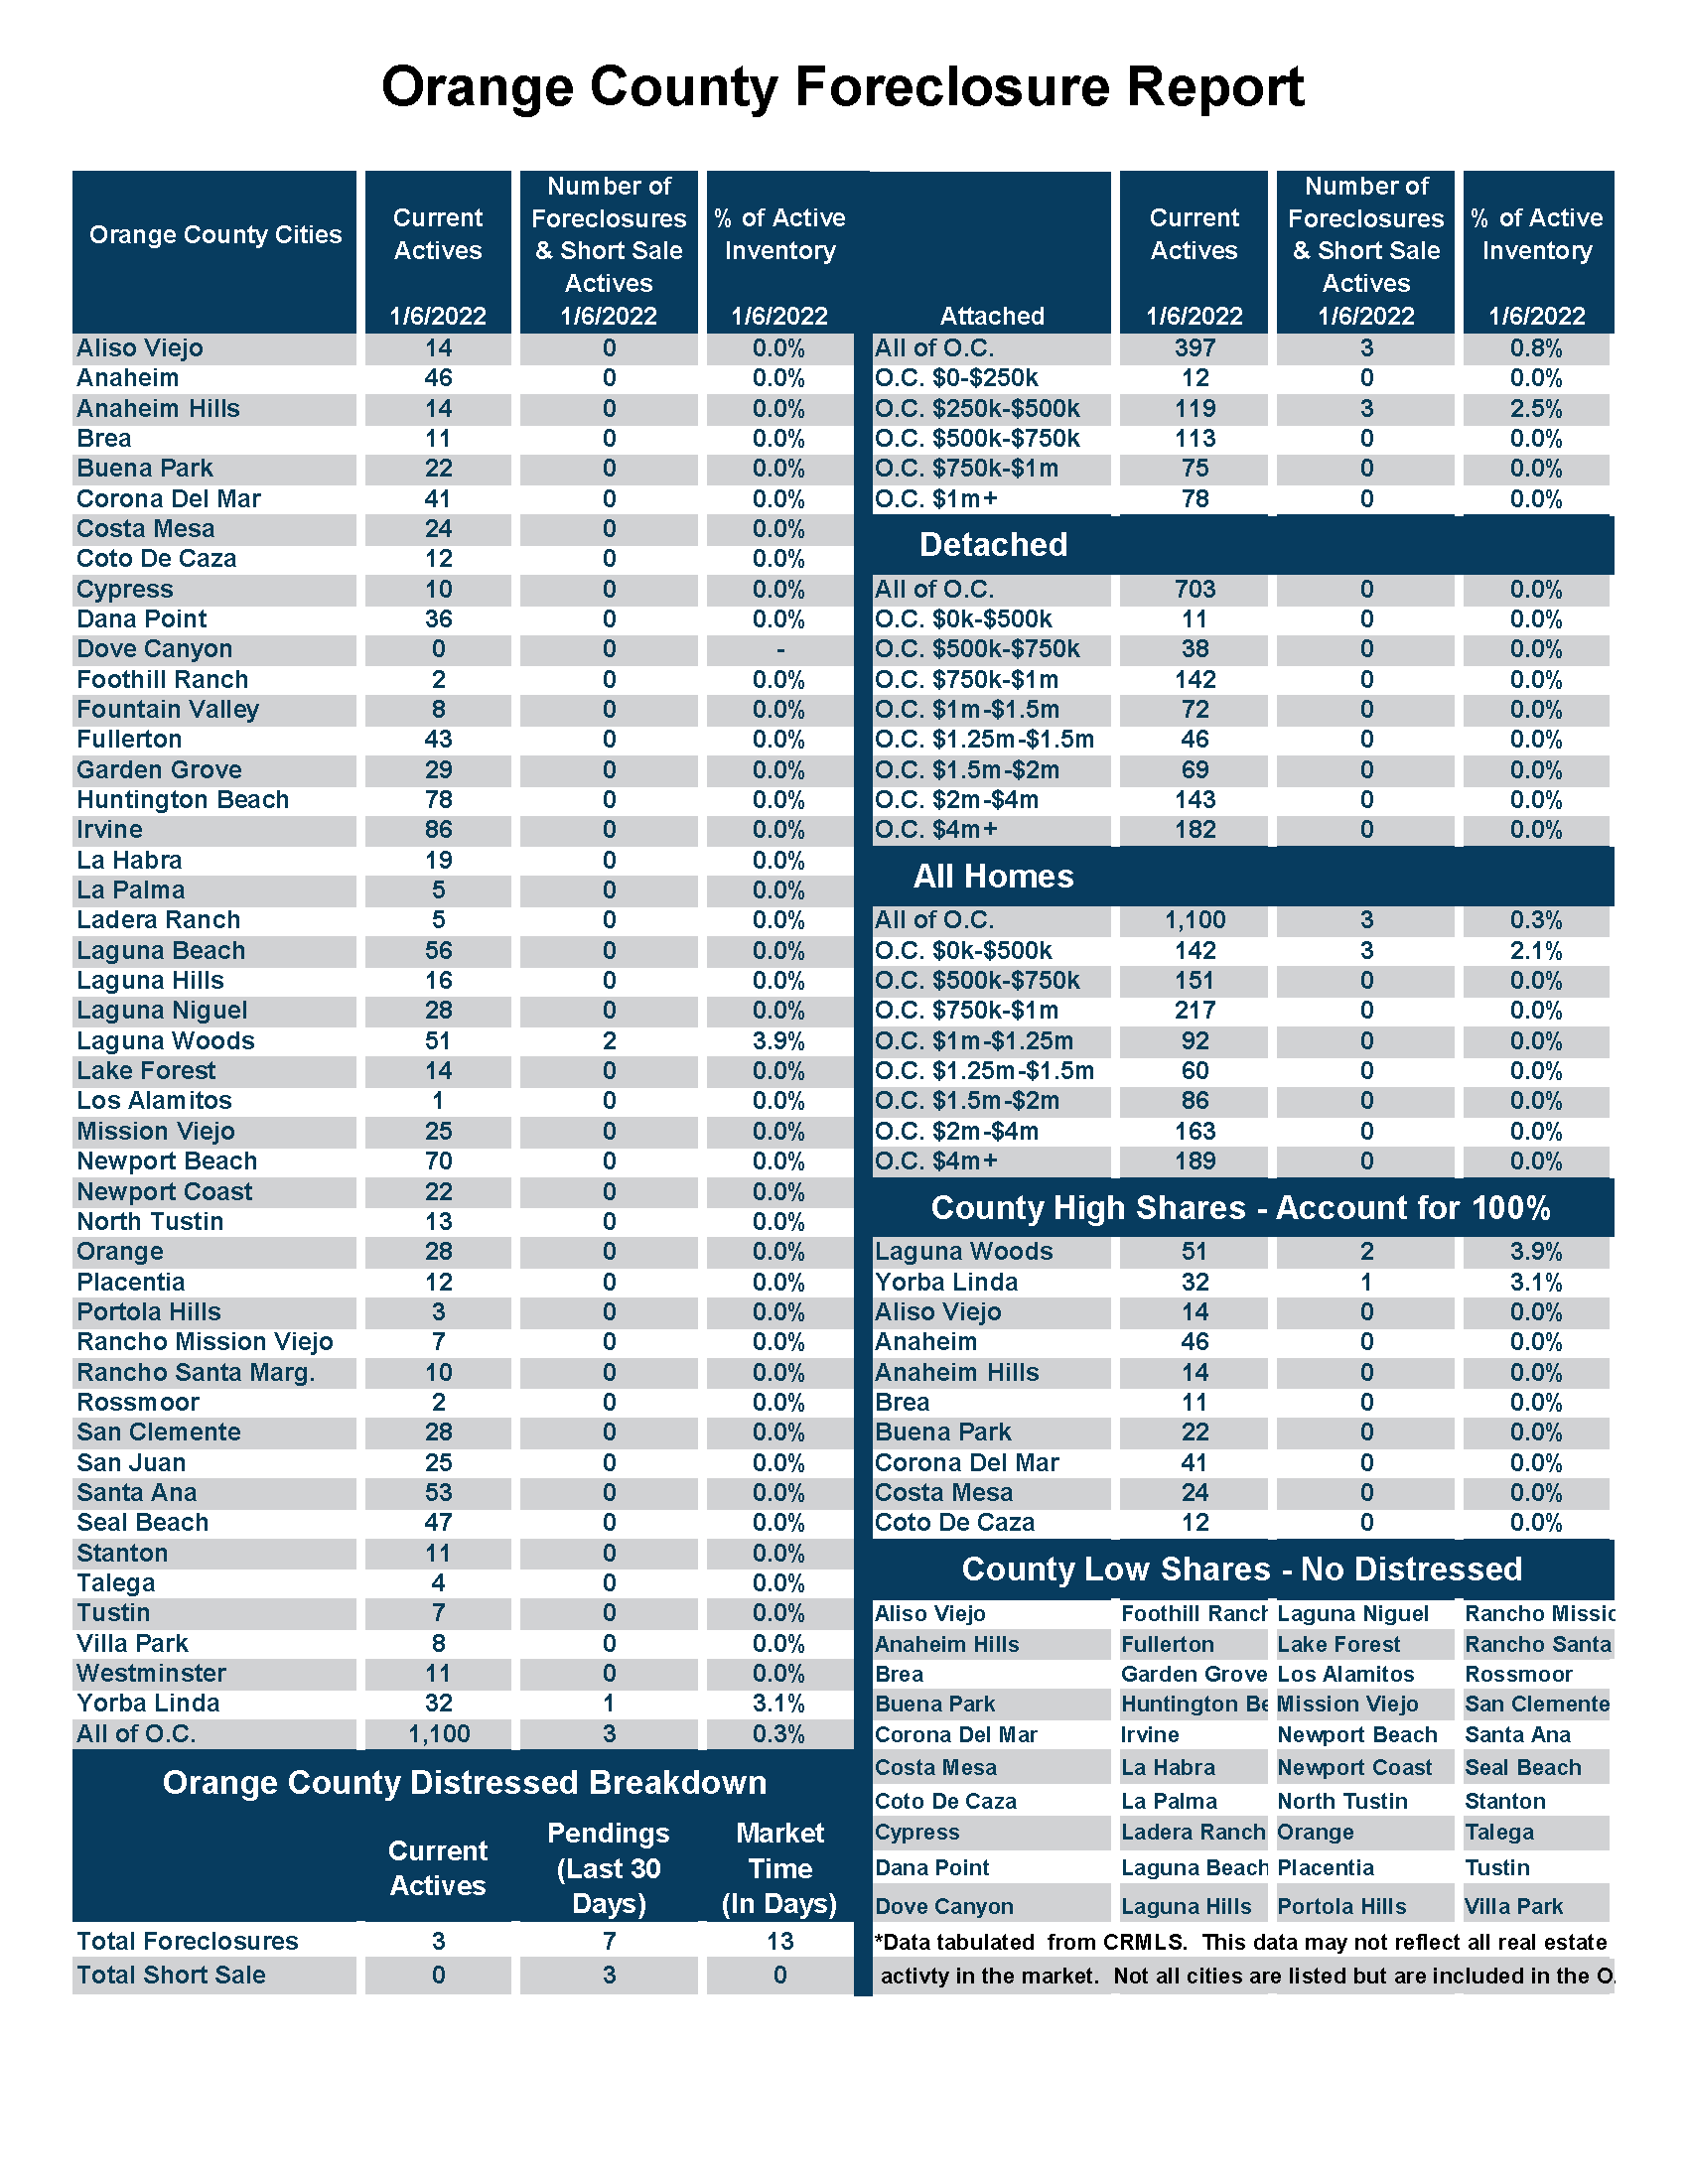
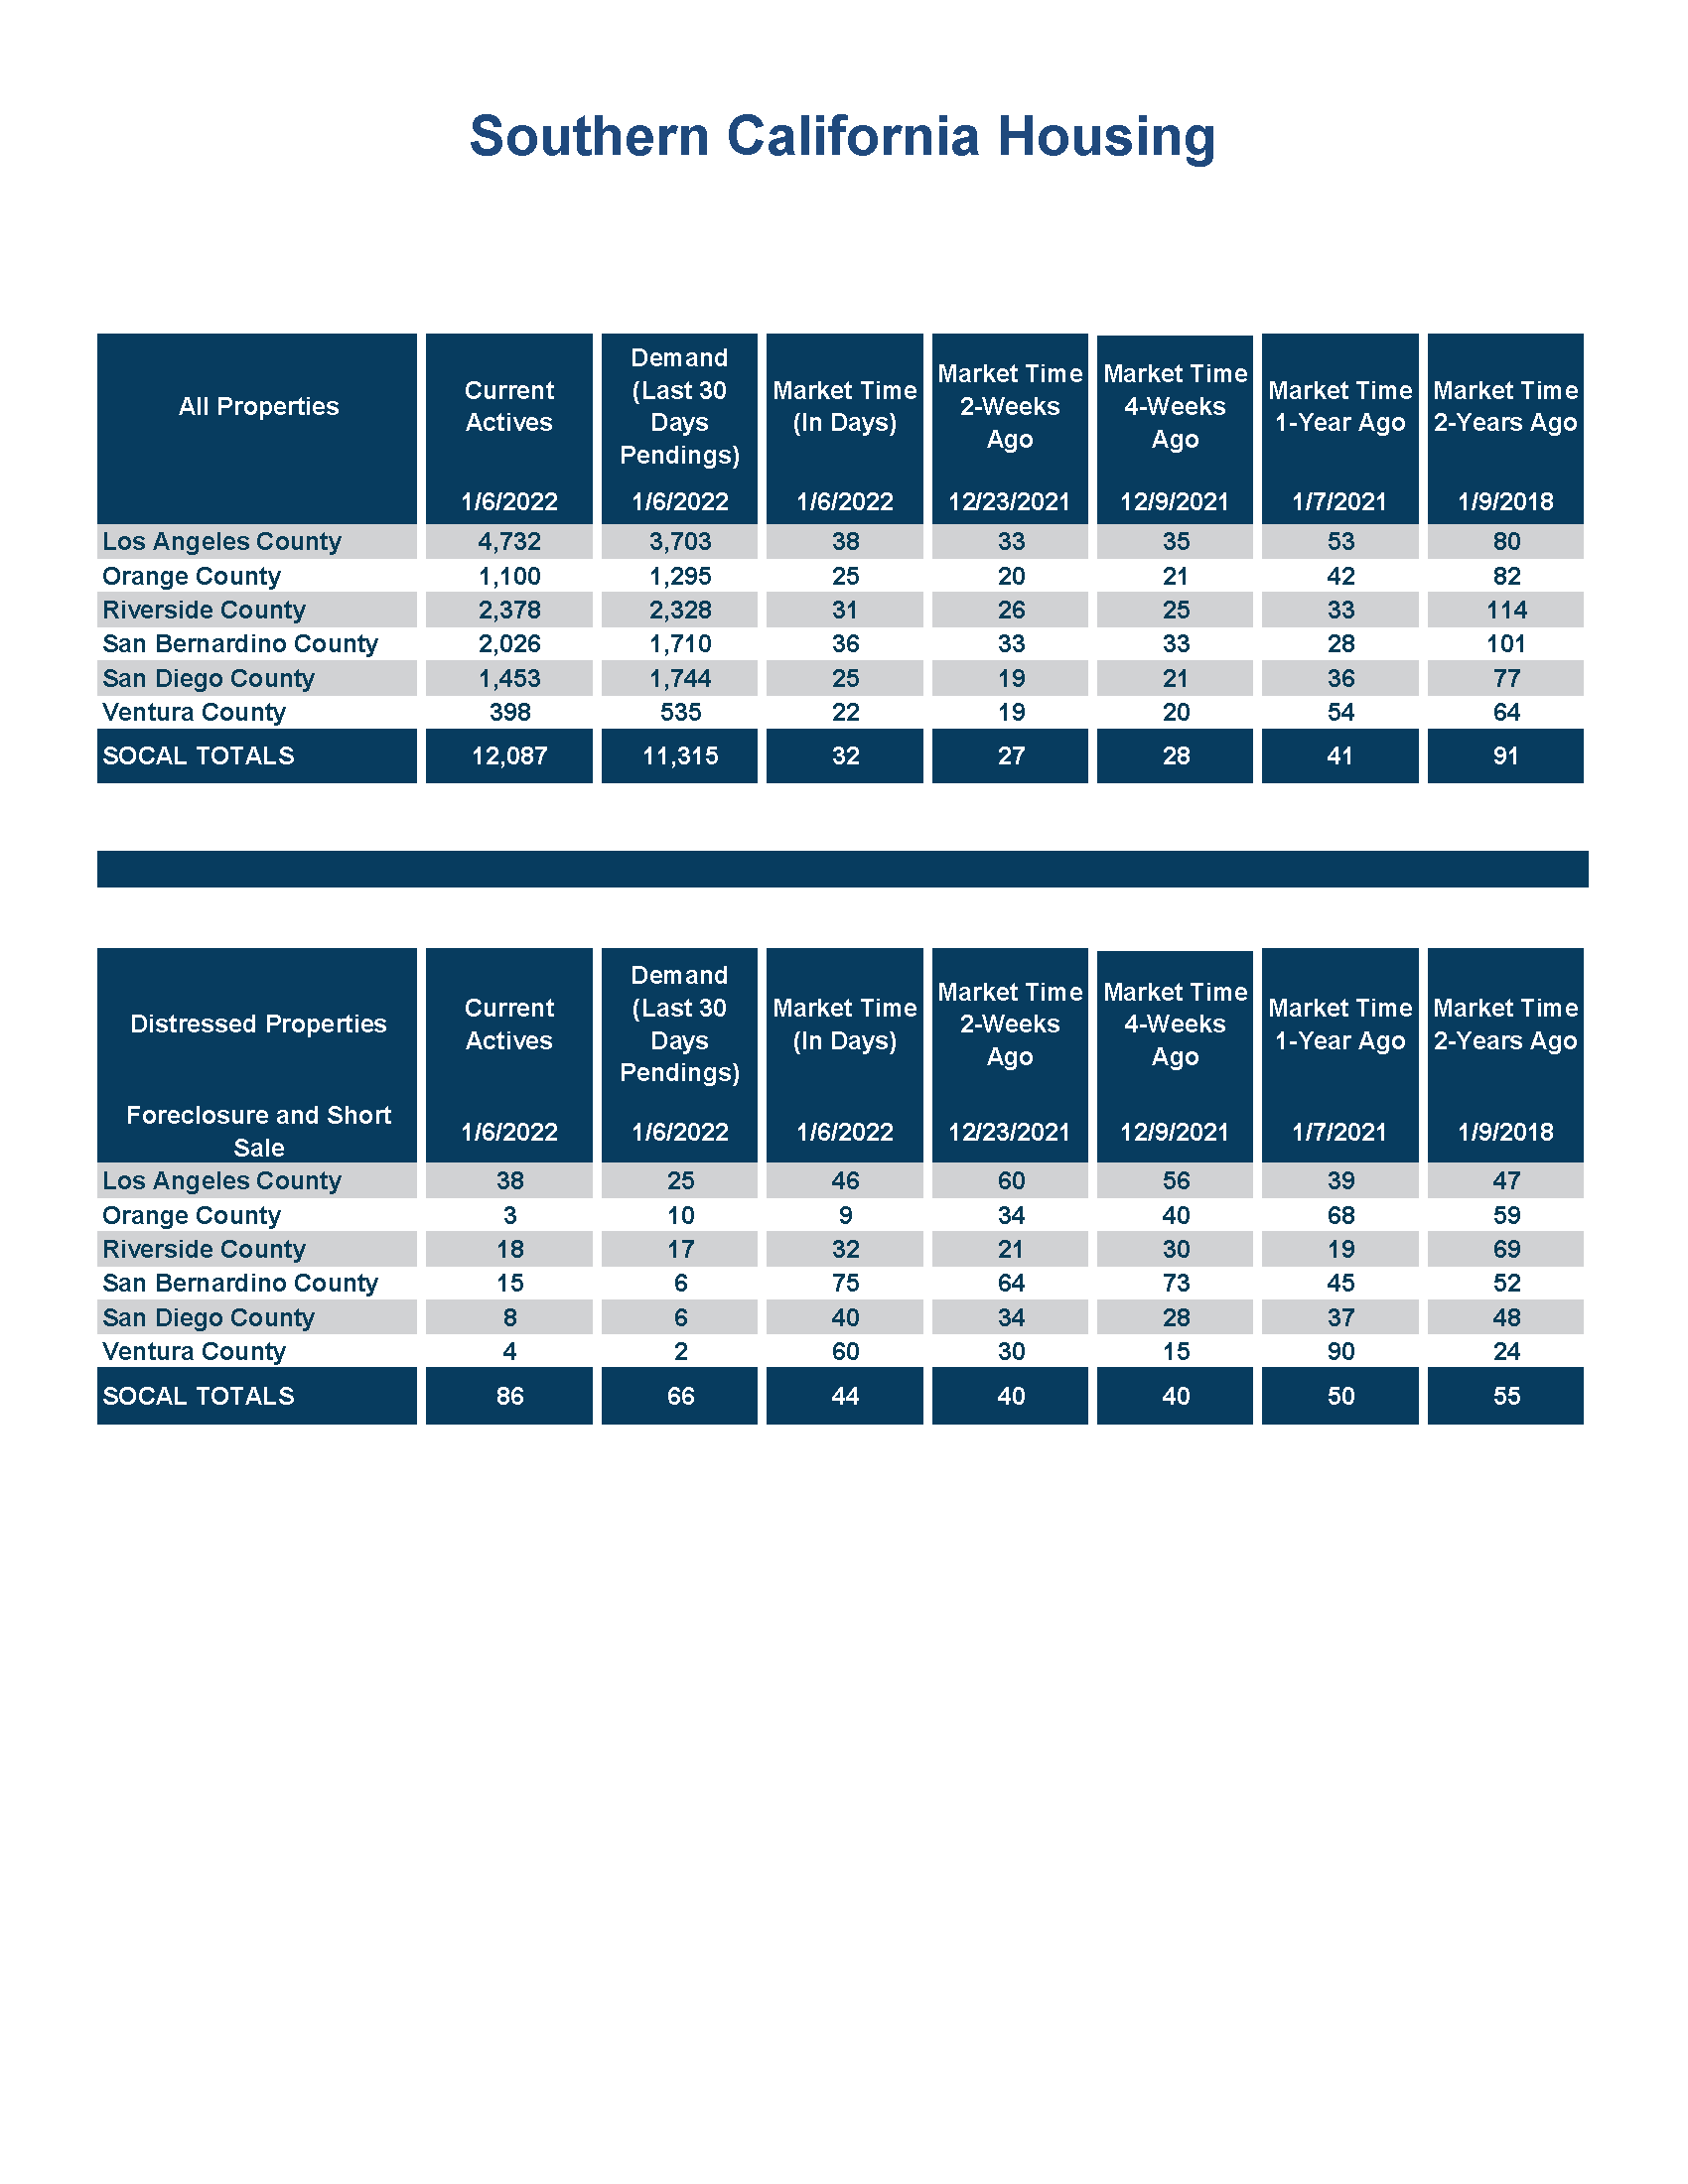
- Distressed homes, both short sales and foreclosures combined, made up only 0.3% of all listings and 0.8% of demand. There are only 3 foreclosures and no short sales available to purchase today in all of Orange County, 3 total distressed homes on the active market, down 6 from two weeks ago. Last year there were 9 total distressed homes on the market, similar to today.
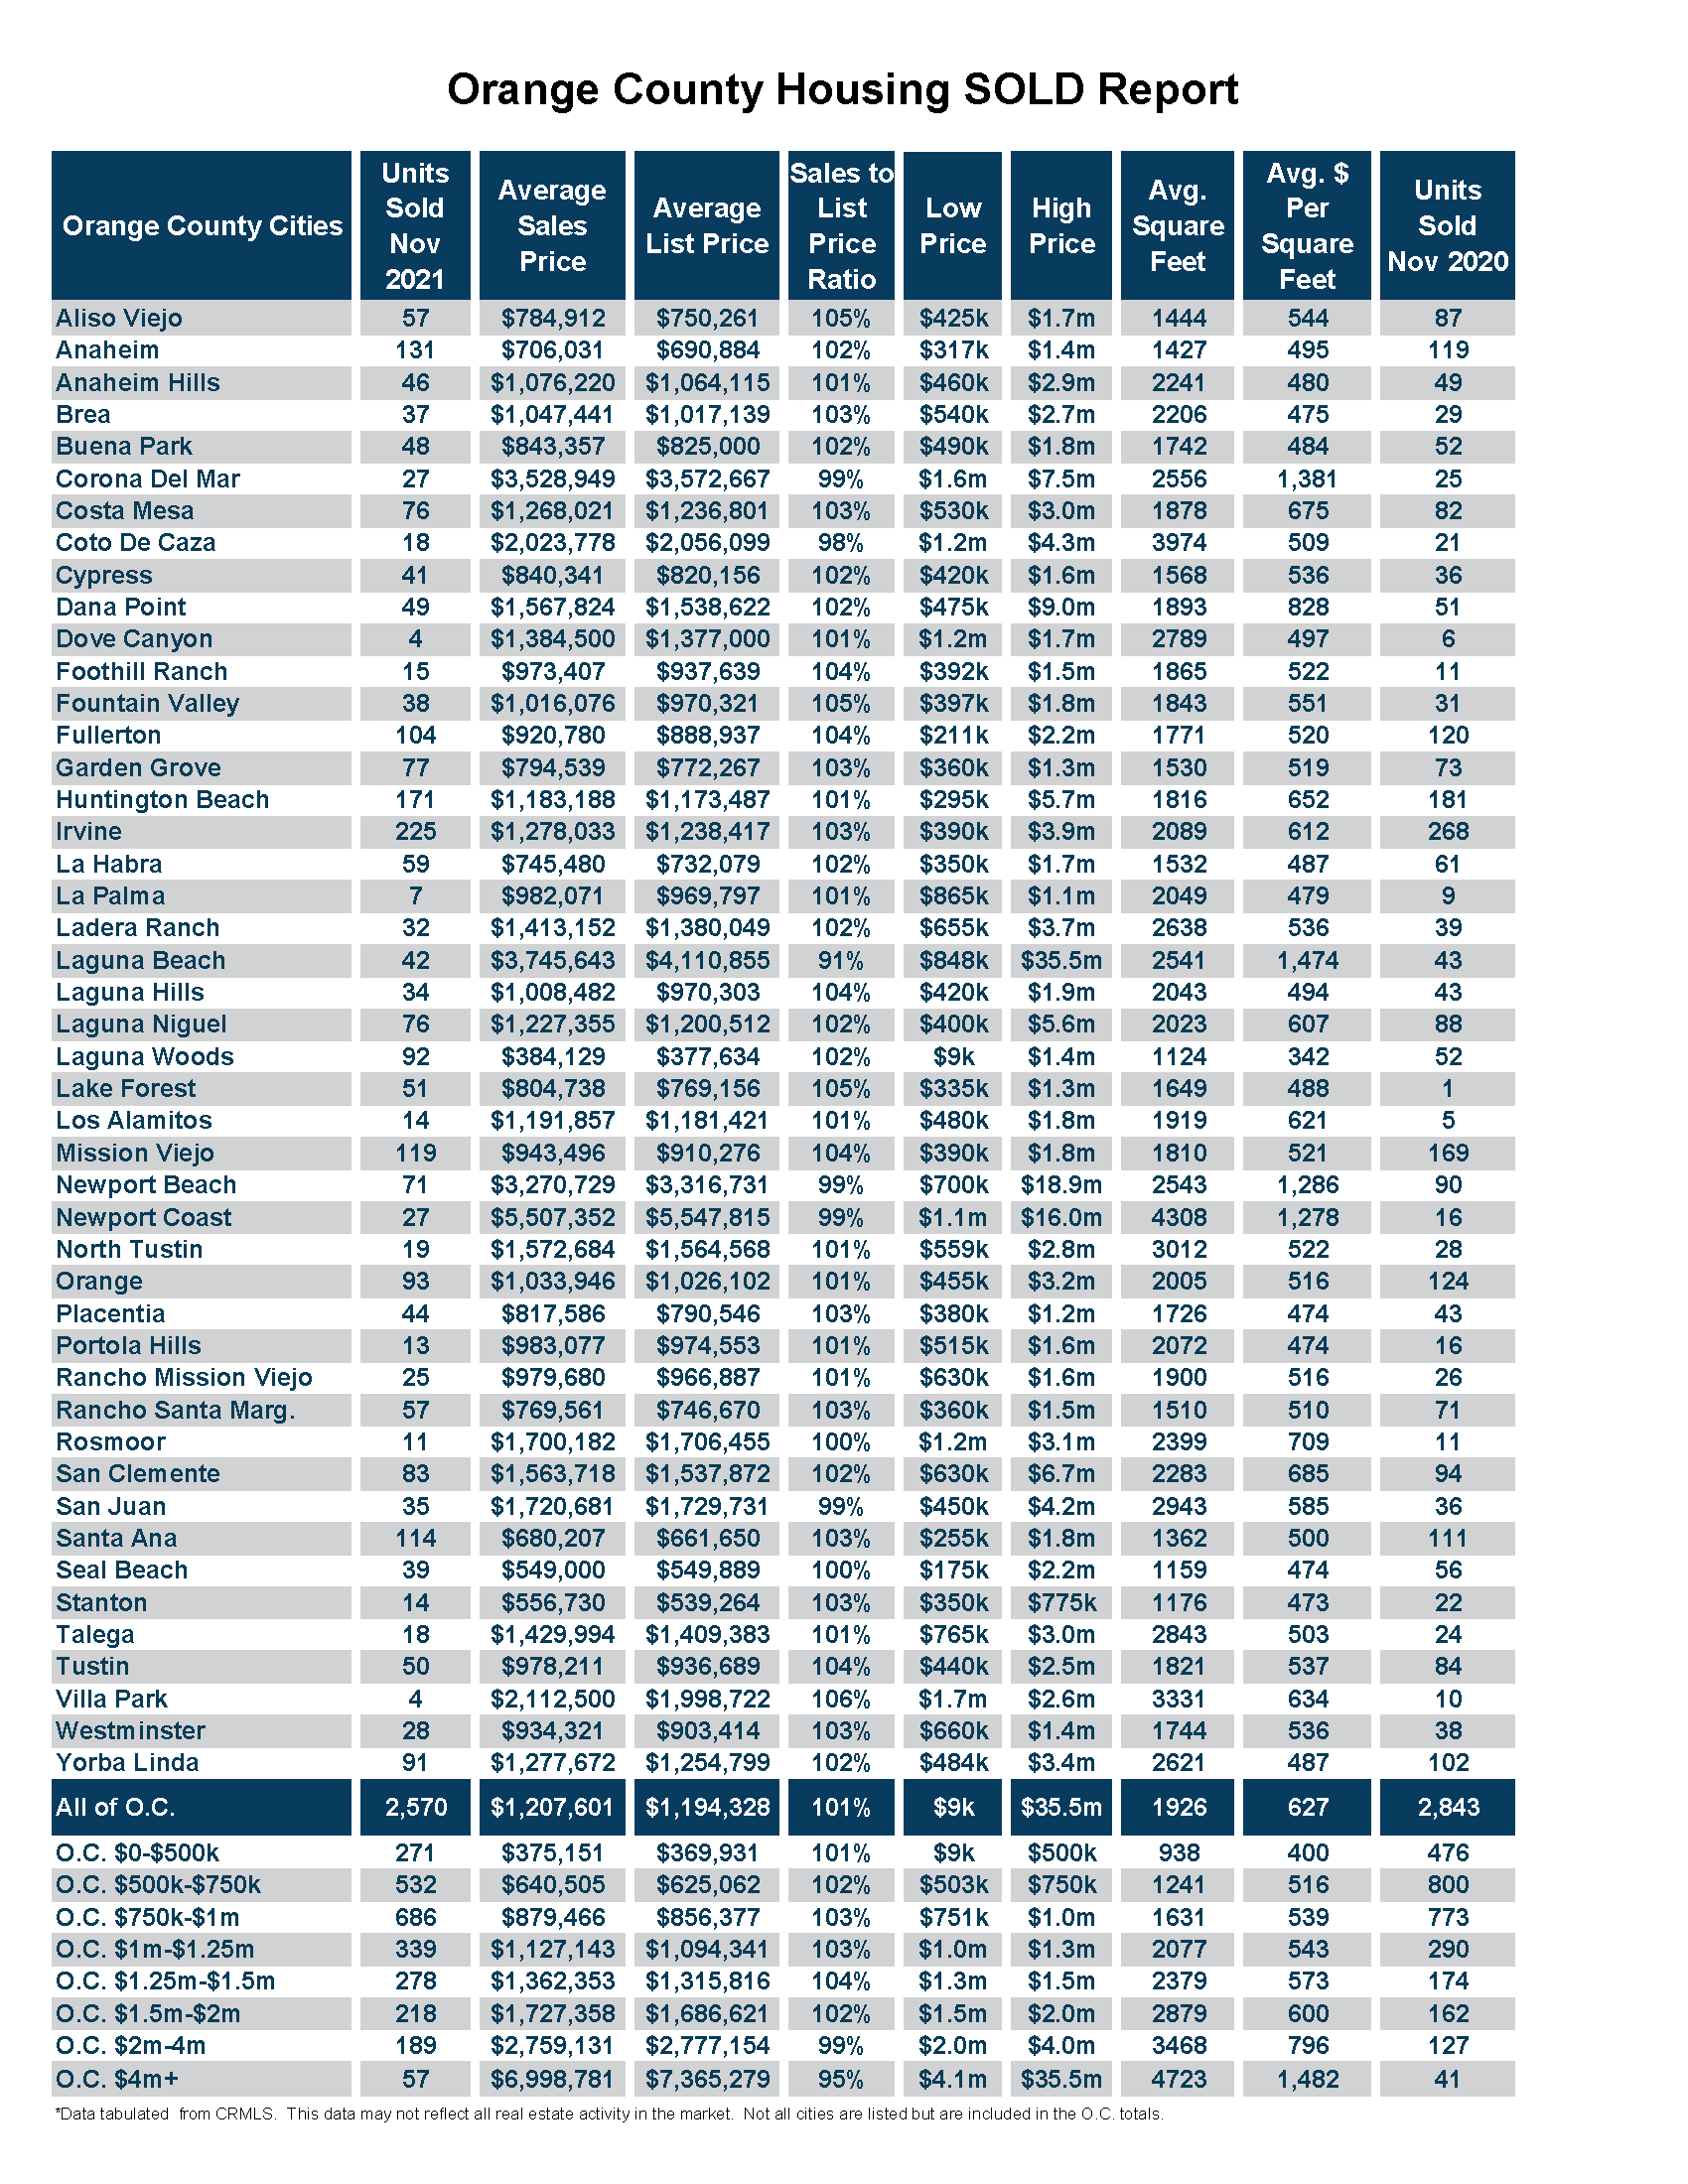
- There were 2,570 closed residential resales in November, 10% less than November 2020’s 2,843 closed sales. For the year, through November, there have been 32,669 closed sales, 20% higher than last year. September marked a 7% drop compared to October 2021. The sales to list price ratio was 101.1% for all of Orange County. Foreclosures accounted for just 0.2% of all closed sales, and short sales accounted for 0.2%. That means that 99.6% of all sales were good ol’ fashioned sellers with equity.
Have a great week.
Sincerely,
Steven Thomas
Quantitative Economics and Decision Sciences
Copyright 2022- Steven Thomas, Reports On Housing – All Rights Reserved. This report may not be reproduced in whole or part without express written permission by author.