
April 5, 2021
Even though buyers are exceedingly frustrated with the housing market after writing too many offers to no avail, waiting until the market gets easier is not the answer.
Cost of Waiting
Housing will become more unaffordable as homes continue to rapidly appreciate and mortgage rates rise.
Ask any buyer what it is like attempting to purchase a home in today’s housing market and the responses will be same. It is frustrating, overwhelming, exhausting, and disheartening. Buyers consistently get their hopes up and run around each weekend to see the few new houses that are now available. They ultimately write another offer. A few days later they write a counter offer, often for way more than the asking price. They agonizingly wait another day or two only to find out that they are not the winning bidder. It is back to the drawing board, again.
It feels like a dog chasing its own tail, a pointless exercise that ends in exhaustion. After writing offer after offer with no success, many buyers become discouraged and question whether they should continue to pursue their dream in purchasing a home. Maybe they should wait until the market is not so blistering hot, or until they have a larger down payment, or when there are more homes available. The facts and data illustrate why waiting is not a great strategy at all. While it may be discouraging for buyers to continue the pursuit in purchasing a home, diving into the consequences of waiting will keep them motivated. It is important to focus on the monthly payment in purchasing a home today and compare it to delaying until the end of the year. An $875,000 home purchased today with a 20% down payment yields a monthly payment of $2,999 at the current interest rate of 3.125%.
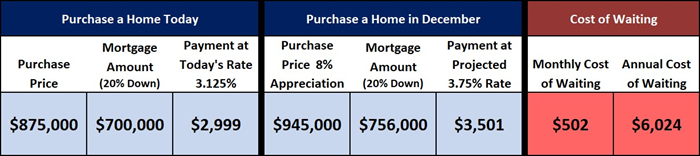
With a record low supply of available homes to purchase paired with unstoppable demand powered by historically low mortgage rates, home values are anticipated to continue to increase at a pace of about 1% per month through the end of the year. That equates to a home appreciation of 8% from now through December. At the same time, the United States economy is revving its massive engine now that it is emerging from the depths of the pandemic. Excellent job reports, increased travel, a massive personal savings surplus, and a return to some semblance of normal life again will ignite the economy and translate to a rise in mortgage interest rates. It is already occurring. According to Freddie Mac’s Primary Mortgage Market Survey®, rates started the year at 2.65%, an all-time record low, and have since risen to 3.125%. That is nearly a half a point higher in just a few months. By year’s end, rates are forecasted to hit 3.75% or higher.
That means that the $875,000 home example above will appreciate to $945,000 in December. Match that up with the expected 3.75% mortgage rate, and the monthly payment blossoms from $2,999 to $3,501 per month, an increase of
$502 every single month for the life of the loan. That is $6,024 per year or $30,120 in five years. This example only factors the increase in the principal and interest payment. The 20% down payment for $945,000 is an extra $14,000 down.
Property taxes go up too. With the average tax rate of 1.1%, that amounts to an additional $770 annually. In the end, it all adds up to a lot more out of pocket expense on waiting until the end of the year to pull the trigger on a purchase. There is a definite cost to waiting even though the current market is extremely frustrating from a buyer’s perspective. There is a higher monthly mortgage payment. Down payments are larger. Property taxes are higher.
There are some who believe that when rates rise to 3.75% that the housing market will reverse course and become a buyer’s market. There are plenty of YouTube videos that promote this explaining that a 1% rise in rates translates to a 10% drop in prices. Yet, that did not occur in 2013 when rates rose from 3.34% in January to 4.5% in July. It did not occur in 2018 when rates rose from 3.95% in January to 4.94% in November. Home prices did not fall. These theories are not rooted in fact. Instead, they are click bate for views, after all, that is how YouTubers are paid.
It is better to look at supply and demand. While demand will decrease when rates rise to 3.75% or 4%, it will not shut off demand completely. It will still be a Hot Seller’s Market. It would be like decelerating on the freeway from 140 miles per hour to 80 miles per hour. While it may be slower, it is still speeding. Housing will move from a crazy, nutty market to a more sustainable pace.
The current number of available homes to purchase is at a record low 2,240. The five-year average (from 2015 to 2019 and intentionally excluding 2020 as the numbers were skewed due to the pandemic) is 5,552, or 148% more. That is an extra 3,312 homes on the market. Current demand (a snapshot of the last 30-days of pending activity) is at 3,162 compared to the five-year average (2015 to 2019) of 2,796, or 18% more. That is today’s trend in housing, an ultra-low supply of available homes matched up with fiery, hot, insane demand. With rising rates, the inventory will finally rise from its unparalleled, anemic low level, and demand will decline from its torrid pace. The result will be a market that is much more manageable to navigate, yet still a Hot Seller’s Market. Homes will still appreciate, just not at its current unparalleled pace. There will still be multiple offers, just a few generated on each property compared to the double digits of today.
For buyers, the answer is simple, do not wait to purchase. Waiting will be costly.
Active Listings
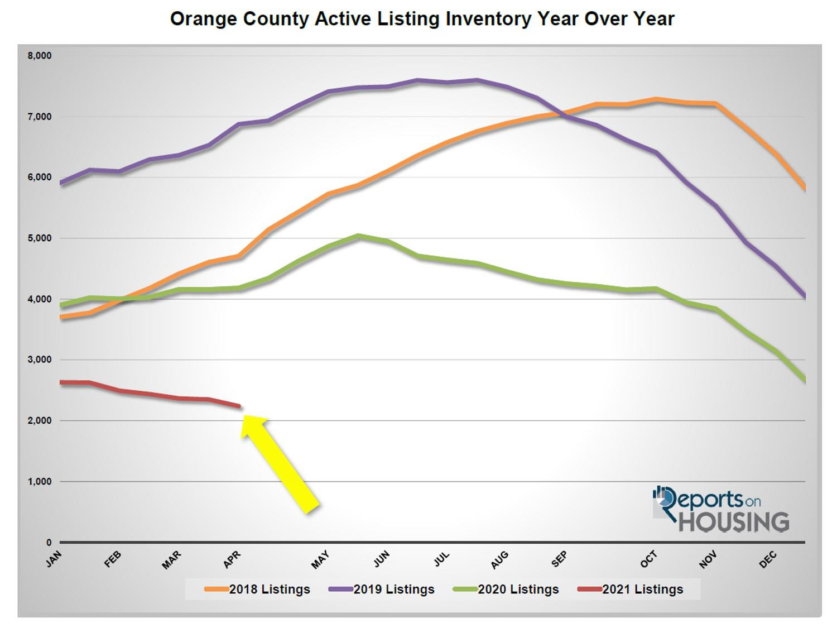
The current active inventory plunged another 5% in the past couple of weeks.
The active listing inventory in Orange County has already been at a record low level and it would be hard to imagine it dropping even further, but that is exactly what materialized. In the past two weeks, the inventory shed another 109 homes, down 5%, and now sits at 2,240. It is the lowest level since tracking began in 2004. Yet, more homes are finally entering the fray. In March, there were 19% more homes that were placed on the market compared to February. Now that spring has begun, expect more homes to come on the market from now through July, with May being the peak month. Many of these homes will be gobbled up as quickly as they come on due to the ferocious pace of demand. But that will evolve as mortgage rates climb and some buyers end their home buying search with the realization that their monthly payments are increasing too much. The inventory will rise a lot more noticeably during the Summer Market.
Comparing year over year data will not be accurate for the remainder of the year due to COVID-19 skewing the statistics last year. Taking the prior 5-year average from 2015 to 2019 is a far better comparison. During March, there were 342 fewer new FOR-SALE signs in Orange County, 9% less than that 5-year average. This trend started in January and has resulted in 611 fewer homes on the market during the first quarter of 2021, 6% less. It is due to the lack of available replacement homes that have many homeowners alarmed about selling. They are fearful that there will be “nothing to buy,” limiting the number willing to participate in a market with such an anemic level of available homes to purchase. Yet there are strategies to avoid getting burned in selling and then purchasing a replacement home. A bridge loan, a rent back, and accepting an offer contingent on finding a replacement home are a few sound strategies in navigating today’s insanely hot market. Last year to start April there were 4,183 homes on the market, 1,943 additional homes, or 87% more. The 5-year average from 2015 to 2019 is 5,552, an extra 3,312 homes, or 148% more. There were a lot more choices for buyers compared to today.
Demand
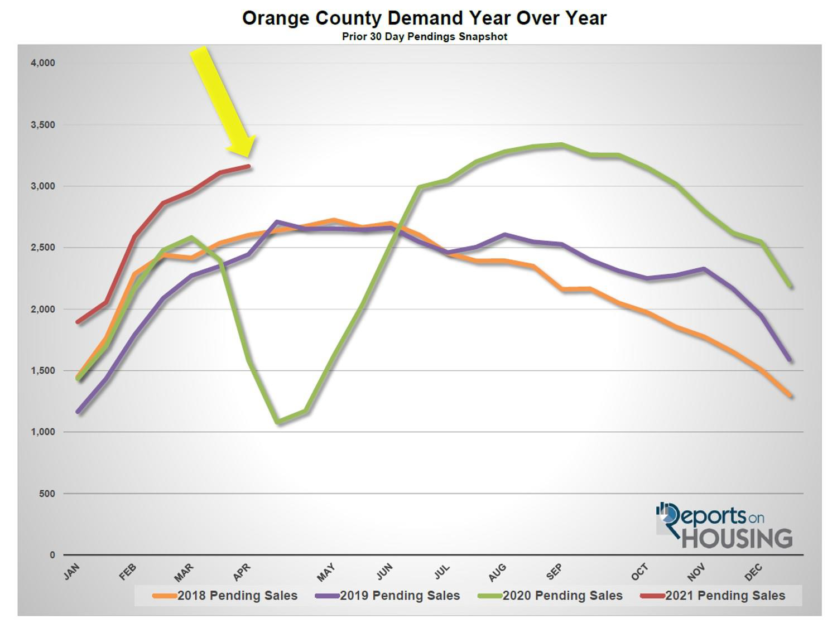
Demand continued to rise in past couple of weeks.
Demand, a snapshot of the number of new pending sales over the prior month, climbed from 3,110 to 3,162 in the past couple of weeks, adding 52 pending sales, up 2%. This is the strongest start to April since 2012. Demand is surging due to mortgage rates in the low 3% range. While rates may have risen to 3.18%, its highest level since last June, if it were not for the pandemic pushing rates to historically low levels, today’s rate would still be an all-time record low. Demand will continue to be juiced until mortgage rates eclipse 3.5% and continue to head higher later this year. That will occur on the backs for great economic news on the horizon. Until then, it will be more of the same, homes that enter the fray will procure way too many offers and home values will continue to soar.
Last year, demand was at 1,584 due to the start of the pandemic, that is 1,578 fewer pending sales compared to today, or 50% less. The 5-year average from 2015 through 2019 was at 2,796 pending sales, 366 fewer pending sales, or 12% less. In the past two-weeks the Expected Market Time (the number of days to sell all Orange County listings at the current buying pace) dropped from 23 to 21 days, its lowest level since tracking began in 2004, and is a very Hot Seller’s Market (less than 60 days) where there are a ton of showings, sellers get to call the shots during the negotiating process, multiple offers are the norm, and home values are rising rapidly. Last year the Expected Market Time was at 79 days, slower than today. The 5-year average from 2015 through 2019 was at 60 days, much slower than today, but still a Hot Seller’s Market.
Luxury End
The luxury market did not change much in the past couple of weeks.
In the past two weeks the luxury inventory of homes priced above $1.5 million decreased by 11 homes, down 1%, and now sits at 887. At the same time, luxury demand increased by 2 pending sales, nearly unchanged, and now sits at 479. With the inventory rising demand not changing much, the overall Expected Market Time for luxury homes priced above
$1.5 million remained unchanged at 56 days in the past couple of weeks. Luxury is hot and it will continue to be hot through the Spring and Summer Markets.
Expect the luxury market to continue to improve over the next couple of months, peaking between now and mid-May.
Year over year, luxury demand is up by 347 pending sales, or 263%, and the active luxury listing inventory is down by 288 homes, or 25%. The Expected Market Time last year was at 267 days, substantially slower than today amidst the backdrop of the pandemic. Year over year statistics for luxury will be much more comparable starting in July. For homes priced between $1.5 million and $2 million, the Expected Market Time increased from 31 to 32 days. For homes priced between $2 million and $4 million, the Expected Market Time decreased from 58 to 53 days. For homes priced above $4 million, the Expected Market Time increased from 116 to 132 days. At 132 days, a seller would be looking at placing their home into escrow around August 2021.
Orange County Housing Summary
- The active listing inventory decreased by 109 homes in the past two-weeks, down 5%, and now totals 2,240, its lowest level since tracking began in 2004. In March, there were 9% fewer homes that came on the market compared to 5-year average between 2015 to 2019 (2020 was skewed do to COVID-19), 342 less. Last year, there were 4,183 homes on the market, 1,943 additional homes, or 87% more.
- Demand, the number of pending sales over the prior month, increased by 52 pending sales in the past two- weeks, up 2%, and now totals 3,162, its strongest start to April since 2012. The ultra-low mortgage rate environment is continuing to fuel today’s exceptional demand. Last year, there were 1,584 pending sales, 50% fewer than today. Keep in mind, it was the start of the pandemic too, which negatively affected demand through May.
- The Expected Market Time, the number of days to sell all Orange County listings at the current buying pace, decreased from 23 days to 21, an extremely Hot Seller’s Market (less than 60 days) and the strongest reading since tracking began in 2004. It was at 79 days last year, slower than today.
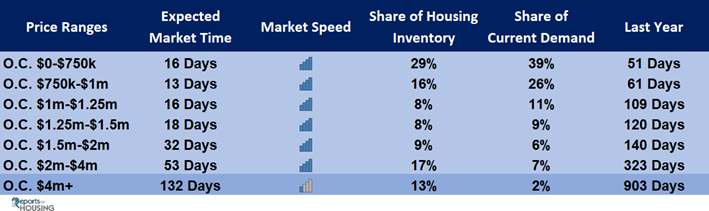
- For homes priced below $750,000, the market is a Hot Seller’s Market (less than 60 days) with an Expected Market Time of 16 days. This range represents 29% of the active inventory and 39% of demand.
- For homes priced between $750,000 and $1 million, the Expected Market Time is 13 days, a Hot Seller’s Market. This range represents 16% of the active inventory and 26% of demand.
- For homes priced between $1 million to $1.25 million, the Expected Market Time is 16 days, a Hot Seller’s Market.
- For homes priced between $1.25 million to $1.5 million, the Expected Market Time is 18 days, a Hot Seller’s Market.
- For homes priced between $1.5 million and $2 million, the Expected Market Time increased from 31 to 32 days. For homes priced between $2 million and $4 million, the Expected Market Time decreased from 58 to 53 days. For homes priced above $4 million, the Expected Market Time increased from 116 to 132 days.
- The luxury end, all homes above $1.5 million, accounts for 39% of the inventory and only 15% of demand.
- Distressed homes, both short sales and foreclosures combined, made up only 0.4% of all listings and 0.4% of demand. There are only 4 foreclosures and 4 short sales available to purchase today in all of Orange County, 8 total distressed homes on the active market, down 3 from two-weeks ago. Last year there were 45 total distressed homes on the market, more than today.
- There were 2,283 closed residential resales in February, 12% more than January 2020’s 2,044 closed sales. January marked a 1% rise over January 2021. The sales to list price ratio was 98.8% for all of Orange County. Foreclosures accounted for just 0.09% of all closed sales, and short sales accounted for 0.17%. That means that 99.74% of all sales were good ol’ fashioned sellers with equity.
Have a great week. Sincerely,
Steven Thomas
Quantitative Economics and Decision Sciences
Cell 949.874.8221 Copyright 2021- Steven Thomas, Reports On Housing – All Rights Reserved. This report may not be reproduced in whole or part without express written permission by author.