
August 23, 2021
Although home values have been skyrocketing at a record
pace, eating into affordability, the housing market is not
going to cool anytime soon.
Housing Will Remain Hot
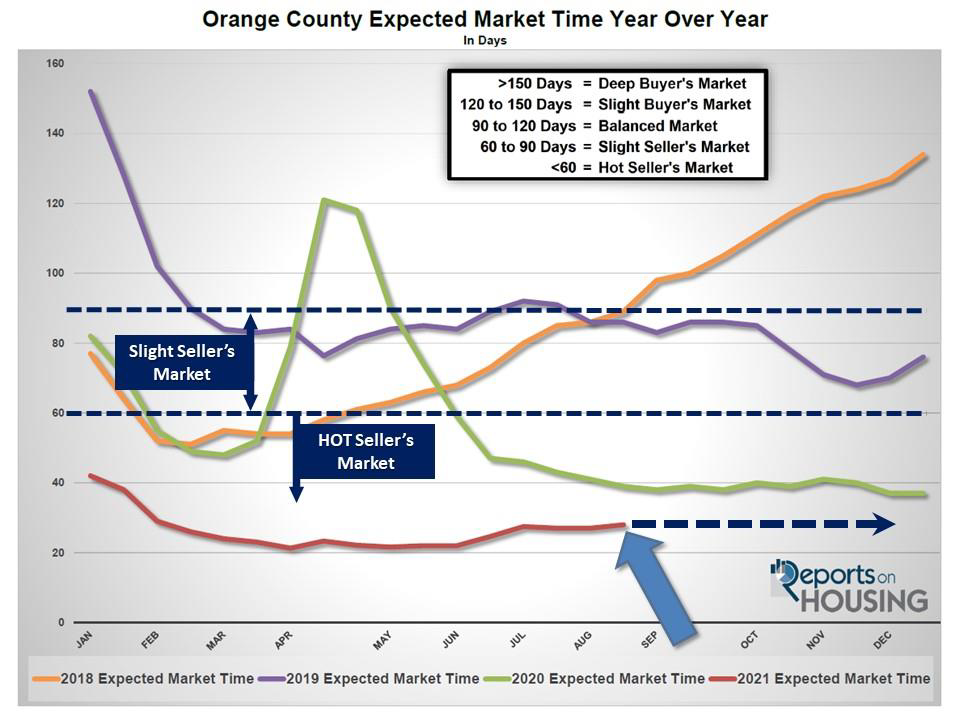
The Expected Market Time has remained at unprecedented low levels and will not budge much for the remainder of the year.
Everybody looks forward to the Super Bowl. It is not just the excitement surrounding championship football, or the extravagant, over-the-top television commercials, or getting together with family and friends to enjoy the game. It is also about the bountiful feast, the plethora of food options. Hamburgers, hot dogs, chicken wings, several varieties of chips, nachos, chili-cheese dip, spinach-artichoke dip, cheese, crackers, nuts, pretzels, beer, soda, brownies, cookies, candy, and so much more. By the second half of the game, it gets harder and harder to dip just one more corn chip into the chili-cheese dip. It is an unhealthy pace in eating for one afternoon per year.
Similarly, with market time at unprecedented low levels, home values are shooting skyward, eroding home affordability at an unhealthy pace. Yet, it has been going strong since July of last year and will not slow for the rest of the year and into 2022. It is great to be a homeowner, but for those aspiring to own a home sometime in the future, the goal is getting harder and harder to reach, and, for some, out of reach.
It is important to clear the air and explain that just because housing is appreciating at an unhealthy rate, it does not mean that a bubble is inflating or that housing will inevitably crash. There is absolutely nothing in the charts and data that statistically support that conclusion. Instead, housing is becoming unattainable for more and more first-time homebuyers and renters.
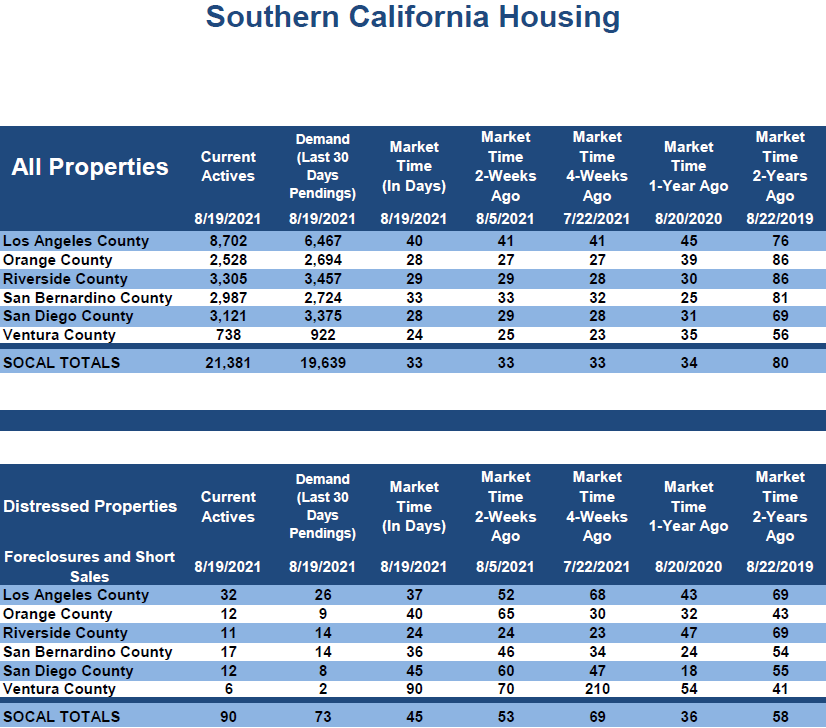
In looking at the Expected Market Time (the amount of time between hammering in the FOR-SALE sign to opening escrow), it has remained below 45-days since the end of July 2020. Anything below 45-days indicates an insane, scorching hot housing market where buyers are tripping over themselves to be the first to see a home that just hit the market, multiple offers is the norm, and homes are selling above their list prices. In fact, according to the California
Association of REALTORS®, 70% of all closed sales in the month of July sold above their asking prices. It has been 10-consecutive months that more than 50% of closed sales sold above their asking price. Today’s 28-day Expected Market Time is far below that 45-day threshold; the lower the market time, the hotter the market.
Housing will remain hot because the supply crisis will continue into 2022 and the historically low mortgage rate environment is not going to fade away anytime soon. It is all boils down to good old-fashioned supply and demand. So, how did the supply crisis materialize? It started in January 2020. The 3,901-home level was the third lowest start to a year behind 2013 and 2018. Then, when the economy shut down in March 2020 with the beginning of the pandemic and a national stay-at-home order, fewer homeowners opted to sell their homes. In 2020, there were 7% fewer homes that came on the market in Orange County compared to the 3-year average between 2017 and 2019, which equated to 2,611 missing FOR-SALE signs.
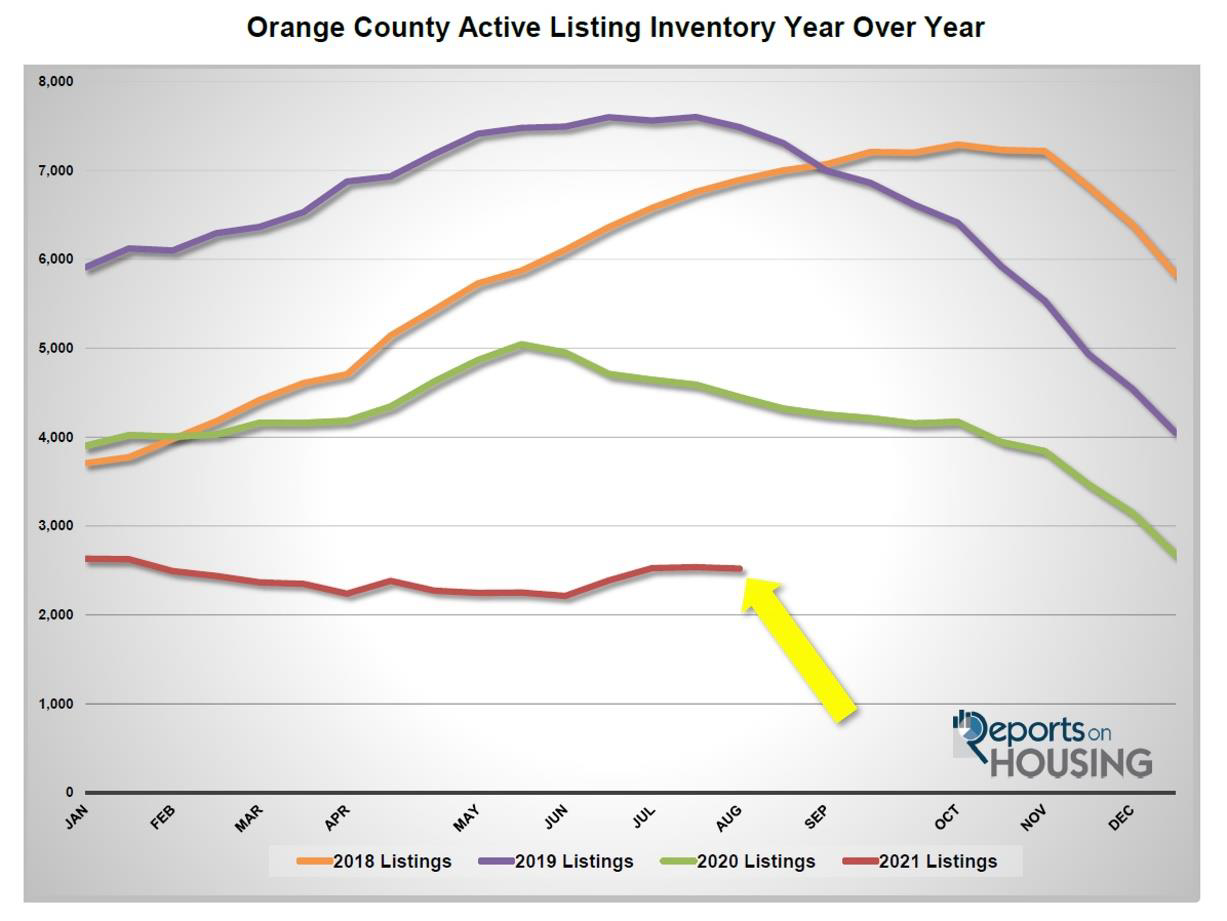
After reaching a peak of 5,044 homes in May 2020 (peaks typically occur between July and August), its lowest peak since tracking began in 2004 by a landslide, the inventory shed an additional 2,369 homes, or 47%, by year’s end. That paved the way to a record low start to 2021 with 2,522 homes, 20% below the prior 3,161 home record low start in 2013. From January through July there were 1,562 fewer new FOR-SALE signs in Orange County, 6% less than the 3-year average from 2017 to 2019. While it may not seem like much of a difference, it is still adding to the scarcity of available homes and exasperating the inventory crisis. Today there are only 2,528 homes available for buyers, the lowest level for this time of the year since tracking began in 2004, and 41% below last year’s record low level of 4,320 homes. The 3-year average for homes available at this time of the year (2017 to 2019) was 6,723, or 166% more, two-and-a-half times today’s anemic level.
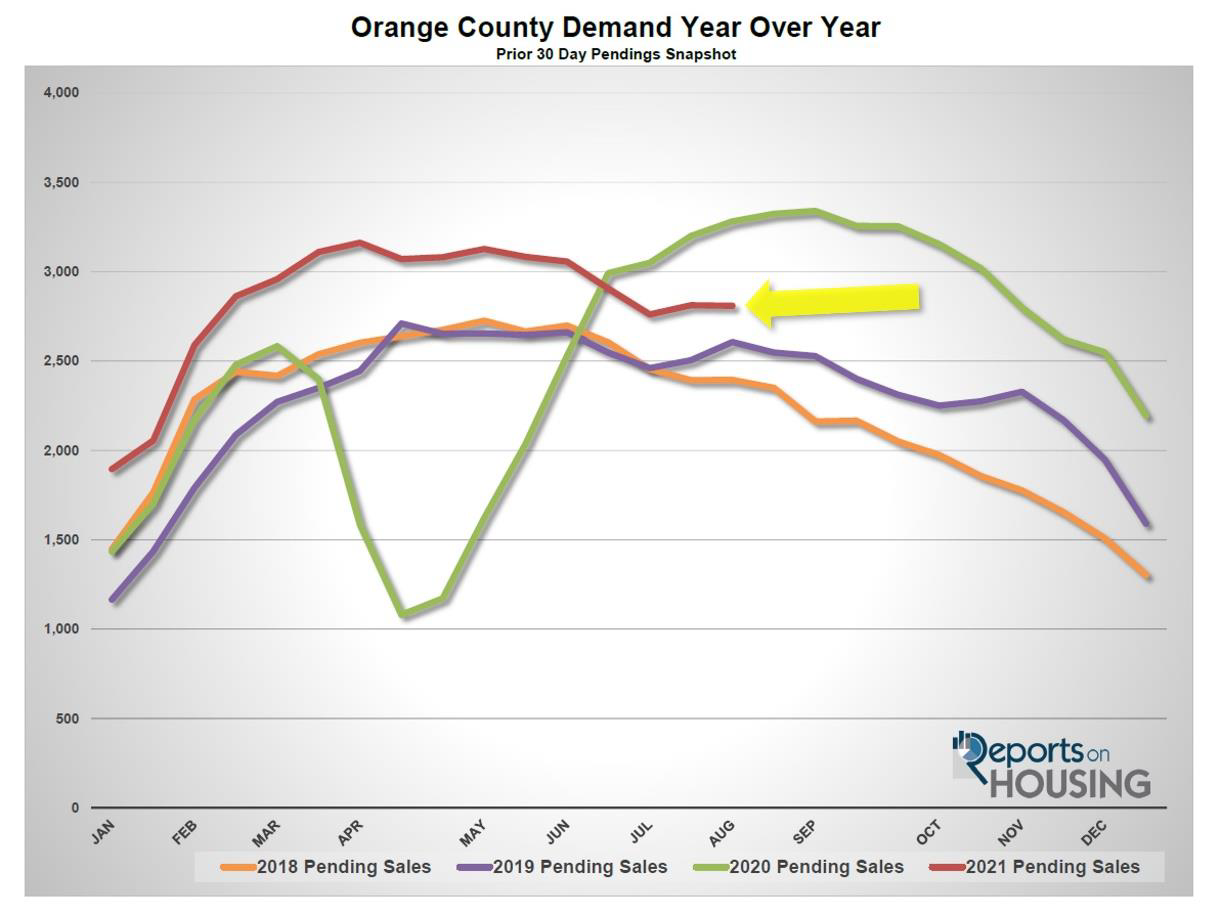
The demand side of the equation is not going to change much at all. It will continue to be elevated due to persistent, record-low rates. The only way the market would slow would be with rising rates, which would further erode home affordability and slow demand. Payments would rise and many buyers would stop their search. However, rates are no longer forecasted to rise through the end of the year and into 2022; thus, demand (the number of new escrows in the prior month) will remain strong. Orange County is one of three Southern California counties where the current demand reading is higher than the current active inventory, meaning that the last 30-days of pending sales activity is higher than the number of available homes to purchase today. That phenomenon occurred for the first time since tracking began in February of this year. The ultra-low supply matched up against record-low mortgage rate induced demand has led to the skyrocketing home values. The continued imbalance will continue to drive appreciation.
Soaring home values is not healthy and ultimately will limit the number of buyers able to purchase. While affordability is not yet an issue due to record low rates (affordability factors prices, rates, and incomes), eventually values in Orange County will climb to a point where the housing market will slow as more and more buyers stop their search due to monthly payments that are just out of reach. When that occurs depends upon how high values climb, any eventual rise in rates, and the limits to rising incomes. For now, it is not an issue, and the current pace will not change for the rest of 2021.
Active Listings
The current active inventory remained unchanged in the past couple of weeks.
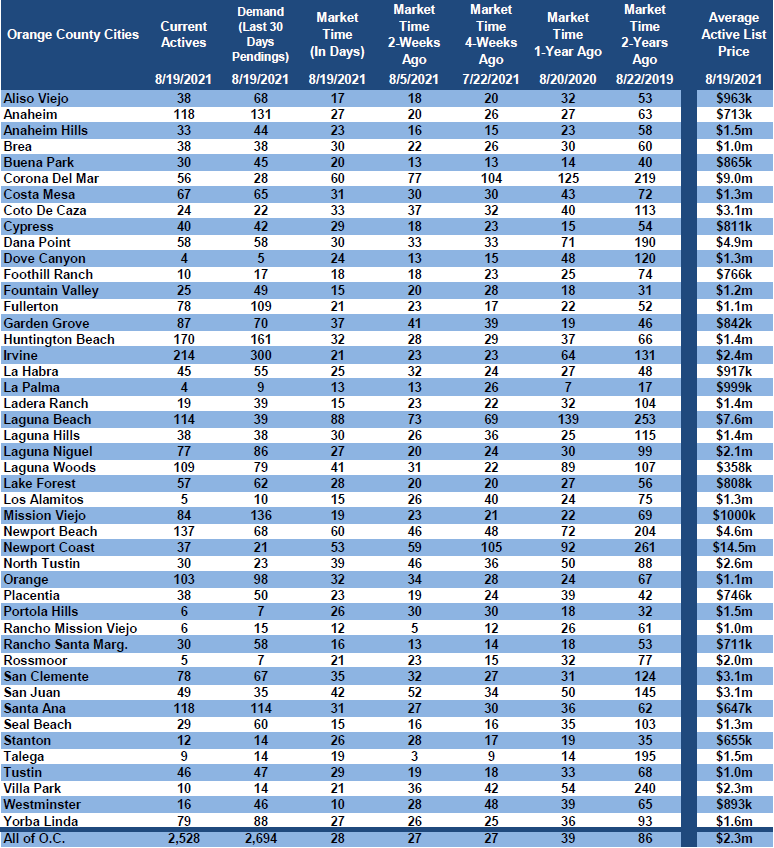
The active listing added 8 homes in the past couple of weeks, nearly unchanged, and now sits at 2,528 homes. The inventory has not changed much at all since the beginning of July when it reached 2,528 homes, identical to today. It appears as if the Orange County active listing inventory may have reached its peak at the end of July at 2,537 homes. Only time will tell. Typically, the active listing inventory peaks between July and August. Now that the kids have gone back to school, the housing market transitions to the Autumn Market when fewer homes come on the market. It is less advantageous for families to move while the kids are in school; instead, they look to the following Spring Market, the peak season to sell a home.
Last year in mid-August, there were 4,320 homes on the market, 1,792 additional homes, or 71% more.
Since comparing year over year data in housing is not accurate this year due to COVID-19 skewing the data last year, it is much better to compare current levels to the 3-year average from 2017 to 2019. In July, there were 152 fewer new FOR-SALE signs in Orange County, 4% less than the 3-year average. At this point, ever missing FOR-SALE just adds to the inventory crisis.
Demand
Demand dropped by 4% in the past couple of weeks.
Demand, a snapshot of the number of new pending sales over the prior month, decreased from 2,809 to 2,694 in the past couple of weeks, shedding 115 pending sales, down 4% and its largest drop since the start of July. Demand readings are a bit subdued due to the lack of homes available for buyers today. If there were more homes to choose from, the demand readings would certainly be a lot higher. Fewer homes available limits the number of potential escrows. With mortgage rates remaining at record low levels, homes will continue to be placed into escrow nearly as fast as they come on the market. According to Freddie Mac’s Primary Mortgage Market Survey®, rates were at 2.86% as of August 19th and have remained below 3% since the start of July. With the start of the Autumn Market, expect demand to slowly drop from now until mid-November when it picks up steam and drops to the lowest point by year’s end.
Last year, demand was at 3,323 and climbing, 23% more than today. It did not reach a peak until the start of September, a four month delay due to COVID.
With a large drop in demand in the past couple of weeks, the Expected Market Time (the number of days to sell all Orange County listings at the current buying pace) increased from 27 to 28 days. At 28 days, the housing market is nothing short of an extremely insane, Hot Seller’s Market (less than 60 days) where there are a ton of showings, sellers get to call the shots during the negotiating process, multiple offers are the norm, and home values are rising rapidly. Last year the Expected Market Time was at 39 days. The 3-year average from 2017 through 2019 was at 79 days, much slower than today, but still a Slight Seller’s Market.
Luxury End
The luxury market did not change much in the past couple of weeks.
In the past two weeks the luxury inventory of homes priced above $1.5 million increased by 3 homes, nearly unchanged, and now sits at 794. At the same time, luxury demand decreased by 3 pending sales, down 1%, and now sits at 434. With a slight increase in the supply and a slight decrease in demand, the overall Expected Market Time for luxury homes priced above $1.5 million remained increased from 54 to 55 days, a very Hot Seller’s Market for luxury.
Expect the luxury market to slightly cool as housing transitions into the Autumn Market.
Year over year, luxury demand is up by 38 pending sales, or 10%, and the active luxury listing inventory is down by 523 homes, or 40%. The Expected Market Time last year was at 100 days, extremely hot for luxury, and dropping fast due to the delay in the Spring Market due to COVID. Still, it was nearly double where it is right now, indicating just how hot the luxury market is today.
For homes priced between $1.5 million and $2 million, the Expected Market Time decreased from 31 to 25 days. For homes priced between $2 million and $4 million, the Expected Market Time increased from 52 to 62 days. For homes priced above $4 million, the Expected Market Time increased from 128 to 132 days. At 132 days, a seller would be looking at placing their home into escrow around January 2022.
Orange County Housing Summary
• The active listing inventory increased by 8 homes in the past two-weeks, nearly unchanged, and now totals 2,528. In July, there were 4% fewer homes that came on the market compared to the 3-year average between 2017 to 2019 (2020 was skewed do to COVID-19), 152 less. Last year, there were 4,320 homes on the market, 1,792 additional homes, or 71% more.
• Demand, the number of pending sales over the prior month, decreased by 115 pending sales in the past two-weeks, down 4%, and now totals 2,694. Last year, there were 3,323 pending sales, 23% more than today, due to a delayed Spring Market.
• With not much of a change in supply or demand, the Expected Market Time, the number of days to sell all Orange County listings at the current buying pace, increased from 27 to 28 days in the past couple of weeks, an extremely Hot Seller’s Market (less than 60 days). It was at 39 days last year slightly slower than today.
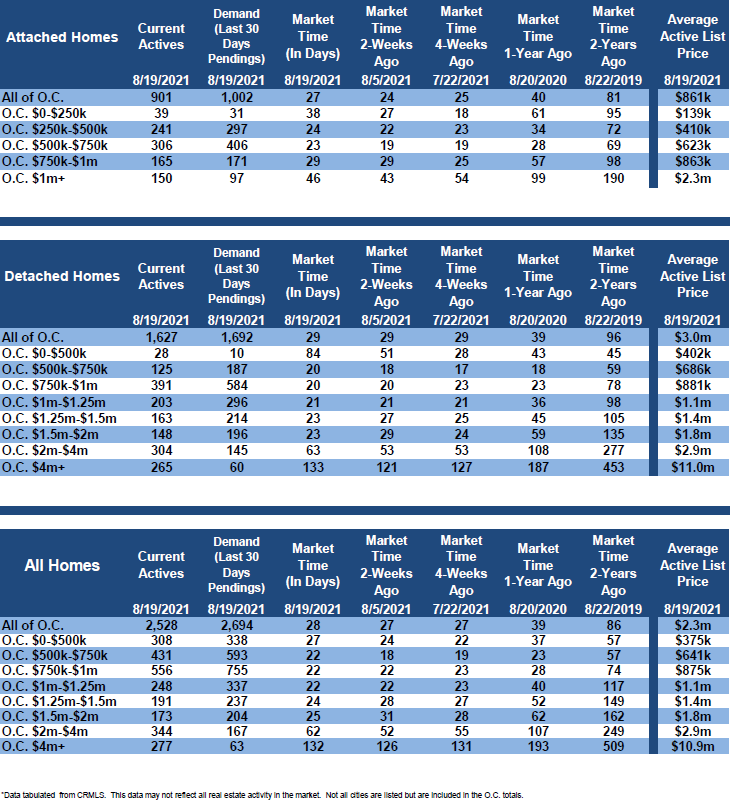
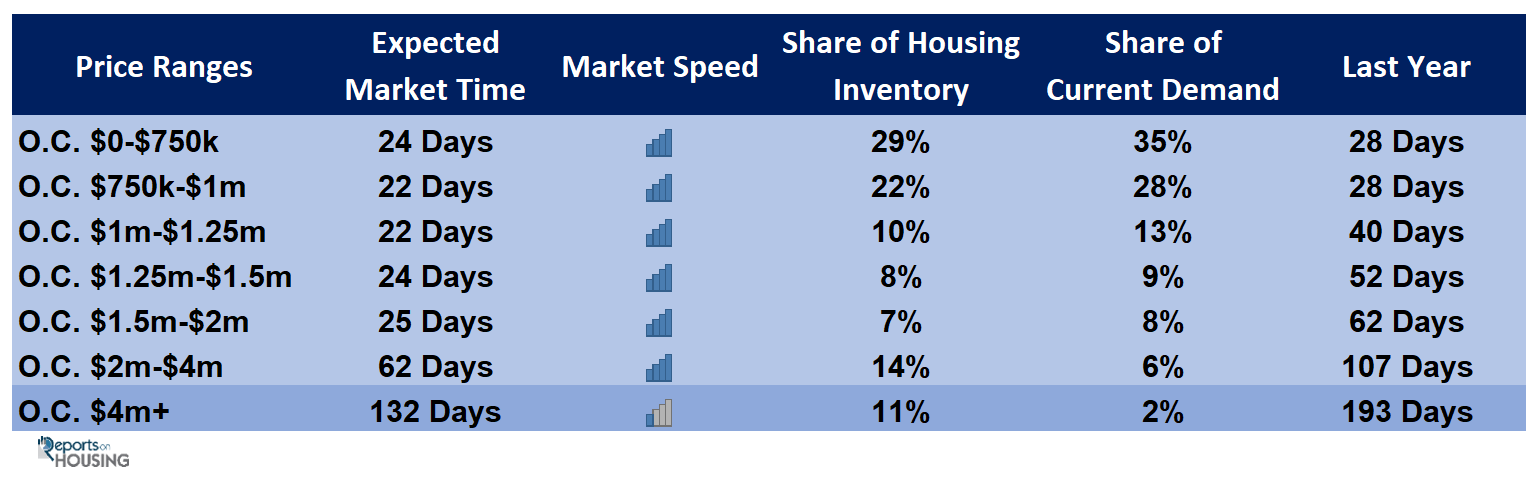
• For homes priced below $750,000, the market is a Hot Seller’s Market (less than 60 days) with an Expected Market Time of 24 days. This range represents 29% of the active inventory and 35% of demand.
• For homes priced between $750,000 and $1 million, the Expected Market Time is 22 days, a Hot Seller’s Market. This range represents 22% of the active inventory and 28% of demand.
• For homes priced between $1 million to $1.25 million, the Expected Market Time is 22 days, a Hot Seller’s Market. This range represents 10% of the active inventory and 13% of demand.
• For homes priced between $1.25 million to $1.5 million, the Expected Market Time is 24 days, a Hot Seller’s Market. This range represents 8% of the active inventory and 9% of demand.
• For homes priced between $1.5 million and $2 million, the Expected Market Time decreased from 31 to 25 days. For homes priced between $2 million and $4 million, the Expected Market Time increased from 52 to 62 days. For homes priced above $4 million, the Expected Market Time increased from 128 to 132 days.
• The luxury end, all homes above $1.5 million, accounts for 31% of the inventory and 16% of demand.
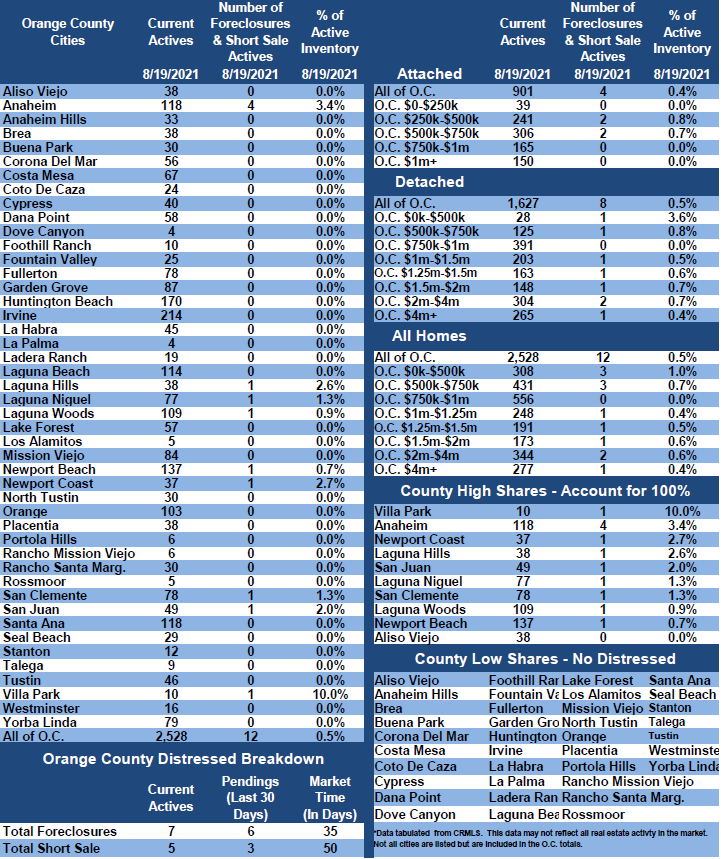
• Distressed homes, both short sales and foreclosures combined, made up only 0.5% of all listings and 0.3% of demand. There are only 7 foreclosures and 5 short sales available to purchase today in all of Orange County, 12 total distressed homes on the active market, down 1 from two-weeks ago. Last year there 15 total distressed homes on the market, very similar to today.
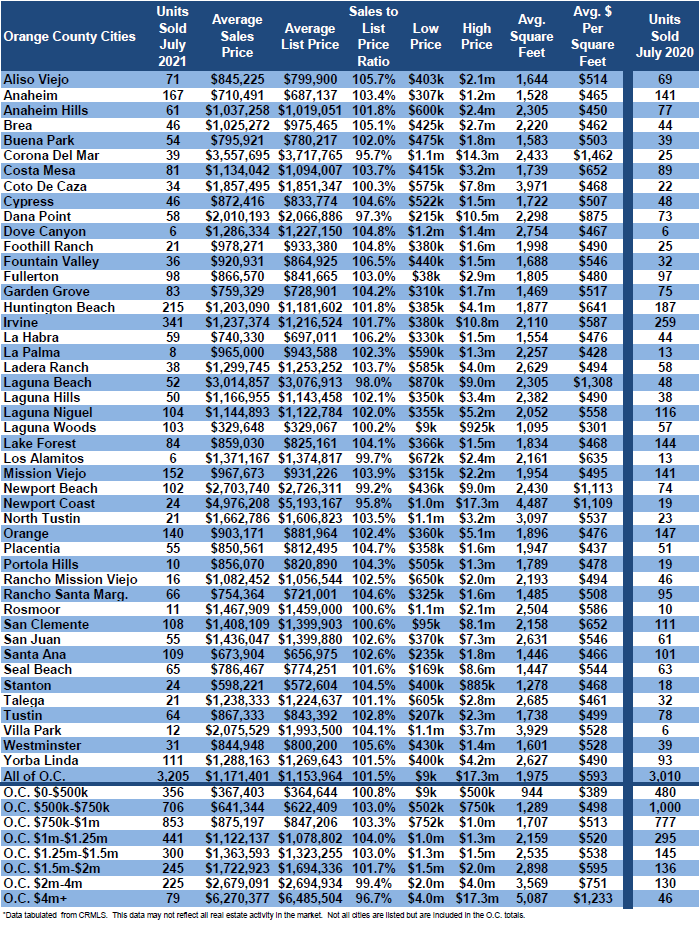
• There were 3,205 closed residential resales in July, 6% more than July 2020’s 3,011 closed sales. July marked a 10% drop compared to June 2021. The sales to list price ratio was 101.5% for all of Orange County. Foreclosures accounted for just 0.2% of all closed sales, and short sales accounted for 0.2%. That means that 99.6% of all sales were good ol’ fashioned sellers with equity.
Have a great week.
Sincerely,
Steven Thomas
Quantitative Economics and Decision Sciences
Cell 949.874.8221
Copyright 2021- Steven Thomas, Reports On Housing – All Rights Reserved. This report may not be reproduced in whole or part without express written permission by author.