May 2, 2022
Higher 30-year mortgage rates are having a major impact on
Orange County demand, now at levels far below typical spring
averages.

In 2002, the Los Angeles Angels won the World Series for the first time in franchise history. The next year they missed the playoffs completely with a losing record. After hoisting the Commissioner’s Trophy the year before as champions of the world, they missed postseason play due to a slump in wins to close out the year from July through September. The Orange County housing market is amid a similar slump in the middle of the Spring Market following the best year for local real estate since 2005.
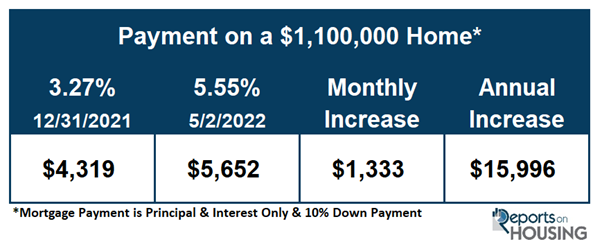
According to Mortgage News Daily, 30-year mortgage rates have risen from 3.27% on December 31st to 5.55% today, a climb of more than 2.25%. Rapidly rising rates eat into affordability significantly. For example, the monthly mortgage payment for a $1.1 million purchase with 10% down has risen from $4,319 on December 31st, when rates were at 3.27%, to $5,652 per month today at 5.55%. That is a $1,333 per month rise, or nearly $16,000 per year. The significant change occurred in just four short months.
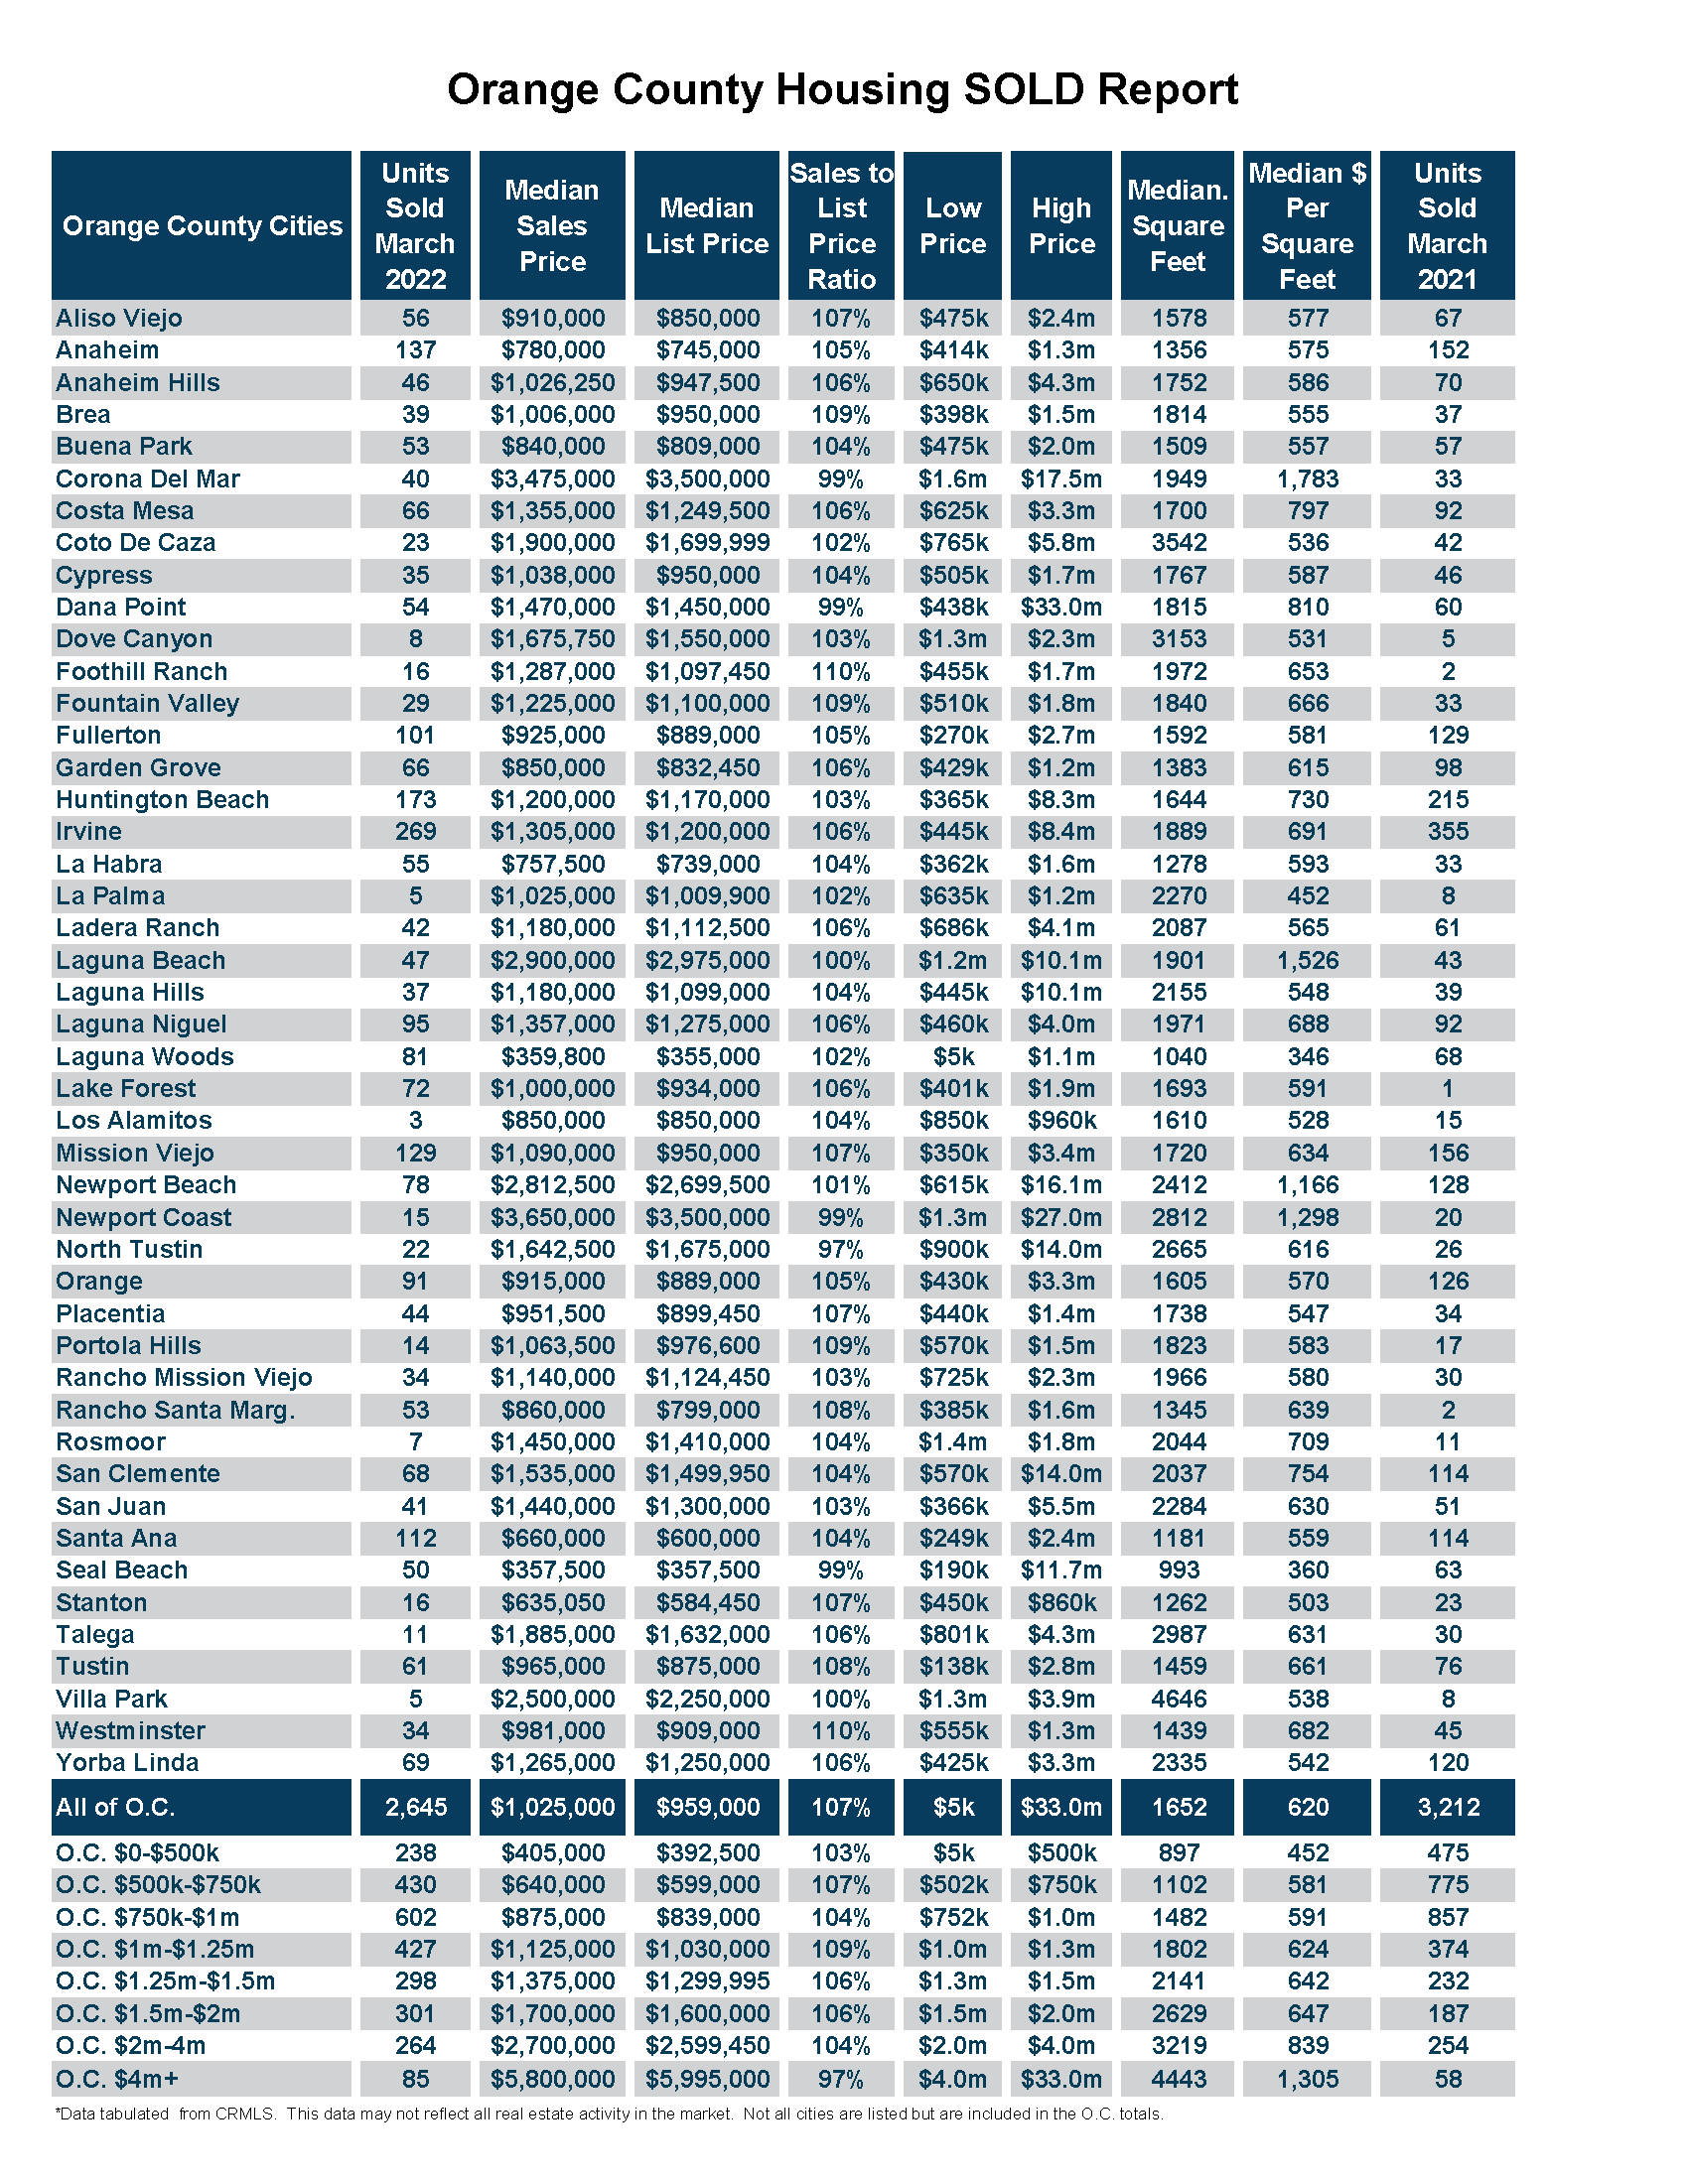
California Association of REALTORS® reported that the median detached home in Orange County rose to $1,305,000 in March, up 27% in contrast to last year’s $1,025,000 median. At these levels, rising mortgage rates significantly impact payments.
In response rising rates, demand has slowed considerably. Demand, the prior 30-days of pending sale activity, has been on the decline after peaking on March 31st, shedding 6%, or 132 pending sales, since. Usually demand peaks from the end of April to the end of May. This year, with rapidly rising rates, many buyers backed off purchasing, the peak occurred early, and not everything is selling instantly.
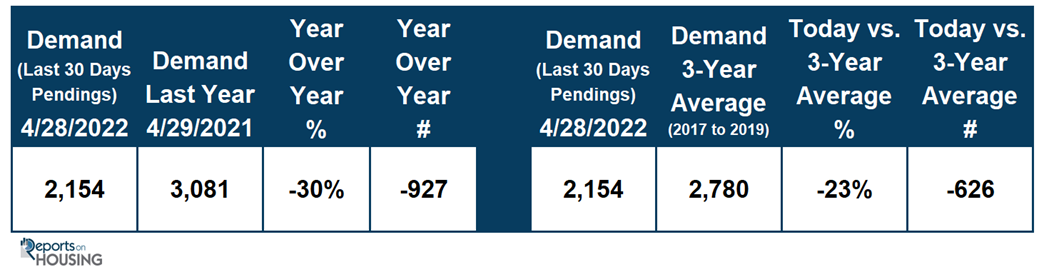
Today’s demand readings are muted compared to last year, 2,154 versus 3,081. That is down 30%, or 927 pending sales. Keep in mind that last year was the best year for Orange County housing since 2005. Yet, the 3-year average for demand prior to COVID (2017 to 2019) was 2,780. Today’s demand is down 23%, or 626 pending sales, compared to the average.
Demand has stalled this spring. During the Spring Market, demand normally is on the rise along with the active listing inventory. More homes come on the market during the spring than any other time of the year. There is cyclically more escrow activity because that is when families desire to open escrow in hopes of closing and moving at the end of spring or during the summer when the kids are out of school. The housing market cyclically revolves around families and the school year. Spring is when there is the most activity, followed by summer. Then housing decelerates during the autumn after the kids go back to school. It then downshifts further during the holidays, the slowest time of the year.
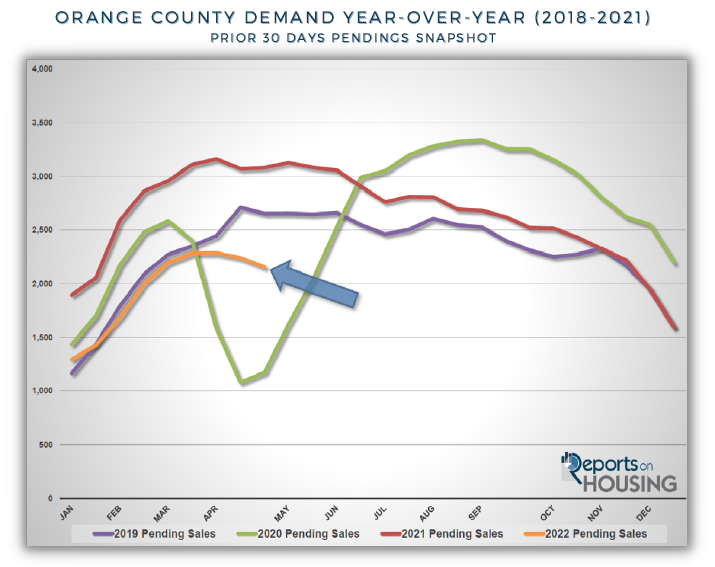
This year is a bit different. Housing is experiencing substantially less activity. Low mortgage rates fueled the explosion in demand in 2020 and 2021. Today’s considerably higher mortgage rate environment has cooled demand. As a result, the active inventory has grown by 552 homes in the past month, up 36%, and the Expected Market Time (the time between pounding in the FOR-SALE sign to opening escrow) has risen from 20 to 29 days. The market is still an insanely Hot Seller’s Market, and the inventory is at unprecedented low levels, but the market is currently evolving fast. The market will continue to cool, demand will drop, the inventory will surge higher, and the Expected Market Time will rise.
Housing is moving away from everything selling in an instant. Instead, carefully arriving at the asking price will swiftly become the fundamental initial step in successfully selling. The housing inventory will grow on the backs of homes that will not sell. Homes in inferior locations, like backing to a busy street, need to be priced according to their inferior location. Homes that are in poor condition and need a lot of work must adjust their prices appropriately. Sellers who OVERPRICE their homes will sit on the market until they adjust to their Fair Market Value. Housing will no longer absorb overpriced homes, or homes in poor condition or a poor location.
Demand is slumping. Along with slumping demand comes a paradigm shift, a change in the way buyers and sellers will approach the market to achieve their real estate goals.

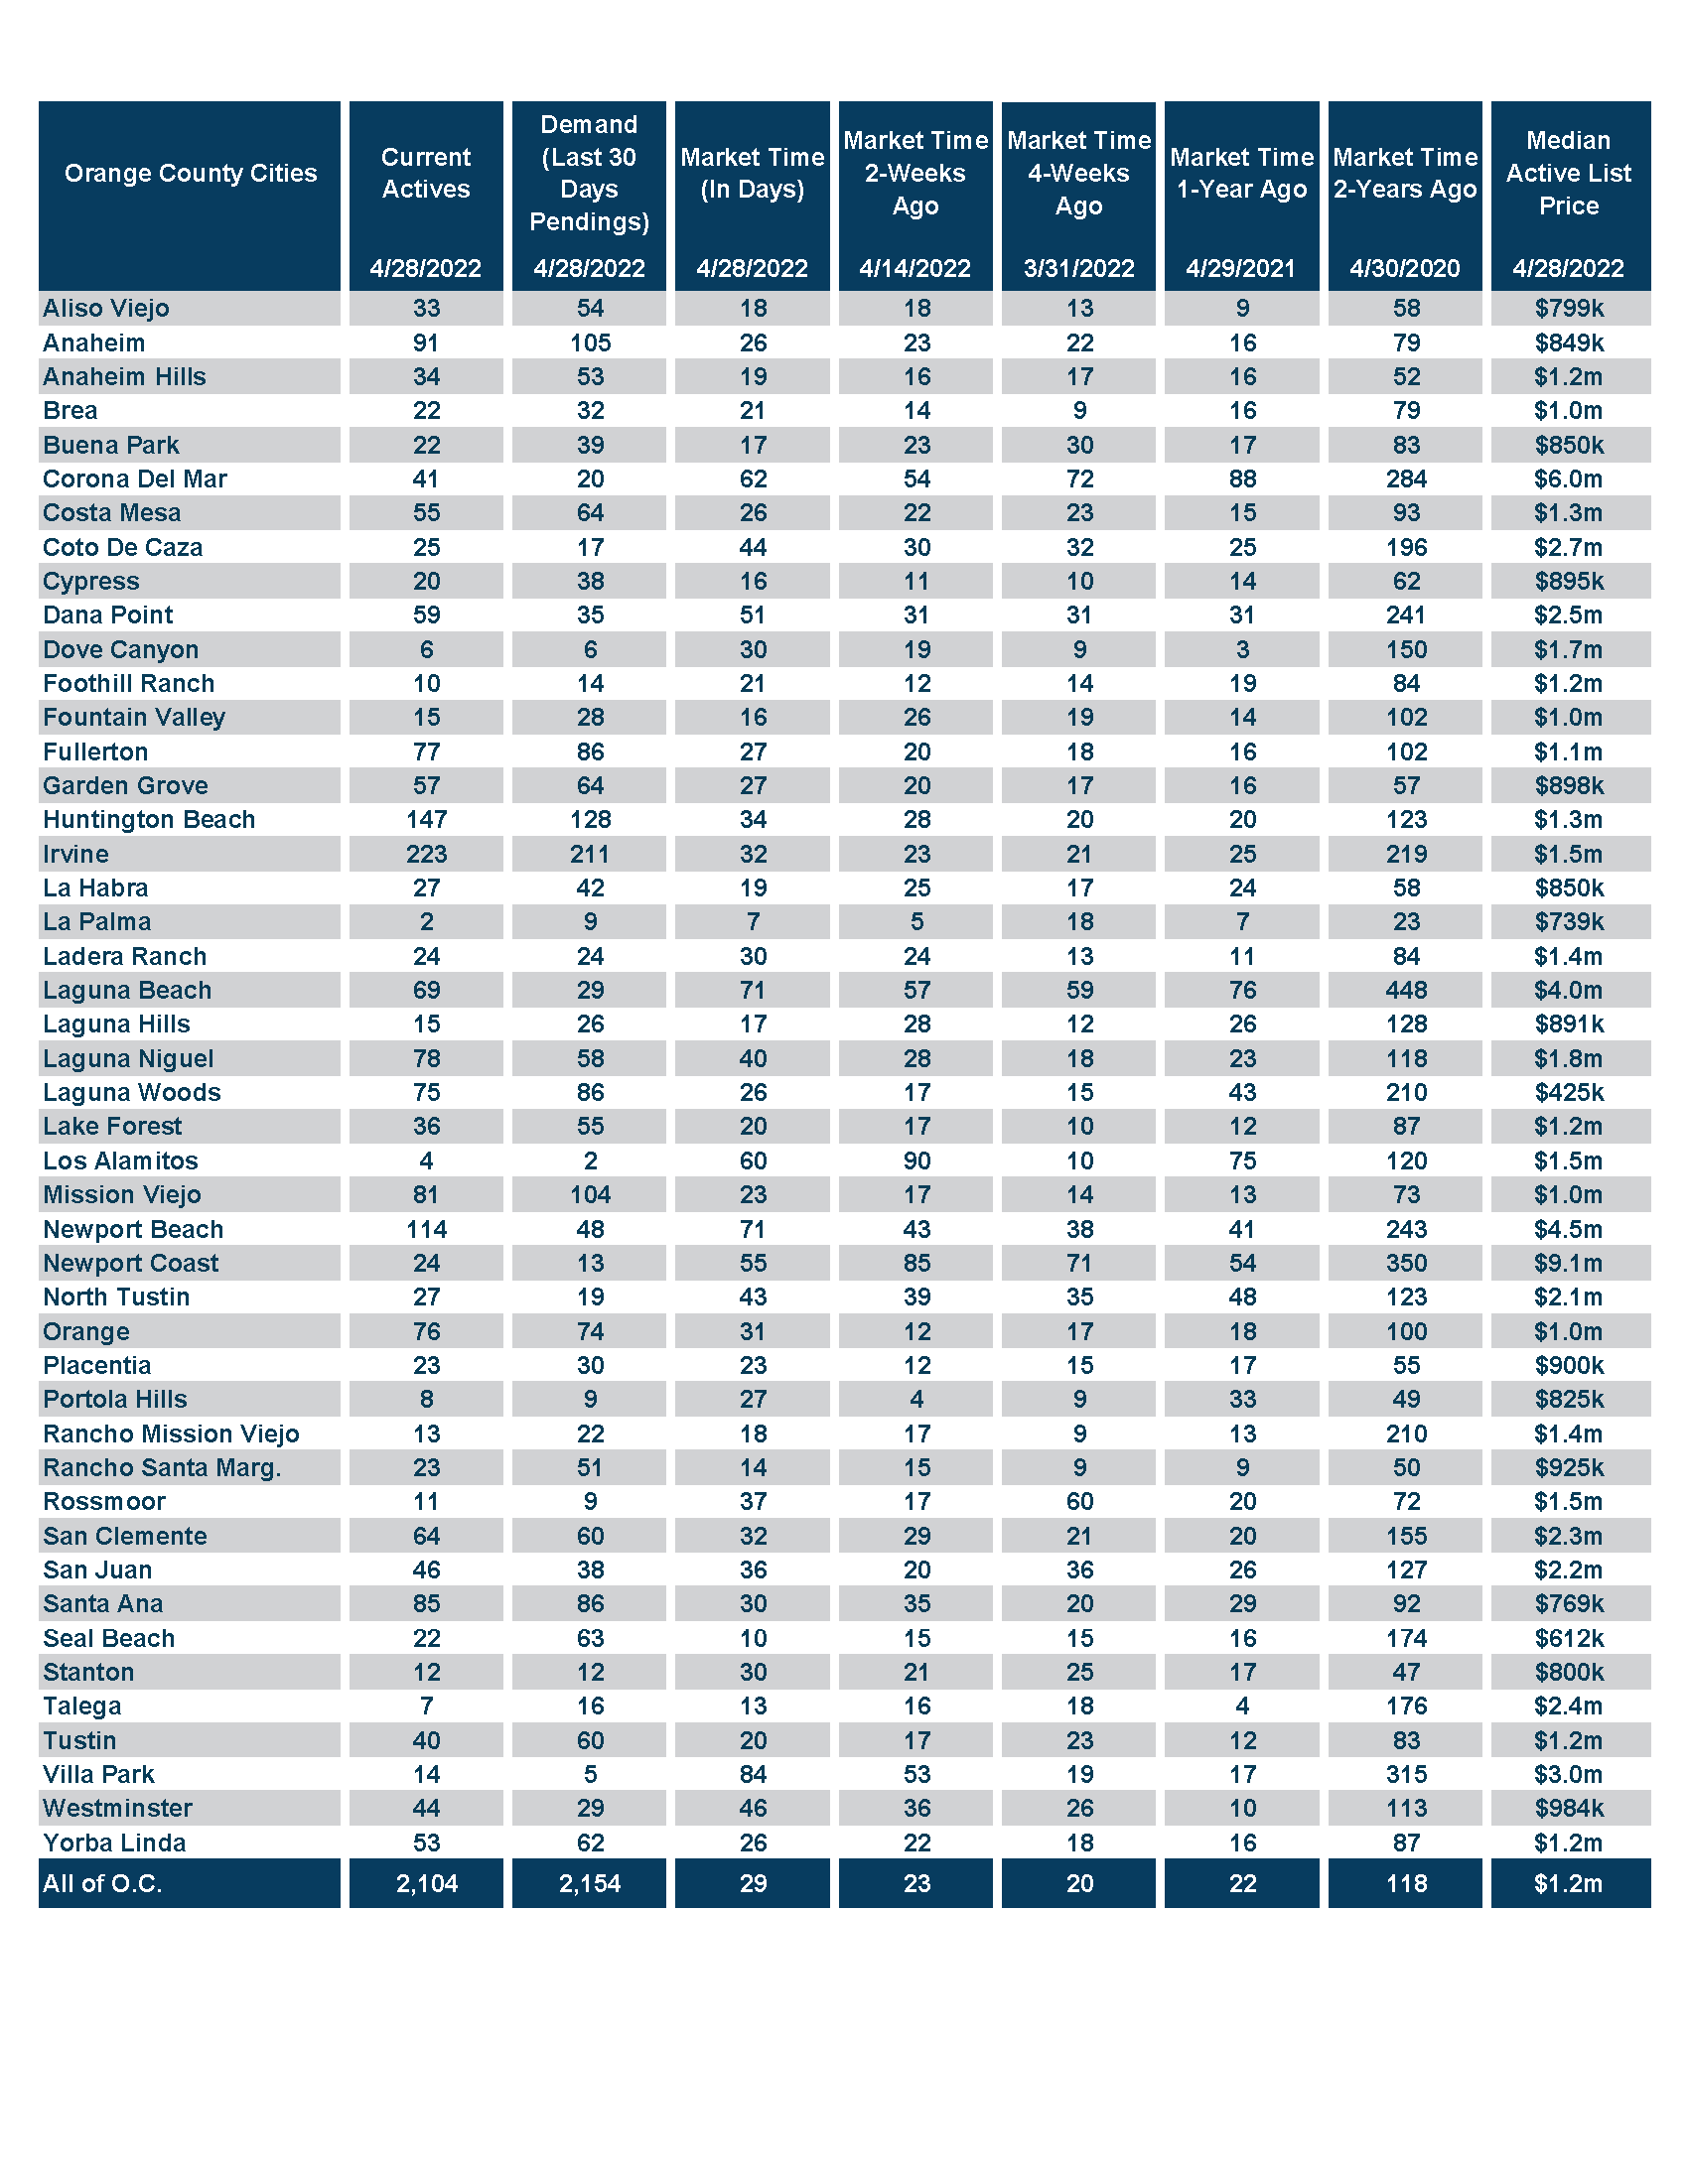
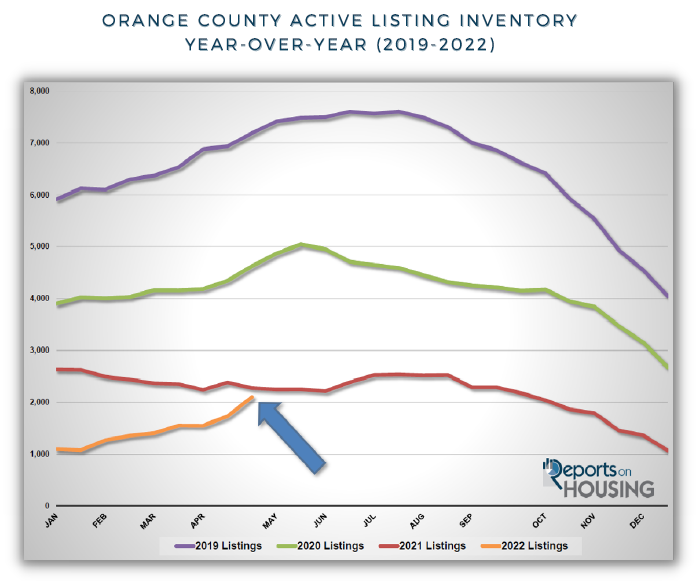
The active listing inventory surged higher, adding 372 homes in the past couple of weeks, up 21%, and now sits at 2,104 homes, climbing above the 2,000-home threshold for the first time since last October, six months ago. It was the largest two week rise since April 2018. Yet, it is still its lowest level for this time of year since tracking began in 2004. It is lower than last year at this time, but that should change within the next couple of weeks. That would mark the first time that the number of homes on the market will be higher than the prior year dating back to August 2019. With demand cooling due to higher mortgage rates, the inventory can advance higher at a more rapid rate. This will continue throughout the Spring and Summer Markets, which is when more homes are placed on the market than any other time of the year. As more homes enter the fray, they will be greeted with more cautious demand, buyers unwilling to stretch much above the asking price and unwilling to pay much more than the most recent closed or pending sale. Homeowners who stretch the asking price and overprice their homes will accumulate on the market without success and the inventory will grow. Sellers must approach pricing very carefully and will no longer get away with testing the market at a much higher price. Price reductions will become more common as the rest of this year unfolds and sellers will miss the absolute best time to take advantage of the market and all its fanfare, the initial couple of weeks in coming on the market, simply because they came out of the gates too high. The inventory will continue to grow, and the market will cool throughout the Spring, Summer, and Autumn Markets, until finding a late peak between October and Thanksgiving.
Last year, the inventory was at 2,274, 8% higher, or an additional 170 homes. The year-over-year difference has been continuously growing smaller since the end of January. The 3-year average prior to COVID (2017 through 2019) is 6,002, an extra 3,898 homes, or 185% more, more than double today. There were a lot more choices back then, though this is slowly changing as well.
For the month of April, there were 3,325 new FOR-SALE signs in Orange County, 695 fewer than the 3-year average prior to COVID (2017 to 2019), 17% less. Missing signs counter the potential rise in the inventory due to higher mortgage rates.

Demand, a snapshot of the number of new escrows over the prior month, decreased from 2,241 to 2,154 in the past couple of weeks, down 87 pending sales, or 3%. Ignoring the pandemic shut down’s effect on demand at the start of the pandemic in 2020, this was the largest drop in April since 2011, and the lowest demand reading since 2007. With rates increasing well above 5%, demand will continue to erode. Affordability is becoming a real factor in the housing market in 2022. As long as rates remain elevated above 4.5% with duration, demand will be muted, and the market will methodically slow from week to week, month to month. The Expected Market Time (the number of days to sell all Orange County listings at the current buying pace) has already climbed from 20 days four weeks ago to 29 days today. Anything below 60 days is considered a Hot Seller’s Market, and below 40-days is what is considered an insane pace where multiple offers is the norm and homes fetch above their asking prices. At this point, today’s 29-day reading is indicative of a frothy market where some buyers who had been losing out over the course of the past 6-months are stilling willing to stretch the price to finally “win.” As demand continues to cool and the inventory continues to climb, anticipate the Expected Market Time to slowly rise, surpassing the crazy 40-day threshold by the start of summer. Multiple offer situations will diminish, record high prices that push the envelope will decelerate, and the rate of appreciation will come back down to earth.
Last year, demand was at 3,081, 43% more than today, or an extra 927. The 3-year average prior to COVID (2017 to 2019) was at 2,780 pending sales, 29% more than today.
With the supply surging higher and demand dropping, the Expected Market Time (the number of days to sell all Orange County listings at the current buying pace) increased from 23 to 29 days in the past couple of weeks. At 29 days it remains an insane, Hot Seller’s Market (less than 60 days) where there are a ton of showings, sellers get to call the shots during the negotiating process, multiple offers are the norm, and home values are still rising rapidly. Last year the Expected Market Time was at 22 days, faster than today. The 3-year average prior to COVID was at 65 days, substantially slower than today and a Slight Seller’s Market (between 60 and 90 days).

In the past couple of weeks, the luxury inventory of homes priced above $2 million increased from 478 to 568 homes, up 19%, or an additional 90 homes, its highest level since September. The inventory has increased by 61% since ringing in a New Year, up 216 homes. Luxury demand plunged by 41 pending sales, down 16%, and now sits at 214, its lowest level since the end of January. With the supply surging and demand plunging, the overall Expected Market Time for luxury homes priced above $2 million increased extensively from 56 to 80 days, still an extremely hot market for luxury, but no longer instantaneous. At 80 days it is considered a Slight Seller’s Market (between 60 and 90 days).
Year over year, luxury demand is down by 82 pending sales or 28%, and the active luxury listing inventory is down by 85 homes or 13%. The Expected Market Time last year was at 66 days, stronger than today. This is the first time that the Expected Market Time is higher than the prior year dating back to May 2020.
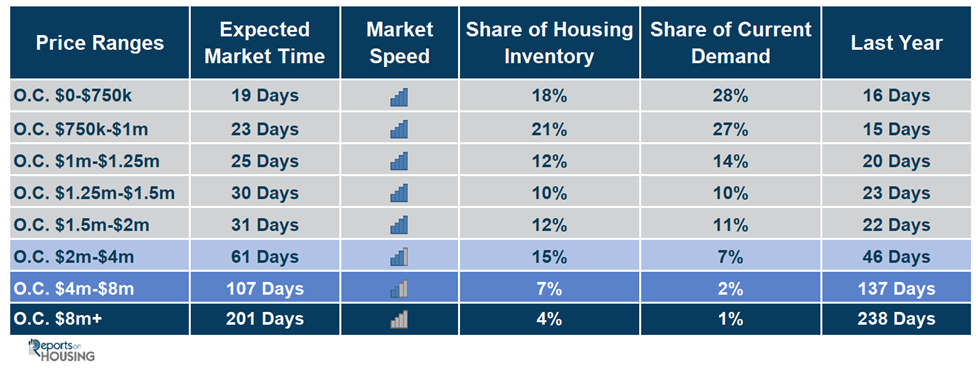
For homes priced between $2 million and $4 million, the Expected Market Time in the past two weeks increased from 40 to 61 days. For homes priced between $4 million and $8 million, the Expected Market Time increased from 84 to 107 days. For homes priced above $8 million, the Expected Market Time increased from 157 to 201 days. At 201 days, a seller would be looking at placing their home into escrow around November 2022.

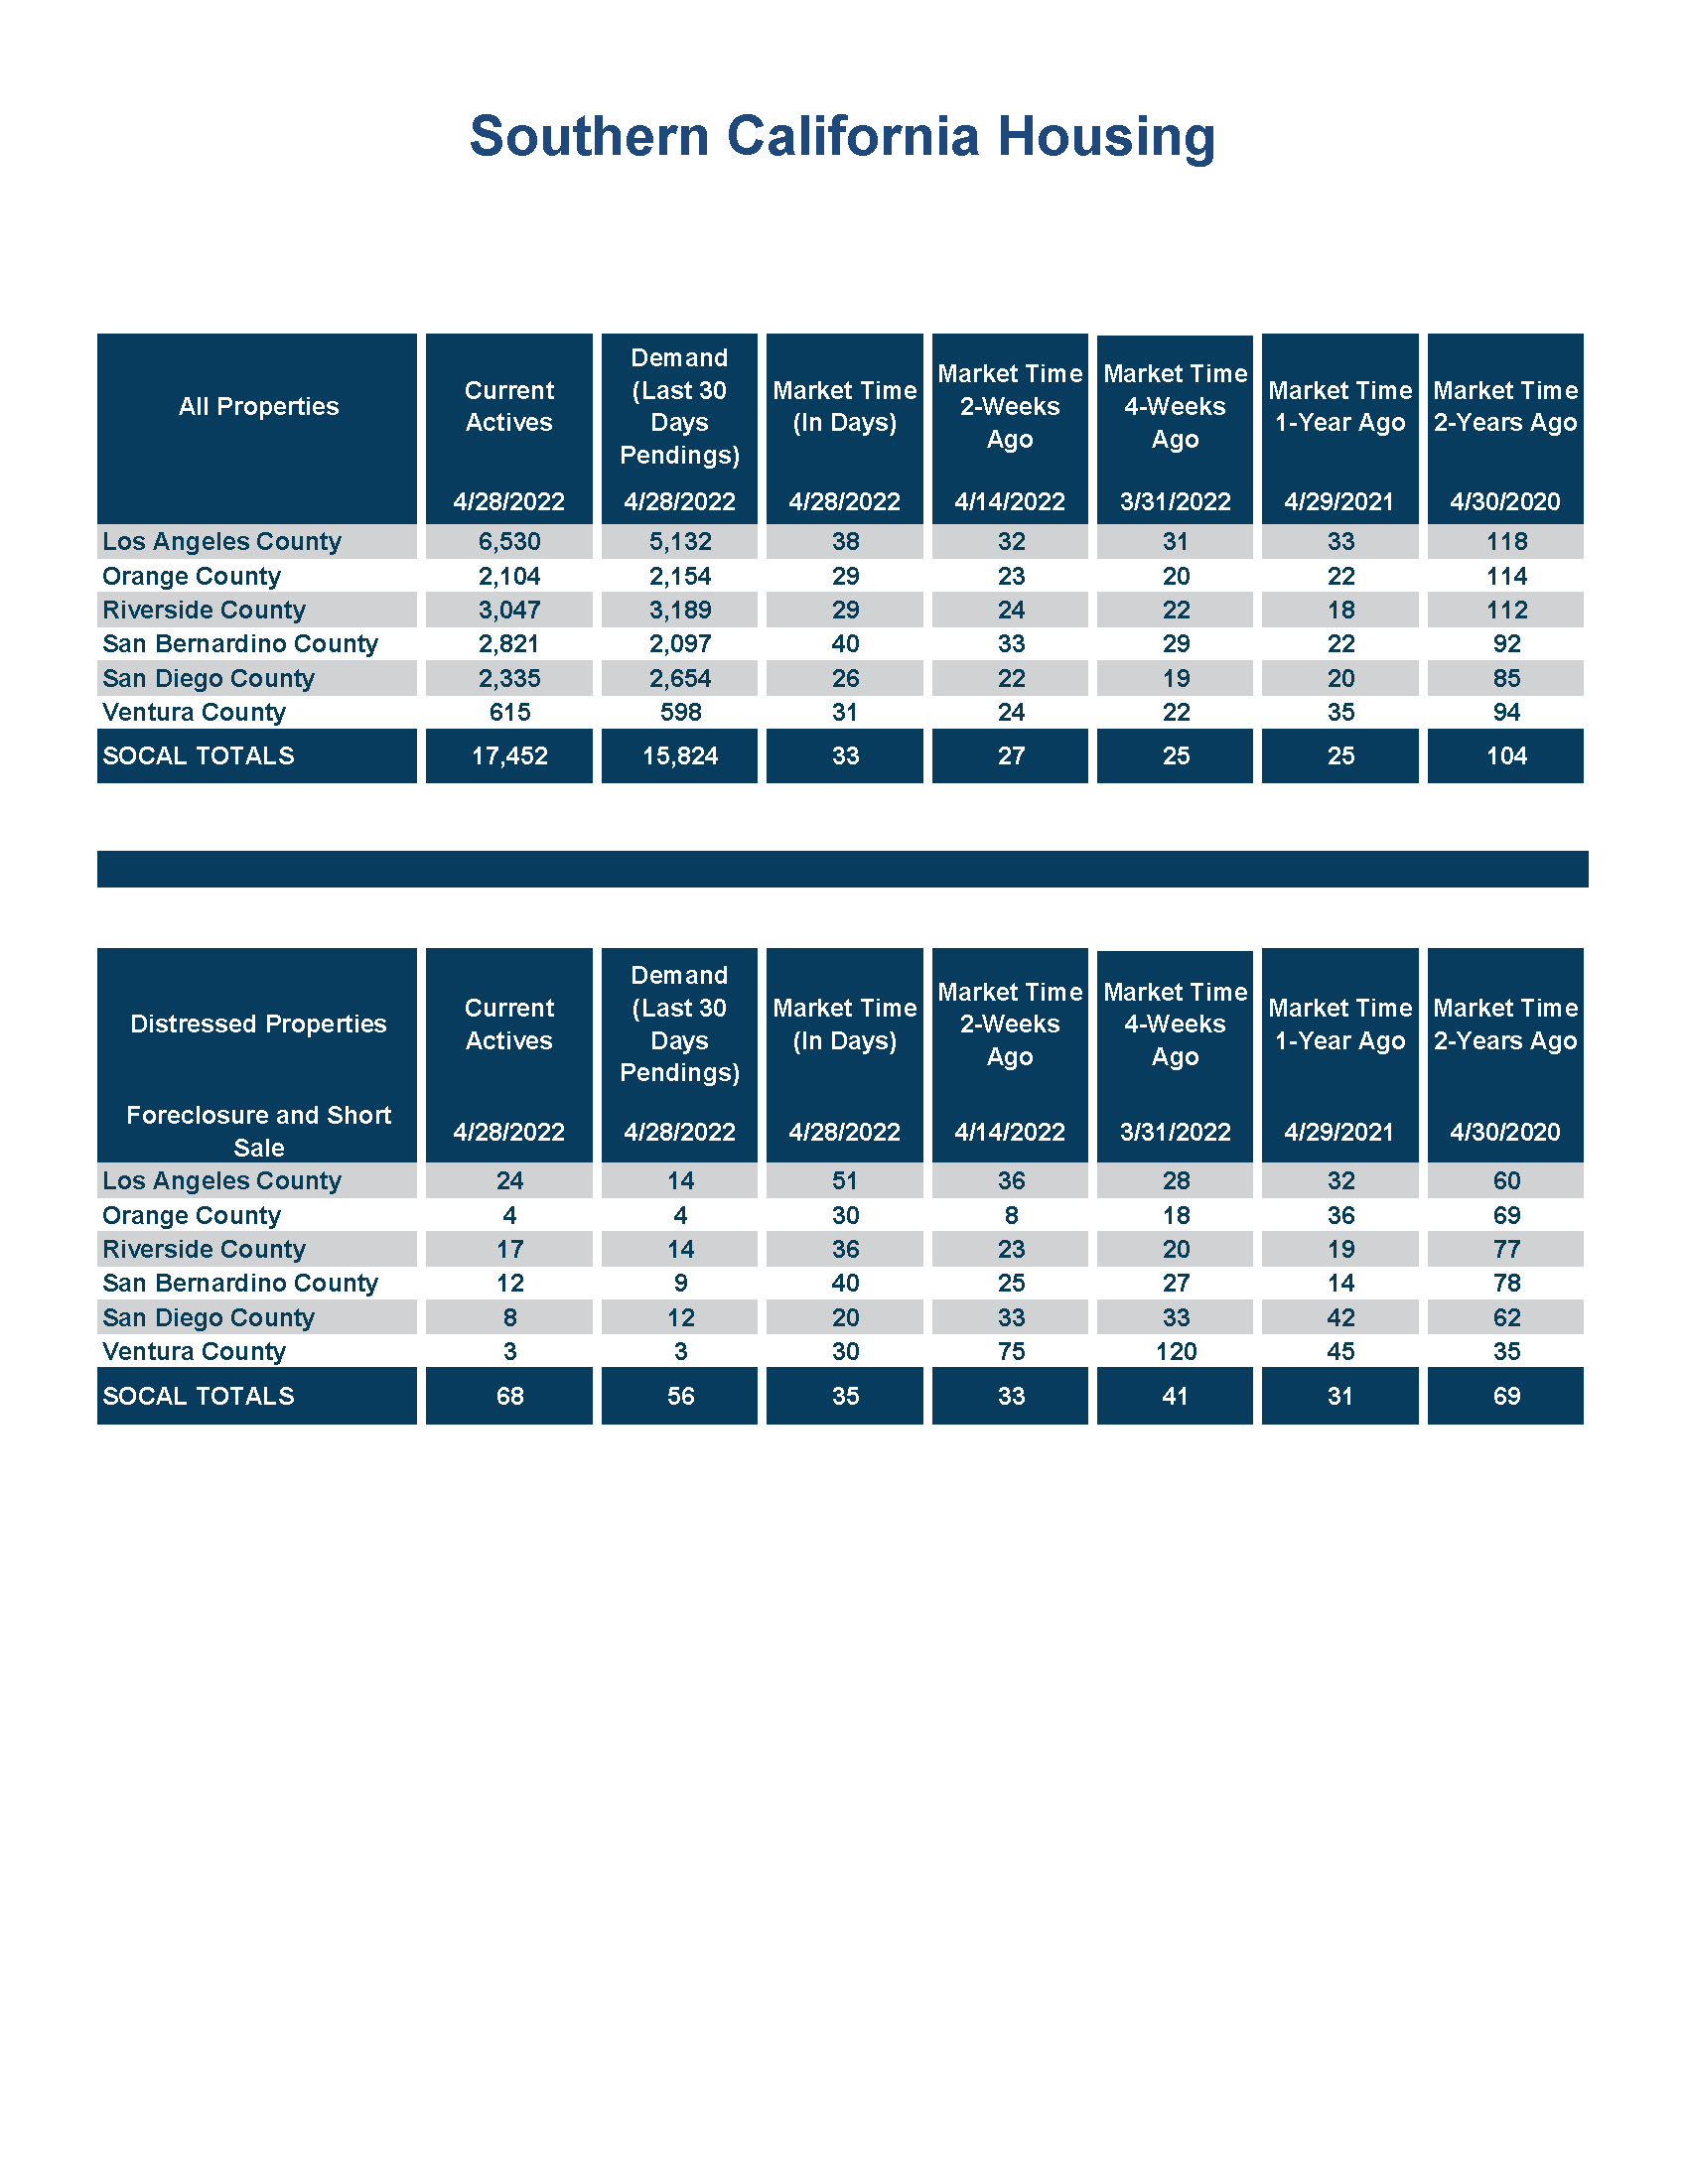
- The active listing inventory surged higher by 372 homes, up 21%, and now totals 2,104 homes, its largest two week gain since April 2018. Yet, it is still the lowest level for this time of the year since tracking began 18 years ago. In April, there were 17% fewer homes that came on the market compared to the 3-year average prior to COVID (2017 to 2019), 695 fewer. Last year, there were 2,274 homes on the market, 170 additional homes, or 8% more. The 3-year average prior to COVID (2017 to 2019) was 6,002, or 185% more.
- Demand, the number of pending sales over the prior month, decreased by 87 pending sales in the past two weeks, down 4%, and now totals 2,154, the largest drop for an April since 2011 (ignoring the COVID lockdown months of 2020). Last year, there were 3,081 pending sales, 43% more than today. The 3-year average prior to COVID (2017 to 2019) was 2,780, or 29% more.
- With supply surging higher and demand dropping, the Expected Market Time, the number of days to sell all Orange County listings at the current buying pace, surged higher from 23 to 29 days in the past couple of weeks, still an insanely Hot Seller’s Market (less than 60 days), but rapidly cooling. It was at 22 days last year, stronger than today.
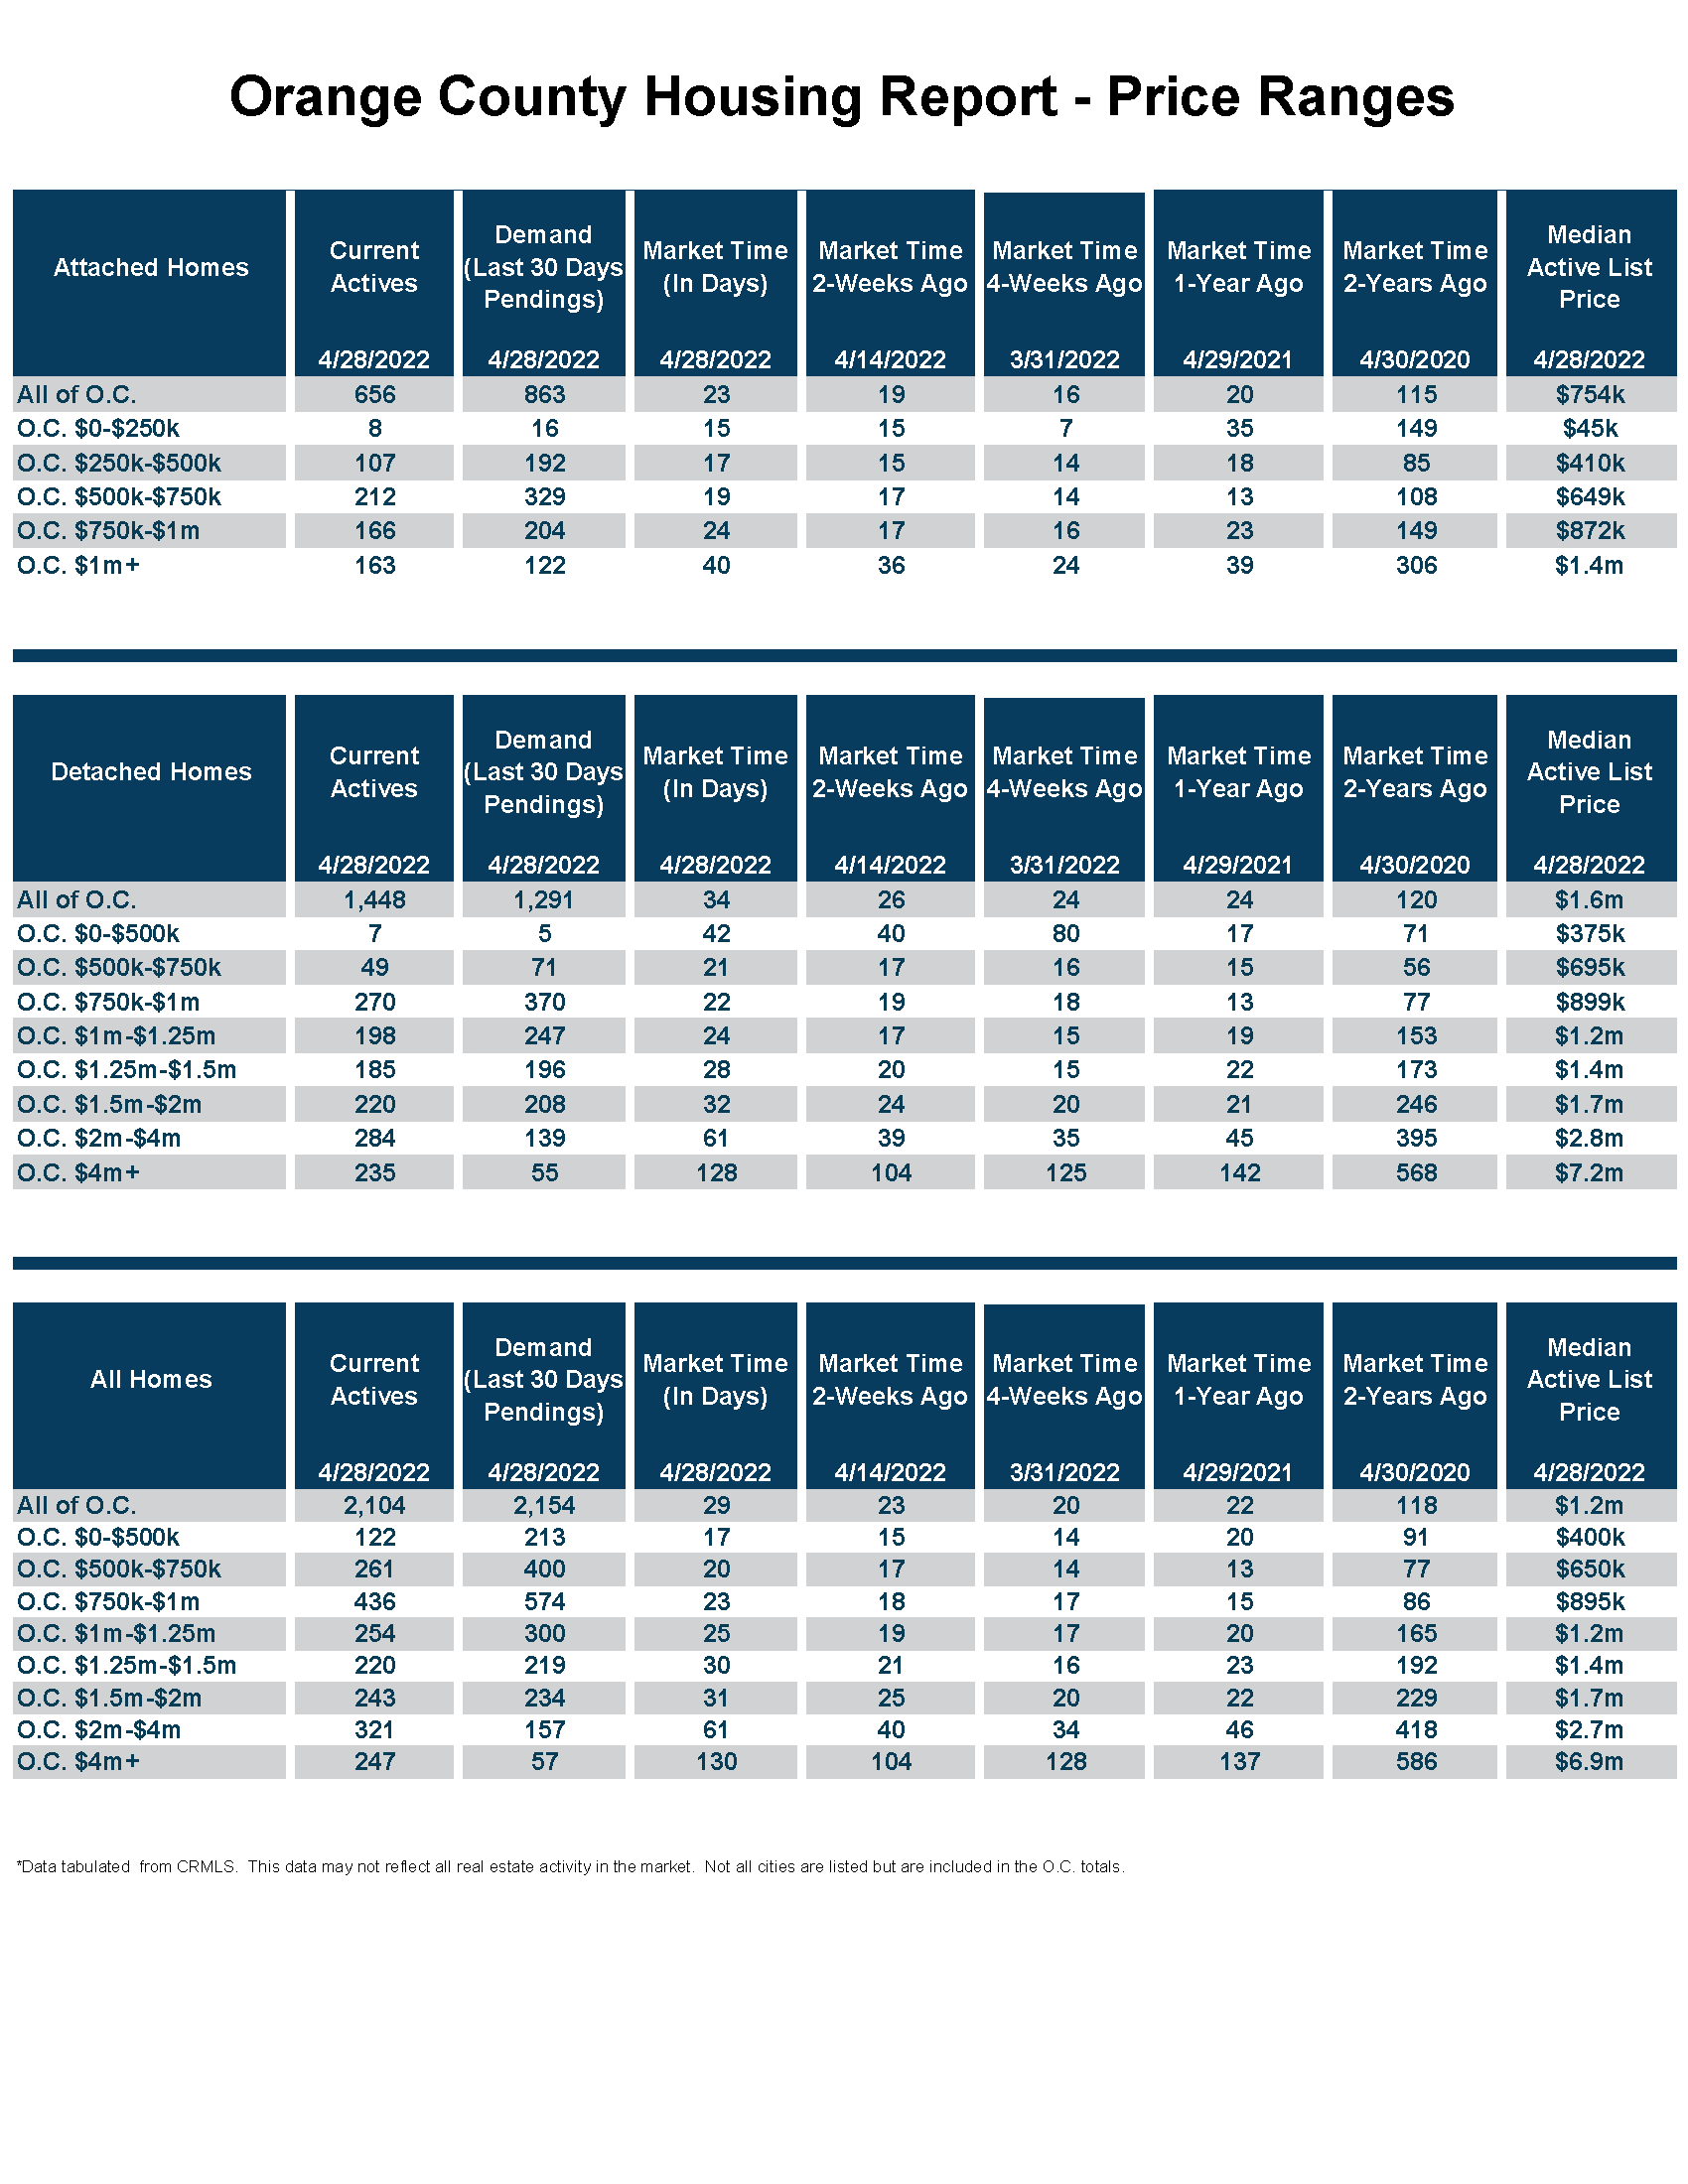
- For homes priced below $750,000, the market is a Hot Seller’s Market (less than 60 days) with an Expected Market Time of 19 days. This range represents 18% of the active inventory and 28% of demand.
- For homes priced between $750,000 and $1 million, the Expected Market Time is 23 days, a Hot Seller’s Market. This range represents 21% of the active inventory and 27% of demand.
- For homes priced between $1 million to $1.25 million, the Expected Market Time is 25 days, a Hot Seller’s Market. This range represents 12% of the active inventory and 14% of demand.
- For homes priced between $1.25 million to $1.5 million, the Expected Market Time is 30 days, a Hot Seller’s Market. This range represents 10% of the active inventory and 10% of demand.
- For homes priced between $1.5 million to $2 million, the Expected Market Time is 25 days, a Hot Seller’s Market. This range represents 11% of the active inventory and 10% of demand.
- For homes priced between $2 million and $4 million, the Expected Market Time in the past two weeks increased from 40 to 61 days. For homes priced between $4 million and $8 million, the Expected Market Time increased from 84 to 107 days. For homes priced above $8 million, the Expected Market Time increased from 157 to 201 days.
- The luxury end, all homes above $2 million, accounts for 29% of the inventory and 10% of demand.
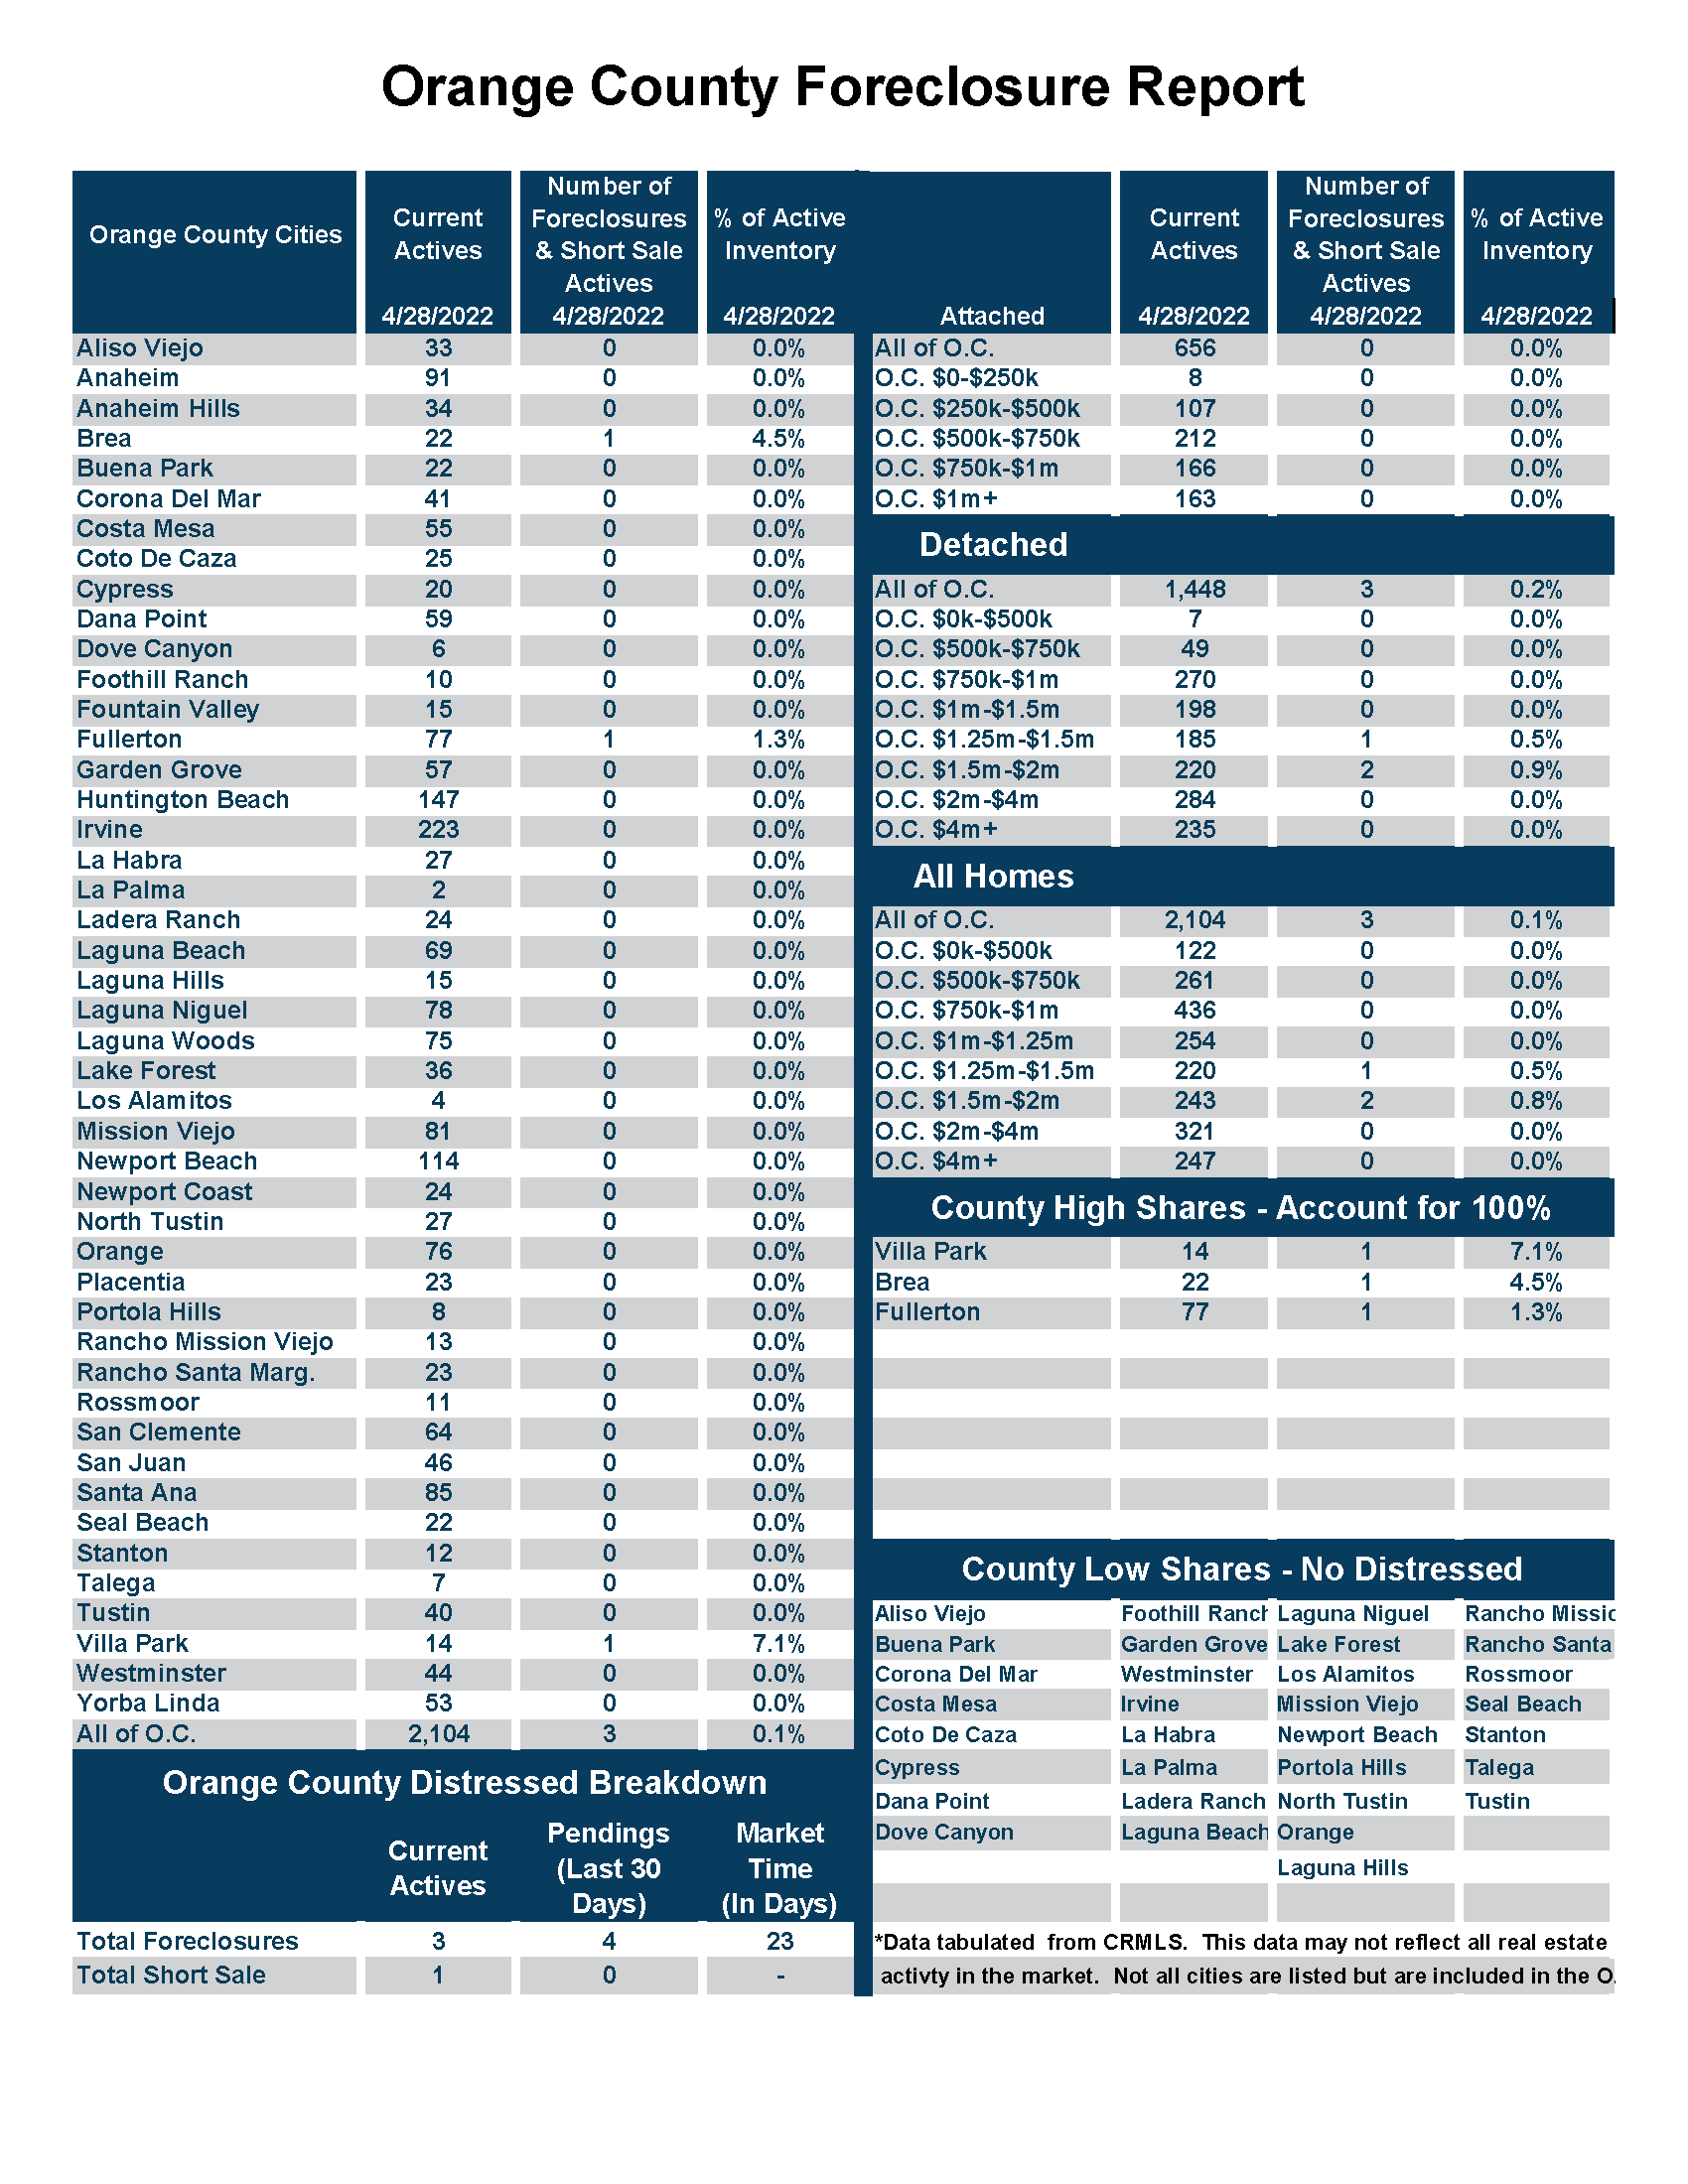
- Distressed homes, both short sales and foreclosures combined, made up only 0.2% of all listings and 0.2% of demand. There are only 3 foreclosures and 1 short sales available to purchase today in all of Orange County, 4 total distressed home on the active market, up 3 from two weeks ago. Last year there were 12 total distressed homes on the market, similar to today.
- There were 2,645 closed residential resales in March, 18% less than March 2021’s 3,212 closed sales. March marked a 49% increase compared to February 2022. The sales to list price ratio was 106.9% for all of Orange County. Foreclosures accounted for just 0.2% of all closed sales, and short sales accounted for 0.1%. That means that 99.7% of all sales were good ol’ fashioned sellers with equity.
Have a great week.
Sincerely,
Steven Thomas
Quantitative Economics and Decision Sciences
Copyright 2022- Steven Thomas, Reports On Housing – All Rights Reserved. This report may not be reproduced in whole or part without express written permission by author.