June 28, 2021
When there is so much noise swirling around housing,
it is a good idea to take a step back and focus on the
trends.
Top 5 Housing Trends
With nearly half of 2021 in the rearview mirror, there are noticeable trends that have developed.
It seems as if everyone has an opinion about the future of the housing market. “It’s a bubble.” “The market has peaked.” “I am going to wait for values to come crashing down.” “Housing will continue to be hot for a very long time.” In the end, there is way too much noise that is not supported by facts, ignoring the data. It is time to step aside from the uproar and look at the trends that have surfaced in 2021.
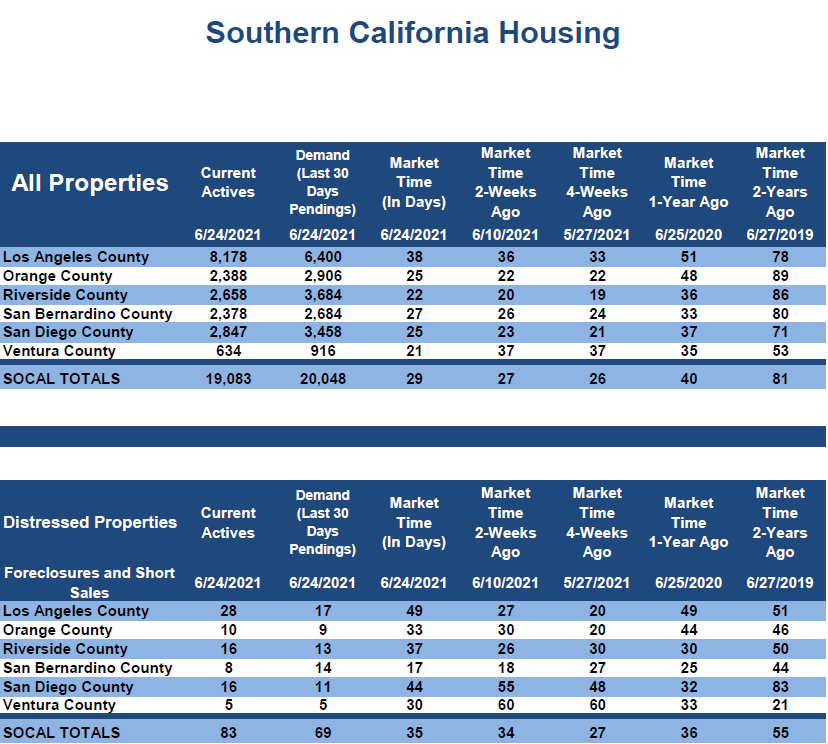
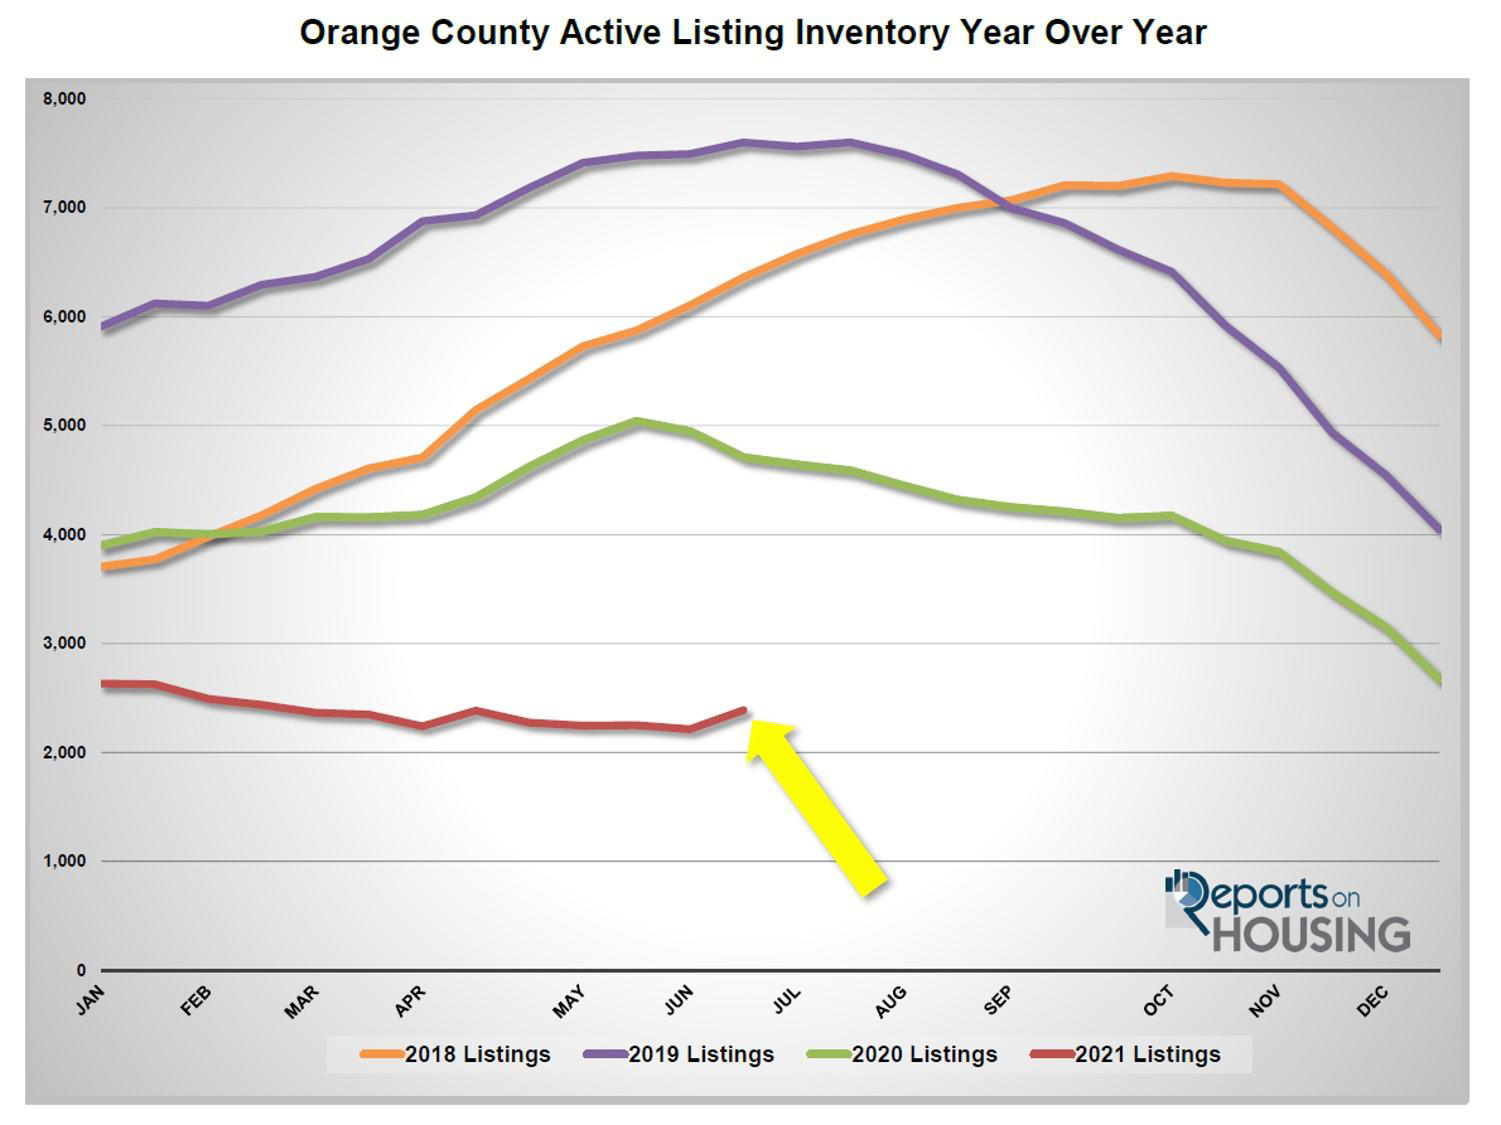
- The number of available homes to purchase is finally starting to rise. The unprecedented, ultra-low inventory has been the story for over a year now. At the start of last year, there already were not enough homes on the market, and then COVID-19 made things worse when many homeowners opted to not sell their homes. Ultimately, that led to this year’s anemic historically low level of available homes. In fact, today’s inventory is 64% less than the 5-year average of 6,702 homes (from 2015 to 2019 excluding 2020 due to COVID skewing the data). Yet, finally, now that summer has arrived with all of its normal, cyclical distractions, the inventory is on the rise, adding 174 homes, up 8%, within the past couple of weeks, its largest gain of the year. This new trend will continue throughout the summer months.
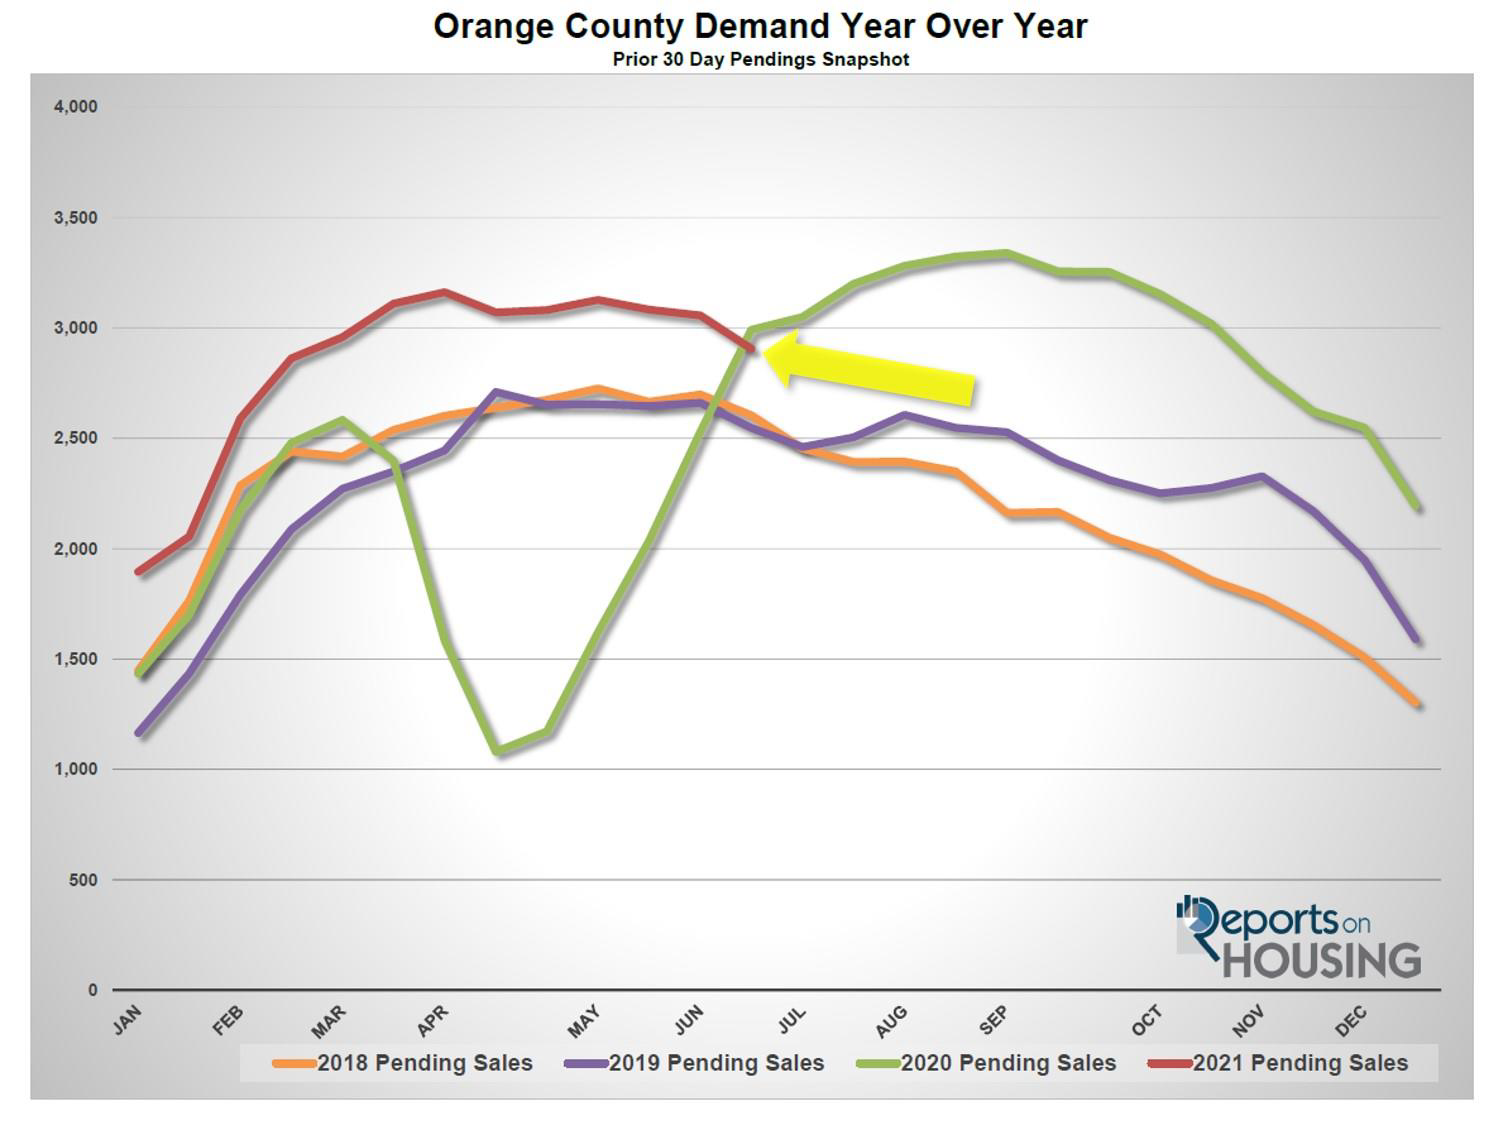
2. Demand, the number of new escrows over the prior month, is on the decline after reaching a peak in early spring. Demand, the number of new escrows over the prior month, is on the decline after reaching a peak in early spring. Demand typically peaks between April and mid-May. This year, it peaked at the very start of April in Orange County. Many expect the market to behave differently and ignore the seasons because housing is so hot, yet society seemingly likes its routines. Spring is the hottest time of the year in terms of demand. It downshifts during the summer with the kids out of school, planned vacations, and plenty of fun in the sun. Since peaking on April 1st, demand has dropped from 3,110 to 2,906 pending sales, shedding 204, down 7%. Within the past two weeks alone, it dropped by 151 escrows or 5%, its largest drop of the year. This trend should continue throughout the summer months.
- Closed Sales are at its highest level since 2005. Through the first five months of the year, there were 14,469 closed sales. Disregarding last year because COVID skewed the data (35% fewer last year), closed sales are up 22% compared to the 5-year average from 2015 through 2019, an extra 2,627. That pace is the highest since 2005. With demand continuing to outpace prior years, 2021 will be the strongest year for closings since prior to the Great Recession.
- Fewer homeowners are opting to list their homes for sale. This trend started last year with the onset of COVID, but dissipated and reversed its course in August last year. When the inventory reached a record low at the start of this year, many homeowners were nervous about selling and worried that there would be nothing for them to buy after selling. Combine that with the knowledge that home values were soaring, many homeowners were more than happy to wait on the sidelines while their equity quickly grew. During the first quarter, there were 3% fewer homes that entered the fray compared to the 5-year average from 2015-2019. In April, there were 10% fewer FOR-SALE signs, 413 fewer. In May, it was 15%, or 641 fewer. In the first two weeks of June, it was off by 19%, or 405 fewer. This trend will continue as long as the inventory remains muted and mortgage rates remain at historic lows below 3.5%.
- Pressure is building for mortgage rates to rise, which will impact affordability and demand. During the first week of this year, mortgage rates reached an all-time historic low, 2.65% according to Freddie Mac’s Primary Mortgage Market Survey®. It reached 3.18% on April 1st, but reversed course and dropped below 3% by the third week of April. It remained below 3% until June 24th when it rose from 2.93% in the prior week to 3.02%. It had remained at 3% or lower for 8 straight weeks, but pressure on rising rates had been mounting with inflation readings climbing. Even though the Federal Reserve has been stating that the inflation is “transitory,” or temporary, the U.S. economy is getting a lot hotter, and many are coming to the conclusion that the Federal Reserve needs to slow down their stimulus. They have been purchasing mortgage-backed securities, every day loans backed by Fannie Mae and Freddie Mac, since the onset of COVID. This has resulted in mortgage rates dropping by an additional quarter percent (approximately). Had COVID not occurred, rates would be around 3.75%. By year’s end, they will rise towards 3.5%, and then settle around 3.75% sometime next year. Demand will fall towards trend levels from 2015 through 2019, the inventory will rise to more normal levels, and the market time will slow from its crazy levels of today to a normal Seller’s Market.
The best advice for buyers and sellers: Follow an economic model that relies on facts and data rather than listen to all the noise. Ultimately, an economic model will reveal trends that will help in understanding the characteristics and direction of the current housing market and properly set expectations for buyers and sellers.
Active Listings
The current active inventory grew by 8% in the past couple of weeks.
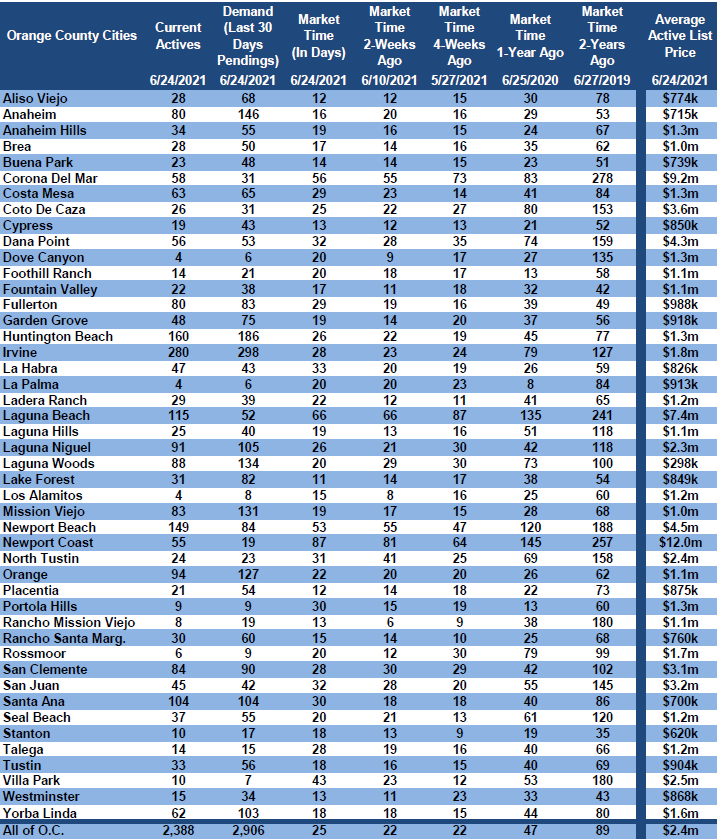
The active listing inventory added 174 homes in the past couple of weeks, up 8%, and now sits at 2,388 homes, its largest rise of the year and it highest level since February. The Summer Market has arrived along with its many distractions. Now that Californians are free to roam the earth again, everyone is eager to enjoy the summer they could not have last year. After being couped up at home and wearing masks, buyers will be a bit more distracted, so demand will fall slightly, and the inventory will rise. Expect the number of available homes to purchase to continue to rise throughout the summer. As mortgage rates rise over the coming months, homes will take a bit longer to sell due to diminishing demand. This will ultimately result in overpriced homes accumulating on the market. A normal peak occurs between July and August, but this year will most likely be delayed into the Autumn Market due to overzealous sellers lingering on the market.
Last year at the end of June, there were 4,710 homes on the market, 2,233 additional homes, or 97% more. The 5-year average from 2015 to 2019 (intentionally omitting 2020 due to COVID skewing the data) is 6,707, an extra 4,319 homes, or 181% more, nearly triple today’s level. There was an overabundance of choices for buyers compared to today.
Demand
Demand decreased by 5% in the past couple of weeks.
Demand, a snapshot of the number of new pending sales over the prior month, decreased from 3,057 to 2,906 in the past couple of weeks, shedding 151 pending sales, down 5%, the largest drop so far this year. Demand is at its lowest level since February. Summer has arrived. Many buyers are taking a much-needed short break to enjoy the summer they skipped last year. As a result, demand is starting to drop. Expect demand to continue to methodically drop throughout the Summer and Autumn Markets, and then drop at a greater clip during the holidays beginning in mid-November.
Last year, demand was at 2,992, 3% more than today, as it continued to soar upward with a very late arrival to the Spring Market. For the first time since the start of June 2020, current demand is less than the prior year. Yet, comparing this year to last year does not reveal much because COVID skewed the data. It is better to compare today’s market to the 5-year average for demand from 2015 through 2019, which was at 2,804 pending sales, 102 fewer pending sales, or 3.5% less than today.
With both the inventory rising and demand falling, in the past two-weeks the Expected Market Time (the number of days to sell all Orange County listings at the current buying pace) increased from 22 days to 25 days, its highest level since February. At 25 days, it is still an extremely insane, Hot Seller’s Market (less than 60 days) where there are a ton of showings, sellers get to call the shots during the negotiating process, multiple offers are the norm, and home values are rising rapidly. Last year the Expected Market Time was at 47 days, slower than today, but continuing to improve rapidly. The 5-year average from 2015 through 2019 was at 72 days, much slower than today, but still a Slight Seller’s Market.
Luxury End
The luxury market slowed a bit with both a rise in the supply and a drop in demand.
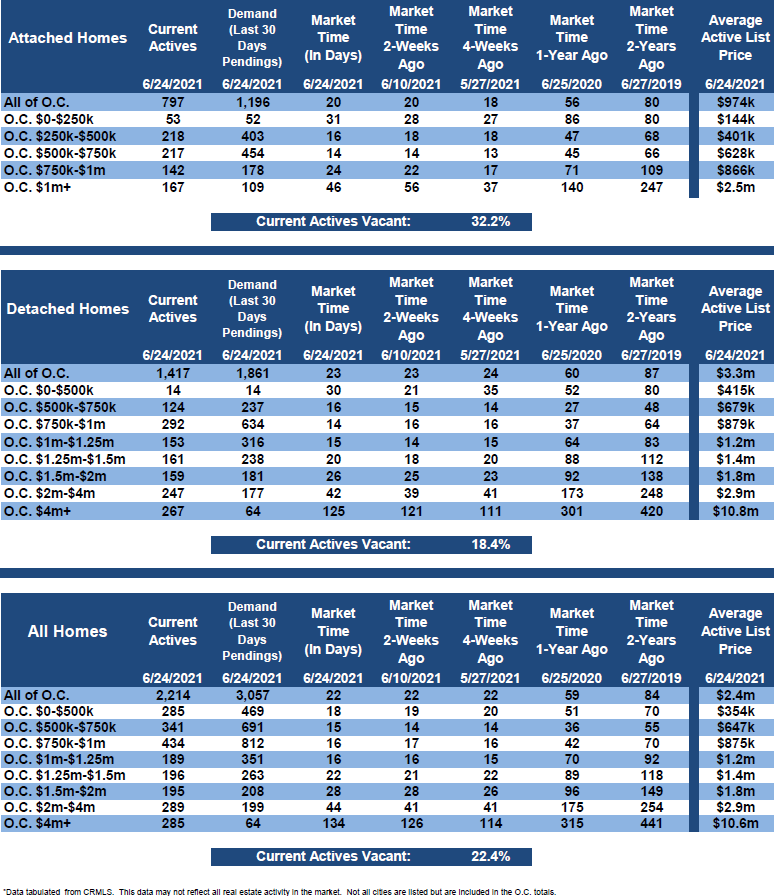
In the past two weeks the luxury inventory of homes priced above $1.5 million increased by 47 homes, up 6%, and now sits at 816, its highest level since the end of April. At the same time, luxury demand decreased by 29 pending sales, down 6%, and now sits at 442, its lowest level since February. Luxury demand peaked at the end of April at 527 pending sales, dropping 16% since. With both the supply of luxury homes increasing and demand dropping, the overall Expected Market Time for luxury homes priced above $1.5 million increased from 49 to 55 days, its highest level since the start of April. At 55 days, it remains a very Hot Seller’s Market for luxury.
Expect the luxury market to continue to slightly cool with all the distractions of summer.
Year over year, luxury demand is up by 107 pending sales, or 32%, and the active luxury listing inventory is down by 575 homes, or 41%. The Expected Market Time last year was at 125 days and plunging fast with the beginning of a delayed Spring Market due to COVID. Year over year statistics for luxury will be much more comparable starting in July.
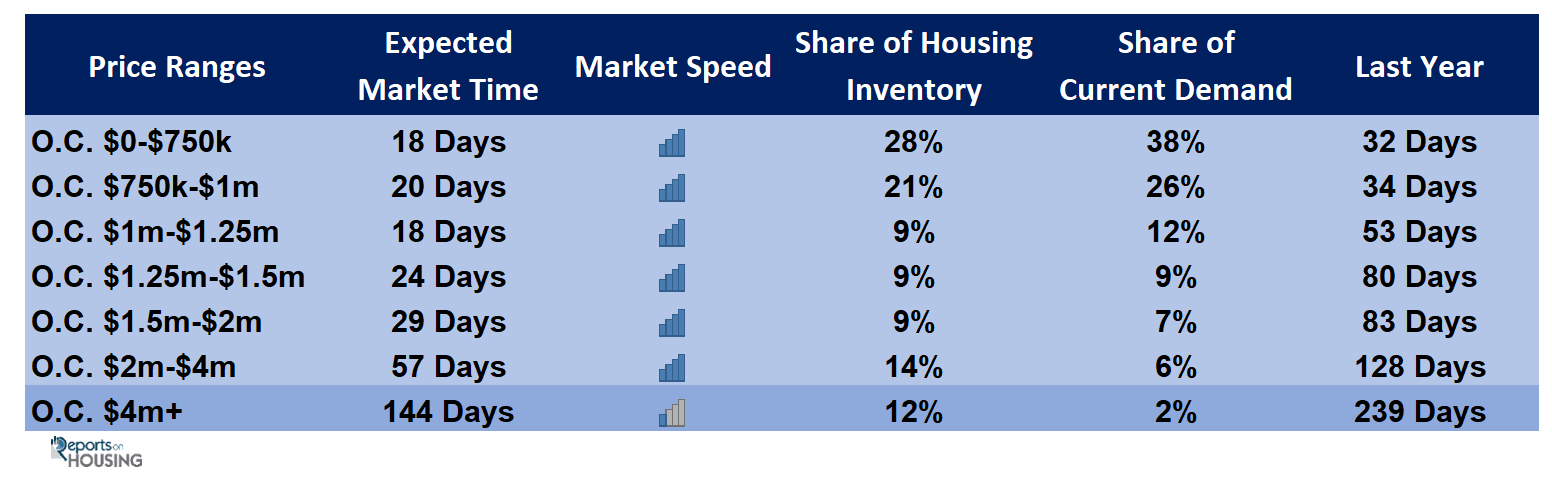
For homes priced between $1.5 million and $2 million, the Expected Market Time increased from 28 to 29 days. For homes priced between $2 million and $4 million, the Expected Market Time increased from 44 to 57 days. For homes priced above $4 million, the Expected Market Time increased from 134 to 144 days. At 144 days, a seller would be looking at placing their home into escrow around November 2021.
Orange County Housing Summary
• The active listing inventory increased by 174 homes in the past two-weeks, up 8%, and now totals 2,388, its largest increase of the year and its highest level since February. From June 1st through June 15th, there were 19% fewer homes that came on the market compared to 5-year average between 2015 to 2019 (2020 was skewed do to COVID-19), 405 less. Last year, there were 4,710 homes on the market, 2,322 additional homes, or 97% more.
• Demand, the number of pending sales over the prior month, decreased by 151 pending sales in the past two-weeks, down 5%, and now totals 2,906, its largest decrease of the year and its lowest level since February. Mortgage rates remain at historically low levels, maintaining demand’s current brisk pace. Last year, there were 2,992 pending sales, 3% more than today. It was the first time the prior year was higher than the current year dating back to June 2020.
• With an increase in the supply and a drop in demand, the Expected Market Time, the number of days to sell all Orange County listings at the current buying pace, increased from 22 to 25 days in the past couple of weeks, its highest level since February, but still an extremely Hot Seller’s Market (less than 60 days). It was at 47 days last year and rapidly getting hotter as 2020’s delayed Spring Market had begun.
• For homes priced below $750,000, the market is a Hot Seller’s Market (less than 60 days) with an Expected Market Time of 18 days. This range represents 28% of the active inventory and 38% of demand.
• For homes priced between $750,000 and $1 million, the Expected Market Time is 20 days, a Hot Seller’s Market. This range represents 21% of the active inventory and 26% of demand.
• For homes priced between $1 million to $1.25 million, the Expected Market Time is 18 days, a Hot Seller’s Market.
• For homes priced between $1.25 million to $1.5 million, the Expected Market Time is 24 days, a Hot Seller’s Market.
• For homes priced between $1.5 million and $2 million, the Expected Market Time increased from 28 to 29 days. For homes priced between $2 million and $4 million, the Expected Market Time increased from 44 to 57 days. For homes priced above $4 million, the Expected Market Time increased from 134 to 144 days.
• The luxury end, all homes above $1.5 million, accounts for 35% of the inventory and 15% of demand.
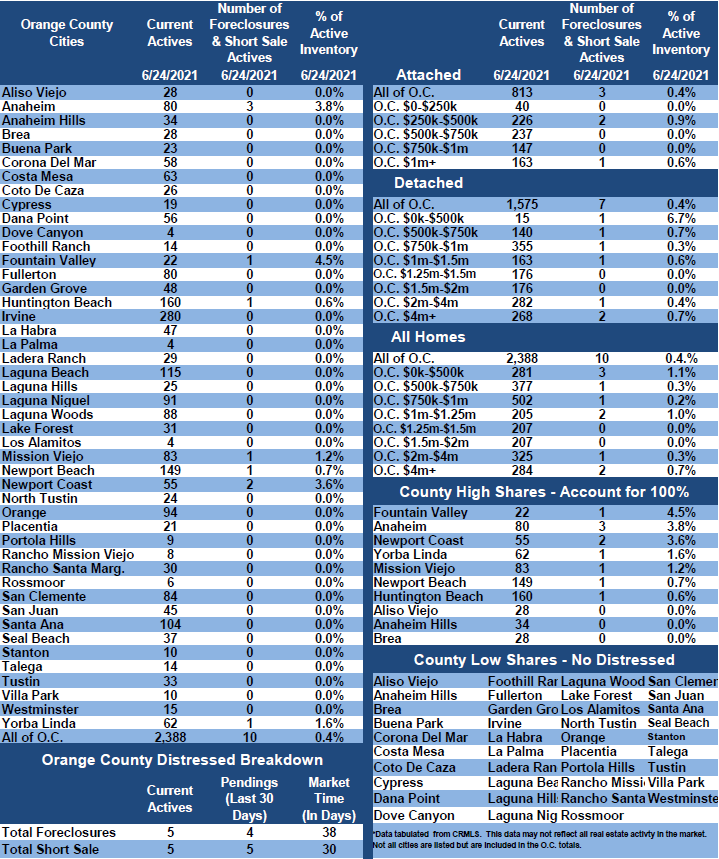
• Distressed homes, both short sales and foreclosures combined, made up only 0.4% of all listings and 0.3% of demand. There are only 5 foreclosures and 5 short sales available to purchase today in all of Orange County, 10 total distressed homes on the active market, no change from two-weeks ago. Last year there were 29 total distressed homes on the market, slightly more than today.
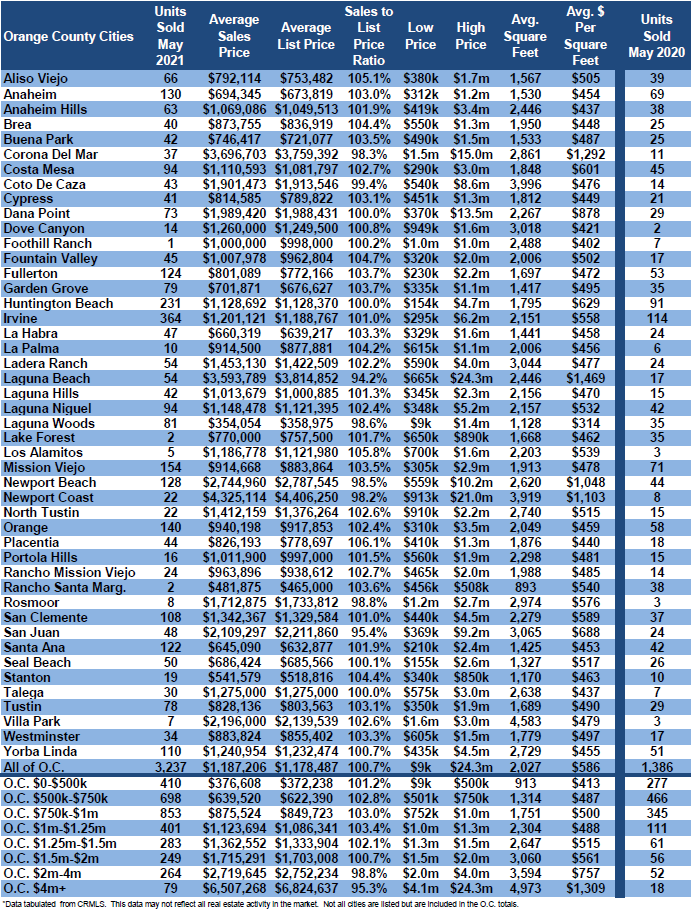
• There were 3,237 closed residential resales in May, 134% more than May 2020’s 1,386 closed sales. May marked an 7% decline from April 2021. The sales to list price ratio was 100.7% for all of Orange County. Foreclosures accounted for just 0.1% of all closed sales, and short sales accounted for 0.1%. That means that 99.8% of all sales were good ol’ fashioned sellers with equity.
Have a great week.
Sincerely,
Steven Thomas
Quantitative Economics and Decision Sciences
Cell 949.874.8221
Copyright 2021- Steven Thomas, Reports On Housing – All Rights Reserved. This report may not be reproduced in whole or part without express written permission by author.