
September 7, 2021
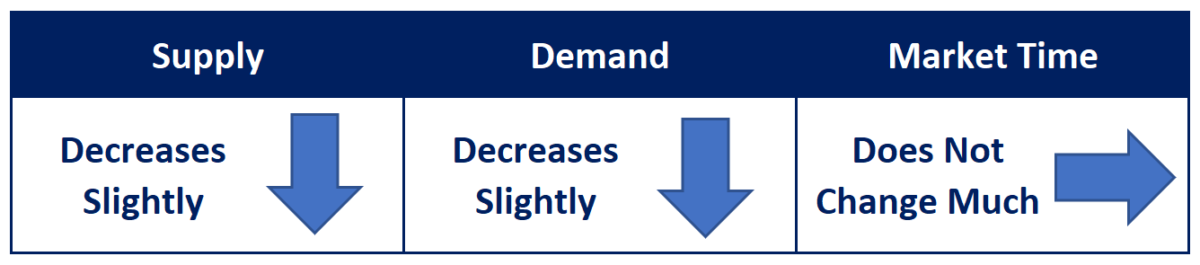
The Autumn Market is officially here and with it typically
comes a drop in the supply of available homes to purchase,
falling demand, and the overall speed of the market remains
the same.
Autumn Market
Expect less activity with fewer homes coming on the market and fewer buyers looking to find a home.
The kids have made their way back to their classrooms ready to resume another year of academic learning. Pumpkin Spice Lattes have returned to Starbucks®, and this year they added a new twist on the season, Apple Crisp Macchiatos. Leaves are starting to fall from high branches and blanket well-manicured yards. Autumn has arrived. It may not officially start until Wednesday, September 22nd, but all the signs are here.
These changes also indicate the start to the Autumn Market in Orange County. It begins around the end of August when the kids head back to their classrooms and ends a week before Thanksgiving, the start of the Holiday Market. It is no longer the “prime time” season for real estate. The Spring and Summer Markets are in the rearview mirror. Housing will now shift gears and transition to a slower time of the year. Despite how hot the market has been, this year will be no different. The inventory, demand, and closed sales will all fall, and the Expected Market Time (the time between hammering in the FOR-SALE sign to opening escrow) will not change much at all. Nevertheless, this will be the hottest Autumn Market since tracking began in 2004.
During the Autumn Market demand decreases slightly. With kids back in school, it is not the most advantageous time of the year to move a family. Moving during the school year is extremely disruptive, so families opt to place their home search on hold and wait it out until the following spring. As a result, there are fewer new escrows.
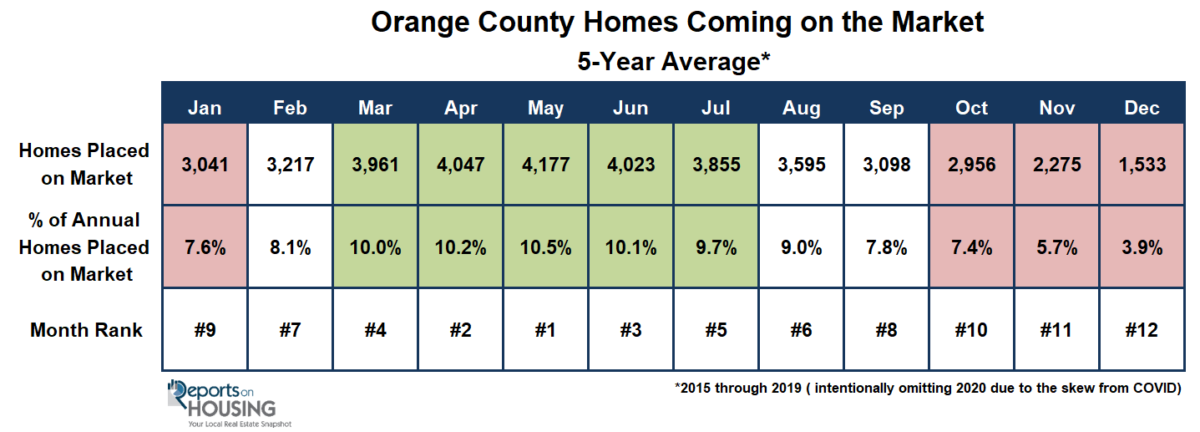
Similarly, there are fewer homeowners who opt to sell during the Autumn Market. Just as buyers place their search on hold, many homeowners do not want to disrupt their children’s school year and decide to wait until the Spring or Summer Markets to sell. In September, on average, there are 3,098 homes that are placed on the market, 25% less than the annual height of 4,177 homes in May. As the year progresses, fewer homeowners will enter the fray.
Many buyers mistaken the end of the year as THE best time to purchase. They know that it is no longer the hottest time of the year for real estate, so they believe they can get a “deal” during the slower months. That is not the case. Instead, the market will remain the same until ringing in 2022. With both the inventory and demand dropping at similar rates, the overall feel of the market, will not change. This results is a Market Time that remains almost unchanged.
In looking at the 5-year average from 2015 through 2019 (excluding 2020 due to COVID-19 skewing the data), the supply of homes has decreased by 16% from the end of August to the second week of November. On average, demand dropped by 16%, and the Expected Market Time increased by 1 day. That would be a decrease in the supply of available homes from 2,528 two weeks ago to 2,123 homes by mid-November. Demand would drop from 2,694 pending sales to 2,253. With both supply and demand falling, the Expected Market Time would rise from 28 to 29 days, the highest level since the start of February.
An Expected Market Time below 40 days is nothing short of insanity. It is when there are plenty of showings, sellers get to call the shots during the negotiating process, multiple offers are the norm, and home values are rising rapidly. With the Orange County housing market stuck well below 40 days through the end of the year, what you see is what you get. Even with demand falling along with inventory, the overall feel of the market for buyers will not change much at all.
For sellers, the only imperceivable change will be slightly fewer showings and slightly fewer offers due to a smaller number of buyers in the marketplace. A home that may have garnered 100 showings in a few days back in the Spring Market could see 50 during the Autumn Market, 10 offers compared to 20. The result will still be the same, homes that sell fast with plenty of offers and sales prices above their asking prices.
For buyers, there may be fewer buyers participating in the marketplace, but there are diminished opportunities with not as many homes coming on the market. With fewer choices, the remaining buyers will still be bumping into each other when something new hits the market. Buyers should not expect anything to change anytime soon, especially with interest rates that remain at record low levels.
Now that the Autumn Market is here, there will be fewer homes coming on the market, demand will decrease, and housing will not change much. The calm of autumn means less activity and a cyclical change to housing.
Active Listings
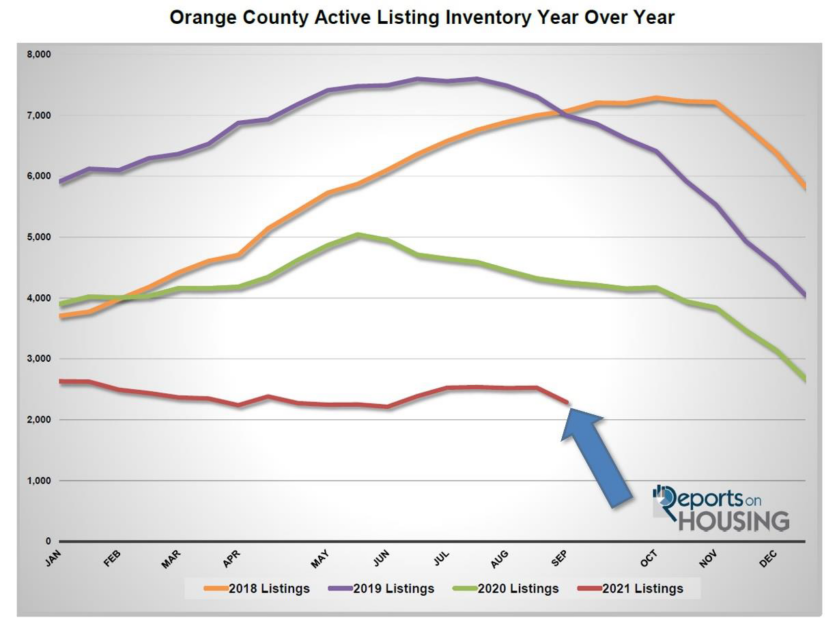
The current active inventory plunged in the past two weeks.
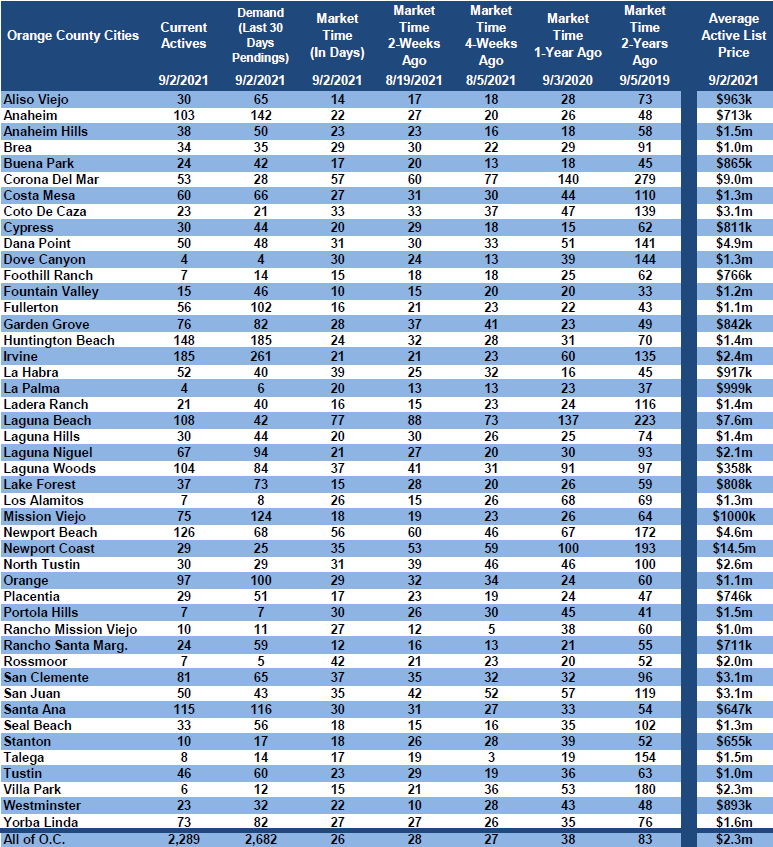
The active listing inventory shed 239 homes in the past couple of weeks, down 9%, and now sits at 2,289 homes, the largest drop of the year. The inventory reached a low for the year in June at 2,214 homes, not much different than where it stands today. With the start of the Autumn Market, expect the inventory to continue to slowly drop from now through mid-
November, the start of the Holiday Market. It will then plunge to new depths by year’s end. This is setting the stage to a record low level start to 2022, dropping below the unbelievably low start to this year. The supply crisis will continue for the unforeseeable future.
Last year in mid-August, there were 4,252 homes on the market, 1,963 additional homes, or 86% more. The 3-year average from 2017 to 2019 (intentionally omitting 2020 due to COVID skewing the data) is 6,569, an extra 4,280 homes, or 187% more. There were a lot more choices for buyers compared to today.
In August, there were 412 fewer new FOR-SALE signs in Orange County, 12% less than the 3-year average from 2017 to 2019. So far this year, there were 6% fewer homes placed on the market, 1,775 missing signs. That may not seem like that many, but, at this point, every single missing FOR-SALE sign just adds to the inventory crisis.
Demand
Demand did not change much in the past couple of weeks.
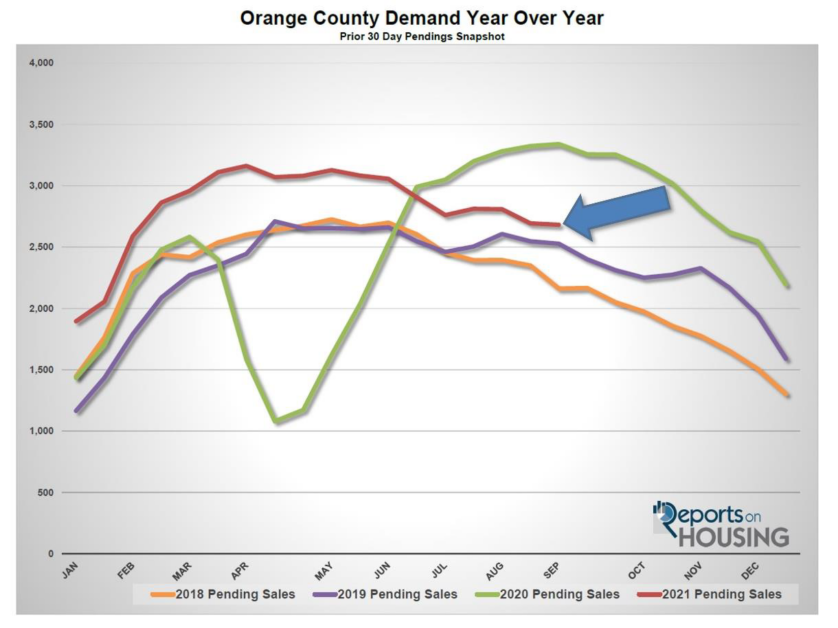
Demand, a snapshot of the number of new pending sales over the prior month, decreased from 2,694 to 2,682 in the past couple of weeks, shedding 12 pending sales, nearly unchanged. The current demand readings remain are surprisingly high levels even though there are so few homes coming on the market recently. The appetite to purchase remains very strong, which is why the inventory is dropping so fast right now. With so few choices, buyers are gobbling up everything that pops onto the market. Yet, with fewer new choices, as housing dives deeper into the Autumn Market, expect demand to slowly drop from now through mid-November with the start of the Holiday Market. That is when demand will plunge to its lowest level by year’s end. Mortgage rates remain at historically low levels, which will continue to feed demand.
Last year, demand was at 3,340, its peak for the year, a four month delay due to COVID, 25% more than today.
With a large drop in the inventory and demand nearly unchanged in the past couple of weeks, the Expected Market Time (the number of days to sell all Orange County listings at the current buying pace) decreased from 28 to 26 days, its hottest level since June. At 26 days, the housing market is nothing short of an extremely insane, Hot Seller’s Market (less than 60 days) where there are a ton of showings, sellers get to call the shots during the negotiating process, multiple offers are the norm, and home values are rising rapidly. Last year the Expected Market Time was at 38 days. The 3-year average from 2017 through 2019 was at 82 days, much slower than today, but still a Slight Seller’s Market.
Luxury End
The luxury market improved dramatically in the past couple of weeks.
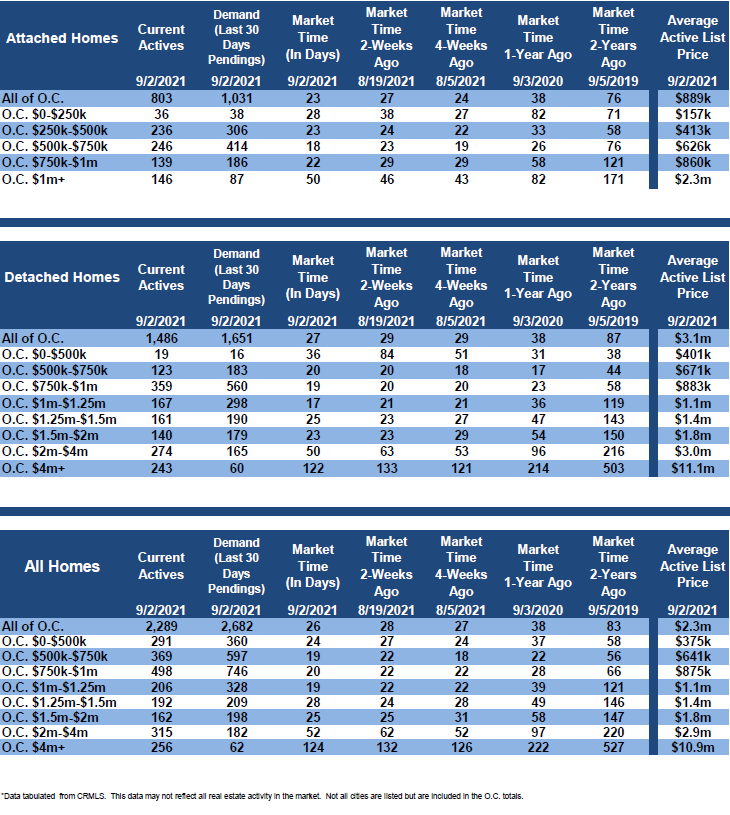
In the past two weeks the luxury inventory of homes priced above $1.5 million decreased by 81 homes, down 8%, and now sits at 733, its lowest level since tracking. At the same time, luxury demand increased by 8 pending sales, up 2%, and now sits at 442. With a giant drop in the supply and rising demand, the overall Expected Market Time for luxury homes priced above $1.5 million decreased from 55 to 50 days, a very Hot Seller’s Market for luxury. The last time luxury was this hot was in June.
Expect the luxury market to slightly cool as housing transitions further into the Autumn Market. It will not continue to get hotter.
Year over year, luxury demand is up by 34 pending sales, or 8%, and the active luxury listing inventory is down by 563 homes, or 43%. The Expected Market Time last year was at 95 days, extremely hot for luxury, and its hottest level of 2020. It was nearly double where it is right now, indicating just how hot the luxury market is today.
For homes priced between $1.5 million and $2 million, the Expected Market Time remained unchanged at 25 days. For homes priced between $2 million and $4 million, the Expected Market Time decreased from 62 to 52 days. For homes priced above $4 million, the Expected Market Time decreased from 132 to 124 days. At 124 days, a seller would be looking at placing their home into escrow around January 2022.
Orange County Housing Summary
• The active listing inventory decreased by 239 homes in the past two-weeks, down 9%, and now totals 2,289, its largest drop of the year. In August, there were 12% fewer homes that came on the market compared to the 3-year average between 2017 to 2019 (2020 was skewed do to COVID-19), 412 less. Last year, there were 4,252 homes on the market, 1,963 additional homes, or 86% more.
• Demand, the number of pending sales over the prior month, decreased by 12 pending sales in the past two-weeks, nearly unchanged, and now totals 2,682. Last year, there were 3,340 pending sales, 25% more than today and a four-month delayed peak due to COVID.
• With a large drop in the supply and demand nearly unchanged, the Expected Market Time, the number of days to sell all Orange County listings at the current buying pace, decreased from 28 to 26 days in the past couple of weeks, its hottest level since June and an extremely Hot Seller’s Market (less than 60 days). It was at 38 days last year slightly slower than today.
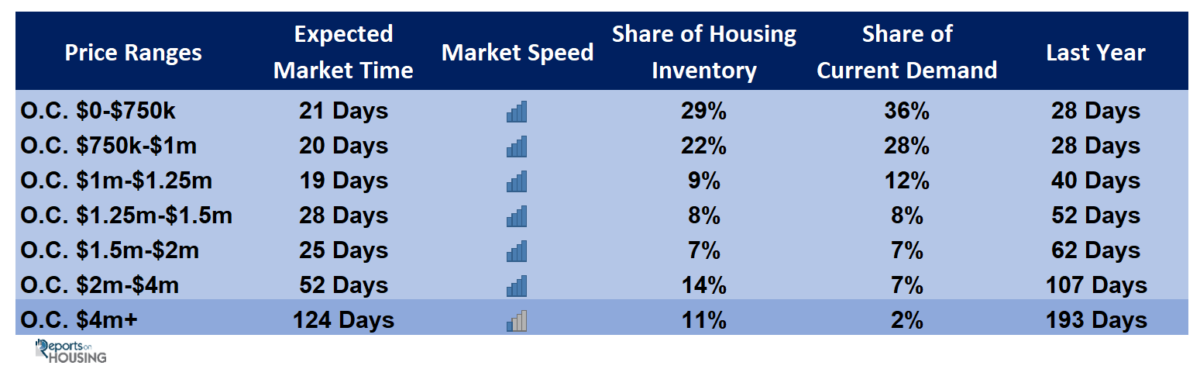
• For homes priced below $750,000, the market is a Hot Seller’s Market (less than 60 days) with an Expected Market Time of 21 days. This range represents 29% of the active inventory and 36% of demand.
• For homes priced between $750,000 and $1 million, the Expected Market Time is 20 days, a Hot Seller’s Market. This range represents 22% of the active inventory and 28% of demand.
• For homes priced between $1 million to $1.25 million, the Expected Market Time is 19 days, a Hot Seller’s Market. This range represents 9% of the active inventory and 12% of demand
• For homes priced between $1.25 million to $1.5 million, the Expected Market Time is 28 days, a Hot Seller’s Market. This range represents 8% of the active inventory and 8% of demand
• For homes priced between $1.5 million and $2 million, the Expected Market Time remained unchanged at 25 days. For homes priced between $2 million and $4 million, the Expected Market Time decreased from 62 to 52 days. For homes priced above $4 million, the Expected Market Time decreased from 132 to 124 days.
• The luxury end, all homes above $1.5 million, accounts for 32% of the inventory and 16% of demand.
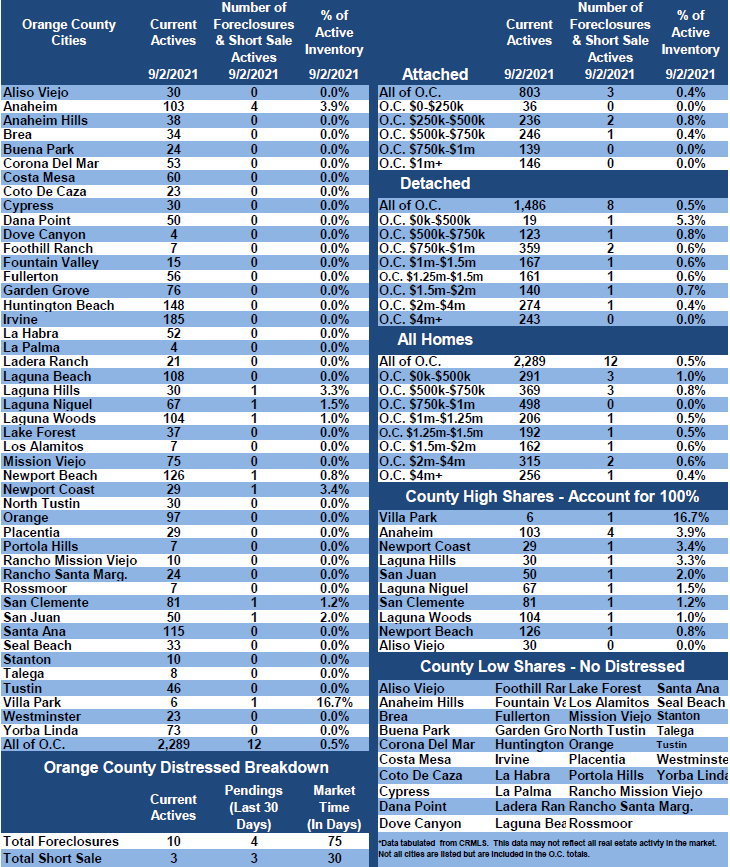
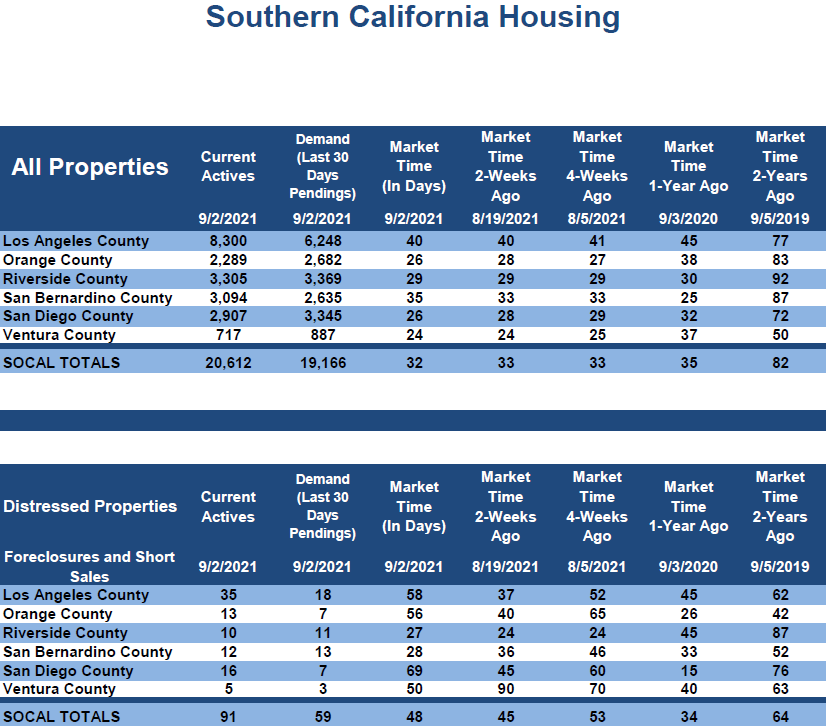
• Distressed homes, both short sales and foreclosures combined, made up only 0.6% of all listings and 0.3% of demand. There are only 10 foreclosures and 3 short sales available to purchase today in all of Orange County, 13 total distressed homes on the active market, up 1 from two-weeks ago. Last year there were 13 total distressed homes on the market, identical to today.
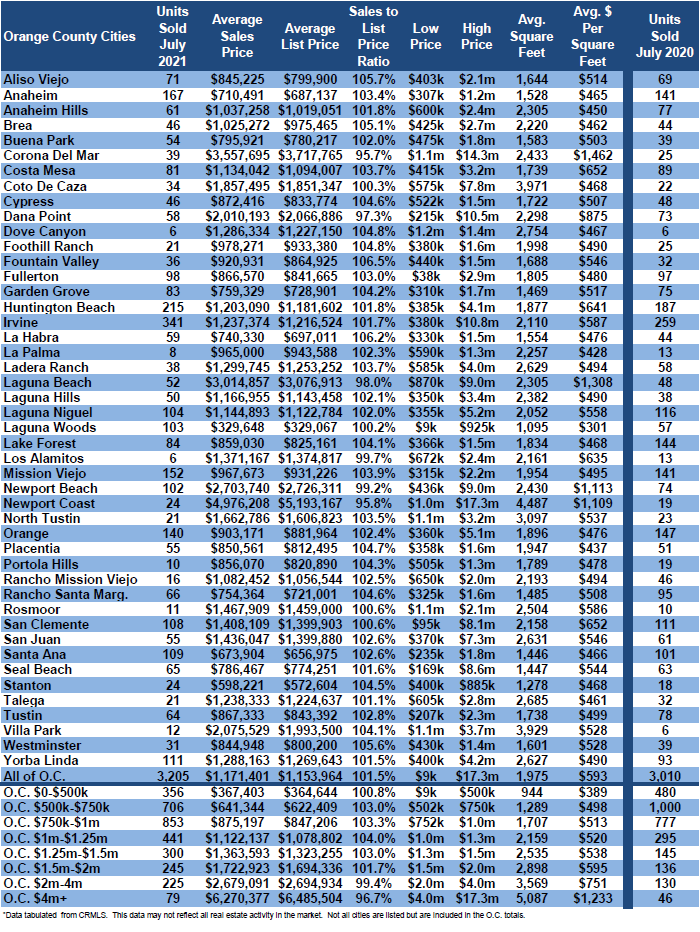
• There were 3,205 closed residential resales in July, 6% more than July 2020’s 3,011 closed sales. July marked a 10% drop compared to June 2021. The sales to list price ratio was 101.5% for all of Orange County. Foreclosures accounted for just 0.2% of all closed sales, and short sales accounted for 0.2%. That means that 99.6% of all sales were good ol’ fashioned sellers with equity.
Have a great week.
Sincerely,
Steven Thomas
Quantitative Economics and Decision Sciences
Cell 949.874.8221
Copyright 2021- Steven Thomas, Reports On Housing – All Rights Reserved. This report may not be reproduced in whole or part without express written permission by author.