Summer Transition

June 14, 2021
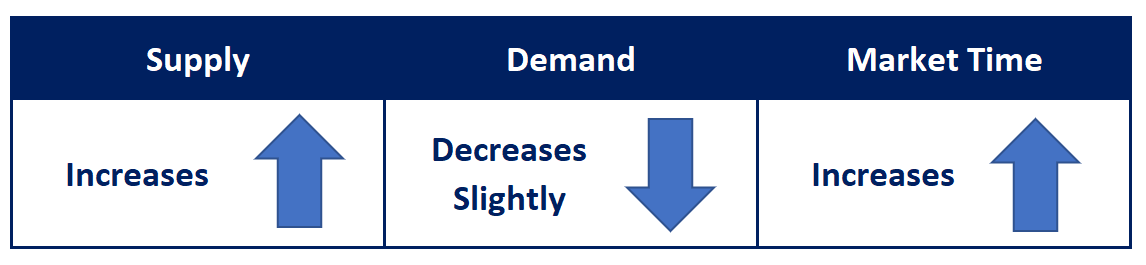
The Summer Market is officially here and with it typically
comes an increase in the inventory, a slight drop in
demand, and a rise in market time.
Summer Market
Expect a downshift from the Spring Market to the Summer Market.
The end of the school year has finally arrived, and diplomas have been distributed at festive commencement ceremonies. The temperature is heating up and the days are growing longer. The 4th of July is less than three weeks away, and family vacations are booked. From the pool to the beach to hiking Southern California’s many trails, summer is here along with all its distractions. Toss in the fact that everybody can walk the earth freely again now that COVID-19 is disappearing. Everyone is ready to enjoy a bit of fun in the sun.
The distractions of summer impact the housing market. The busiest time of the year in terms of demand, the Spring Market, comes to an end with the conclusion of the school year and graduations. The Summer Market lasts from the end of May to the start of school at the end of August. Summer is when active buyers are pulled away from the frantic pace of housing. Kids are home and parents are busy carpooling to camps, water parks, pools, beaches, and friends’ houses.
During the Summer Market demand decreases slightly. There are fewer new escrows opened due to buyers placing their home search tours on pause to take a short break and enjoy all the trappings of summer. With demand dropping, the supply of available homes rises as more homeowners place their homes on the market. Many often mistake the Summer Market as the best time of the year to sell a home. In terms of new escrow activity, it is second to the Spring Market. With an increasing supply and falling demand, the Expected Market Time (the amount of time between hammering in the FOR-SALE sign to opening escrow) increases.
In reviewing these trends, many buyers may get ahead of themselves and expect the market to line up in their favor. That is not the case. Instead, the market will remain a Hot Seller’s Market, yet the frantic pace will slow. The changes will be subtle and, over time, will reveal a trend that will result in a shift in the market.
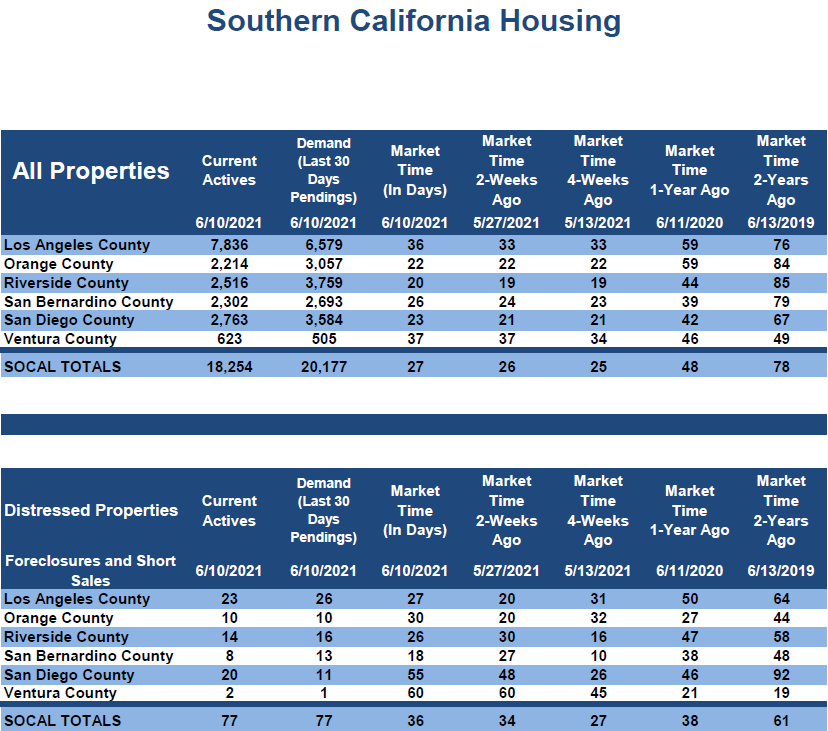
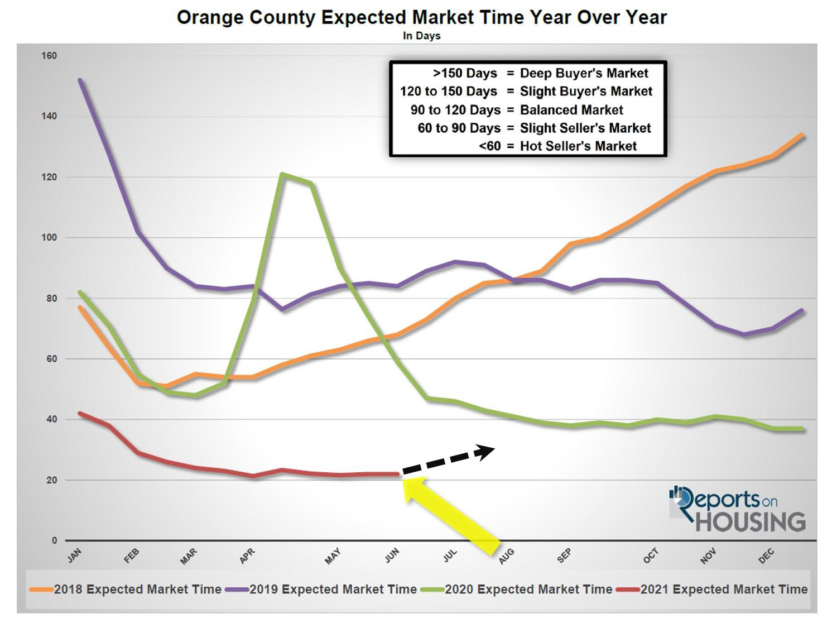
In looking at the 5-year average from 2015 through 2019 (excluding 2020 due to COVID-19 skewing the data), the supply of homes has increased by 9% from the end of May to the end of July. On average, demand dropped by 6%, and the Expected Market Time increased by 11 days. That would be an increase in the supply of available homes from 2,214 today to 2,803 homes by the end of July. Demand would drop from 3,057 pending sales to 2,907. With a rising supply and falling demand, the Expected Market Time would rise from 22 days, where it has been stuck for six weeks, to 29 days, the highest level since the start of February.
At 29 days the Orange County housing market is still insanely hot, but it will not be as hot as today. It is like comparing a 100-degree heat wave to a 116-degree heat wave. It is still extremely hot, just a bit more tolerable. The market will still be laced with plenty of showings, multiple offers, and sales prices above their list prices, only slightly muted. The change will be characterized by not quite as many showings, not quite as many multiple offers, and sales prices not quite as much above their list prices.
The word on the street within the real estate trenches is that there are already signs of the “summer shift.” A home might not sell in 4 days after being exposed to the market for only a weekend. Instead, it may take two weekends. Homes that are grossly overpriced will have to reduce their asking price. Surprisingly, 6% of the active listing inventory had to reduce their asking price over the past week. Many will scratch their collective heads and wonder what is going on in the market. The answer is simple: SUMMER. It happens every year, and it appears as if this year will be no exception.
Active Listings
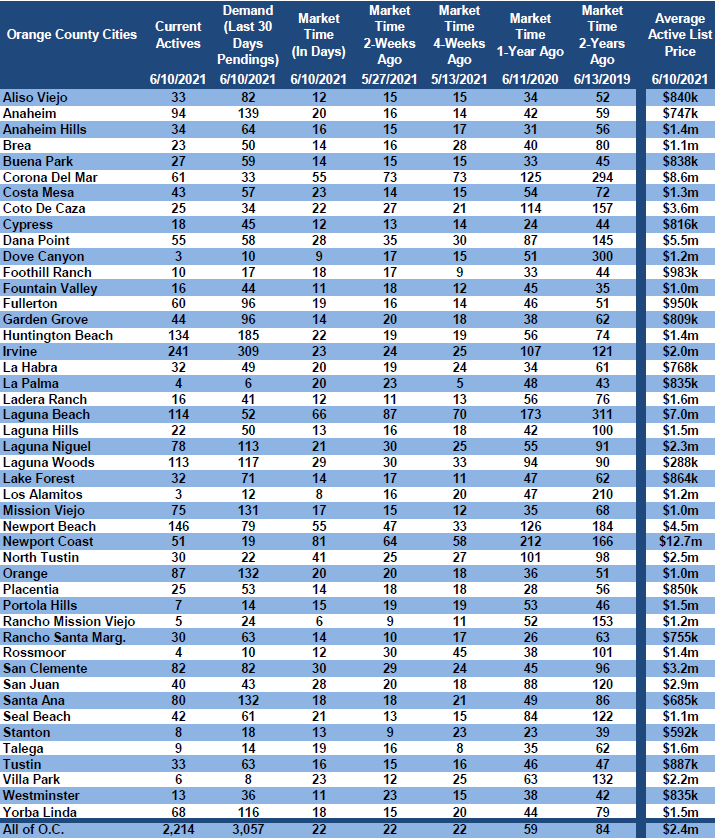
The current active inventory declined by 37 homes in the past 2-weeks.
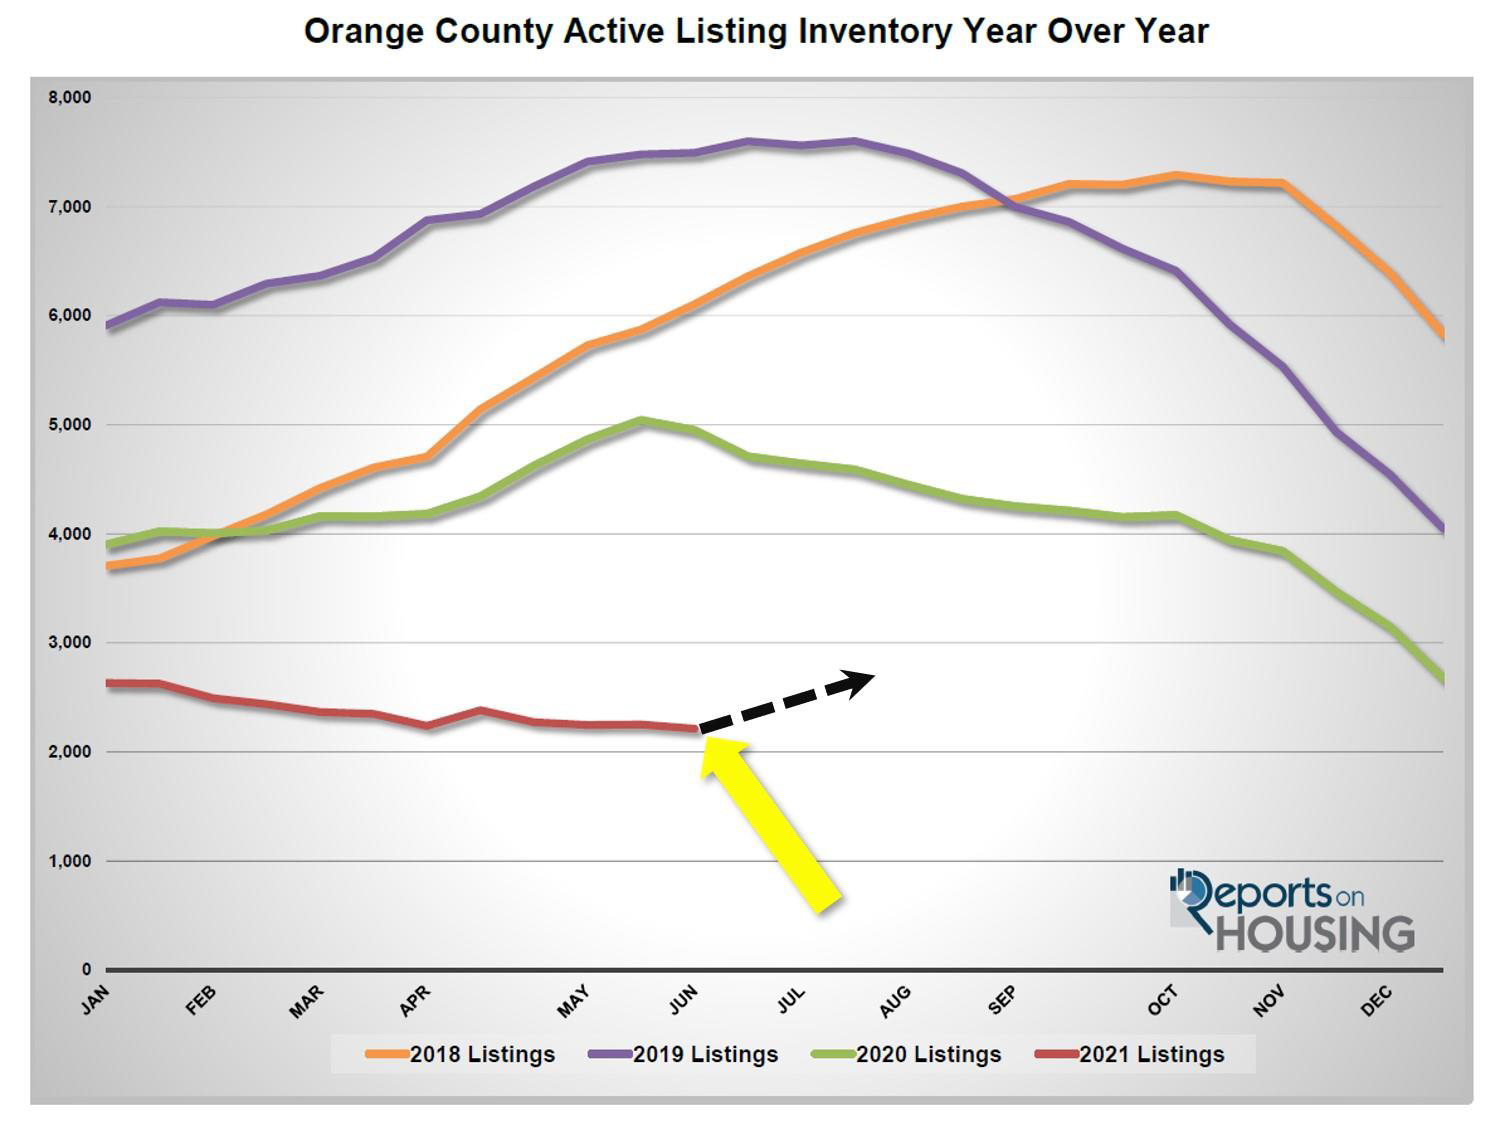
The active listing inventory shed 37 homes in the past couple of weeks, down 1.6%, and now sits at 2,214 homes. Even with the drop, summer is here, which will be accompanied by a slight drop in demand that will result in an increase in the supply of available homes to purchase. The supply will continue to increase through the summer months. Typically, the inventory peaks between July and August, but this year may be different. Mortgage rates are anticipated to increase during the summer, resulting in a further decrease in demand. When rates rise during the summer months, like it did back in 2013, the second hottest market behind today, the inventory does not peak until the fall. This is due to overpriced homes lingering on the market a bit longer. These sellers are a bit overzealous.
Since comparing year over year data in housing is not accurate this year due to COVID-19 skewing the data last year, it is much better to compare current levels to the 5-year average from 2015 to 2019. In May, there were 702 fewer new FOR-SALE signs in Orange County, 17% less than the 5-year average. The lack of available replacement homes has many homeowners alarmed about selling. They are fearful that there will be “nothing to buy,” limiting the number willing to participate. Also, with home values swiftly appreciating, homeowners are more than happy to sit on the sidelines and watch their equity grow, buying time until the market cools slightly and allows more purchase choices. This will continue to be an issue until rates rise, resulting in the inventory rising from its ultra-low levels.
Last year at the start of June, there were 4,950 homes on the market, 2,736 additional homes, or 124% more. The 5-year average from 2015 to 2019 is 6,529, an extra 4,315 homes, or 194% more, nearly triple today’s level. There was an overabundance of choices for buyers compared to today.
Demand
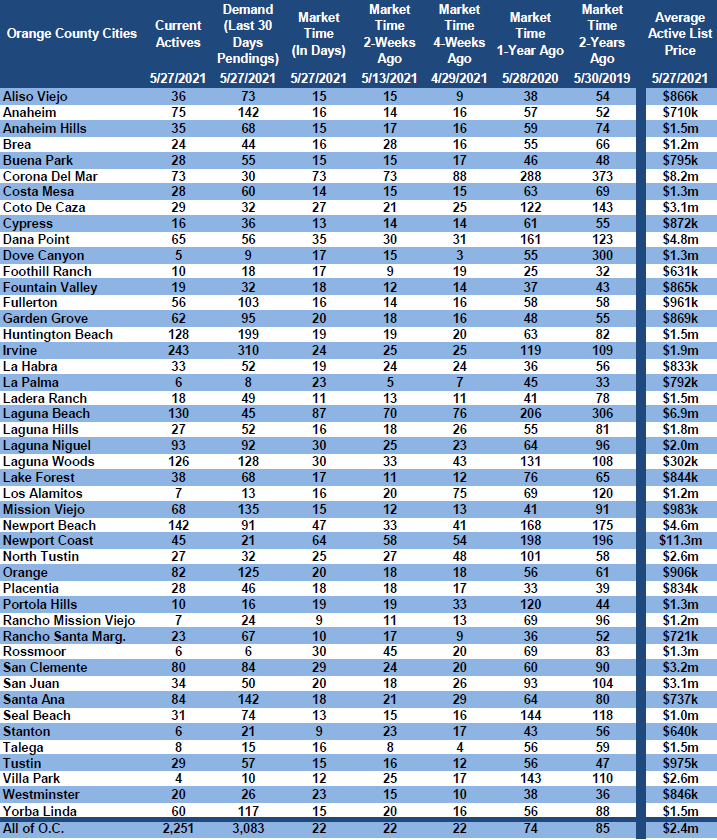
Demand decreased by 1% in the past couple of weeks
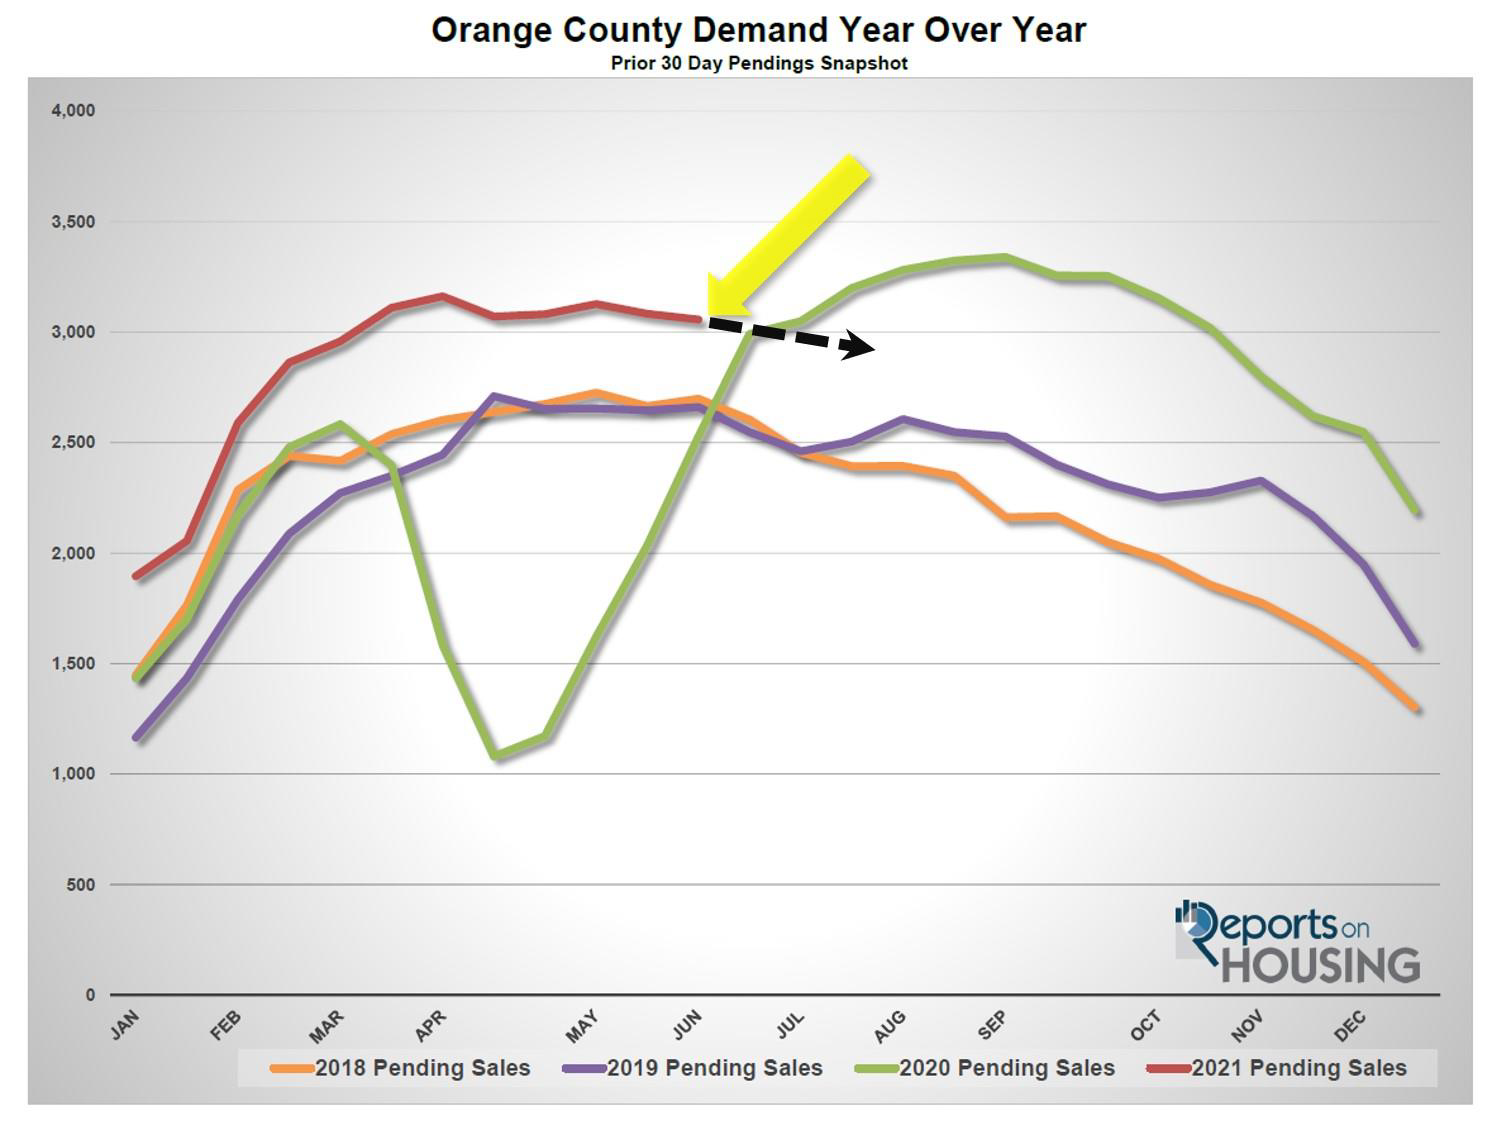
Demand, a snapshot of the number of new pending sales over the prior month, decreased from 3,083 to 3,057 in the past couple of weeks, shedding 26 pending sales, down 1%. It appears as if demand peaked back in March at 3,162 pending sales. Summer and its distractions have arrived. This year the distractions will be amplified with the end of so many COVID-19 restrictions on June 15th. Everybody is ready to enjoy the summer that they skipped last year. It is pent-up summer fun that will result in a slight decline in the number of buyers in the marketplace and, ultimately, slightly fewer escrows.
Last year, demand was at 2,529 and was rocketing upward as the housing market was swiftly recovering from the depths of the start of the pandemic. The 5-year average for demand from 2015 through 2019 (intentionally omitting 2020 due to COVID-19 skewing the data) was at 2,864 pending sales, 193 fewer pending sales, or 6% less.
In the past two-weeks the Expected Market Time (the number of days to sell all Orange County listings at the current buying pace) remained unchanged at 22 days. It has been stuck at 22 days since the end of April. It is a very Hot Seller’s Market (less than 60 days) where there are a ton of showings, sellers get to call the shots during the negotiating process, multiple offers are the norm, and home values are rising rapidly. Last year the Expected Market Time was at 59 days, slower than today, but improving rapidly. The 5-year average from 2015 through 2019 was at 69 days, much slower than today, but still a Slight Seller’s Market.
Luxury End
Both the luxury supply and luxury demand dropped in the past couple of weeks.
In the past two weeks the luxury inventory of homes priced above $1.5 million decreased by 23 homes, down 3%, and now sits at 769. At the same time, luxury demand decreased by 26 pending sales, down 5%, and now sits at 471. It appears as if luxury demand peaked at the end of April at 527 pending sales; thus, it has dropped by 11% since. With demand dropping faster than the supply, the overall Expected Market Time for luxury homes priced above $1.5 million increased from 48 to 49 days, still a very Hot Seller’s Market.
Expect the luxury market to continue to slightly cool with all the distractions of summer.
Year over year, luxury demand is up by 199 pending sales, or 73%, and the active luxury listing inventory is down by 650 homes, or 46%. The Expected Market Time last year was at 157 days and was dropping like a rock as housing was starting to soar. Year over year statistics for luxury will be much more comparable starting in July.
For homes priced between $1.5 million and $2 million, the Expected Market Time remained unchanged at 28 days. For homes priced between $2 million and $4 million, the Expected Market Time increased from 41 to 44 days. For homes priced above $4 million, the Expected Market Time increased from 126 to 134 days. At 134 days, a seller would be looking at placing their home into escrow around October 2021.
Orange County Housing Summary
• The active listing inventory shed 37 homes in the past two-weeks, down 1.6%, and now totals 2,214. In May, there were 17% fewer homes that came on the market compared to 5-year average between 2015 to 2019 (2020 was skewed do to COVID-19), 702 less. Last year, there were 4,950 homes on the market, 2,736 additional homes, or 124% more.
• Demand, the number of pending sales over the prior month, decreased by 26 pending sales in the past two-weeks, down 1%, and now totals 3,057. Rates remain below 3%, maintaining demand’s current brisk pace. Last year, there were 2,529 pending sales, 17% fewer than today. Keep in mind, housing was improving rapidly in May and June as rates dropped to historically low levels.
• The Expected Market Time, the number of days to sell all Orange County listings at the current buying pace, remained unchanged at 22 days in the past couple of weeks, an extremely Hot Seller’s Market (less than 60 days). It was at 74 days last year, slower than today.
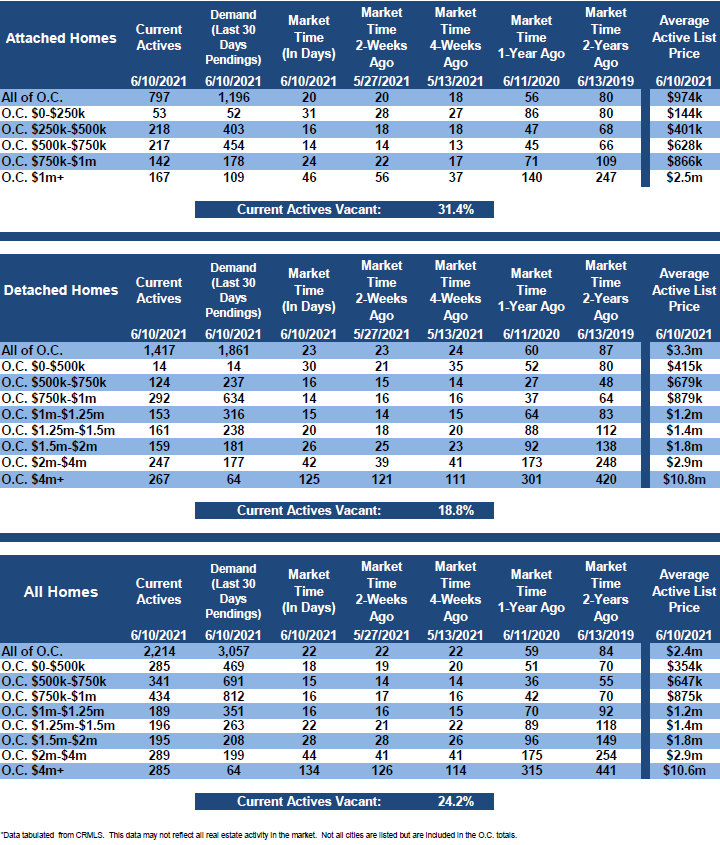
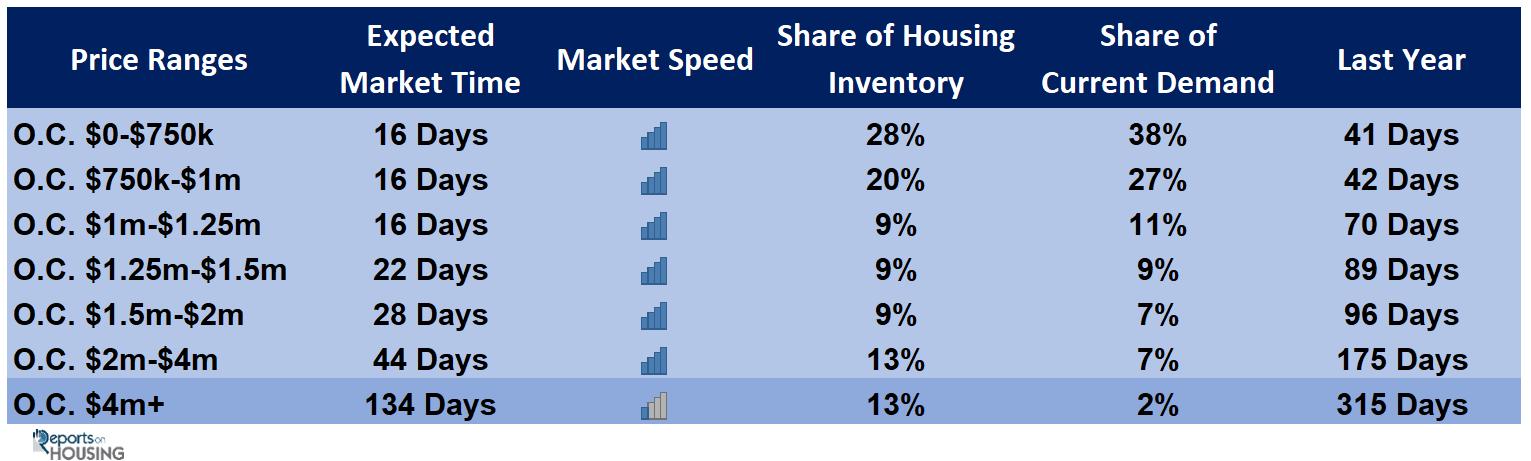
• For homes priced below $750,000, the market is a Hot Seller’s Market (less than 60 days) with an Expected Market Time of 16 days. This range represents 28% of the active inventory and 38% of demand.
• For homes priced between $750,000 and $1 million, the Expected Market Time is 16 days, a Hot Seller’s Market. This range represents 20% of the active inventory and 27% of demand.
• For homes priced between $1 million to $1.25 million, the Expected Market Time is 16 days, a Hot Seller’s Market.
• For homes priced between $1.25 million to $1.5 million, the Expected Market Time is 22 days, a Hot Seller’s Market.
• For homes priced between $1.5 million and $2 million, the Expected Market Time remained unchanged at 28 days. For homes priced between $2 million and $4 million, the Expected Market Time increased from 41 to 44 days. For homes priced above $4 million, the Expected Market Time increased from 126 to 134 days.
• The luxury end, all homes above $1.5 million, accounts for 35% of the inventory and 16% of demand.
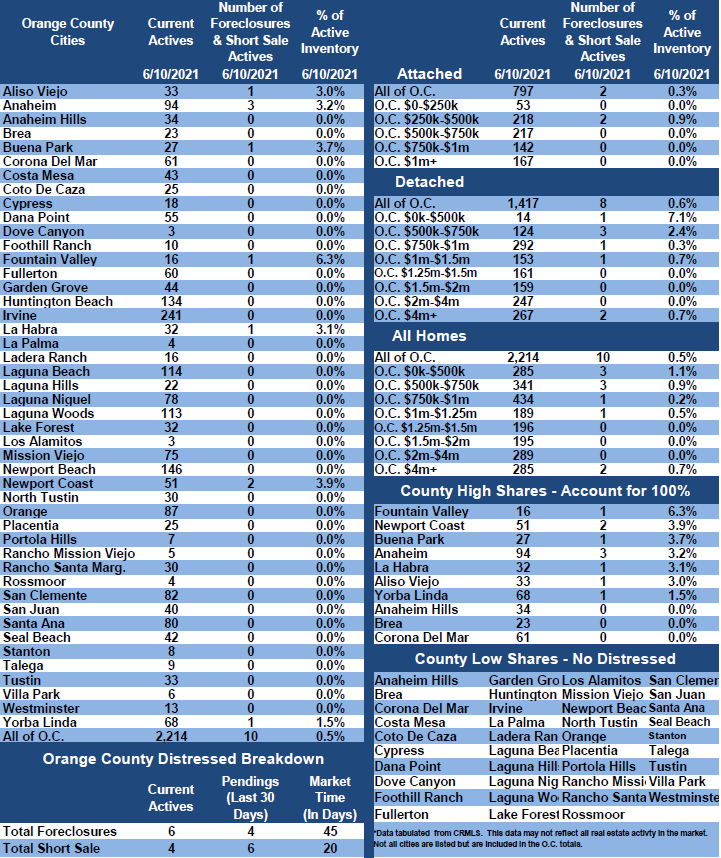
• Distressed homes, both short sales and foreclosures combined, made up only 0.5% of all listings and 0.3% of demand. There are only 6 foreclosures and 4 short sales available to purchase today in all of Orange County, 10 total distressed homes on the active market, no change from two-weeks ago. Last year there were 24 total distressed homes on the market, more than today.
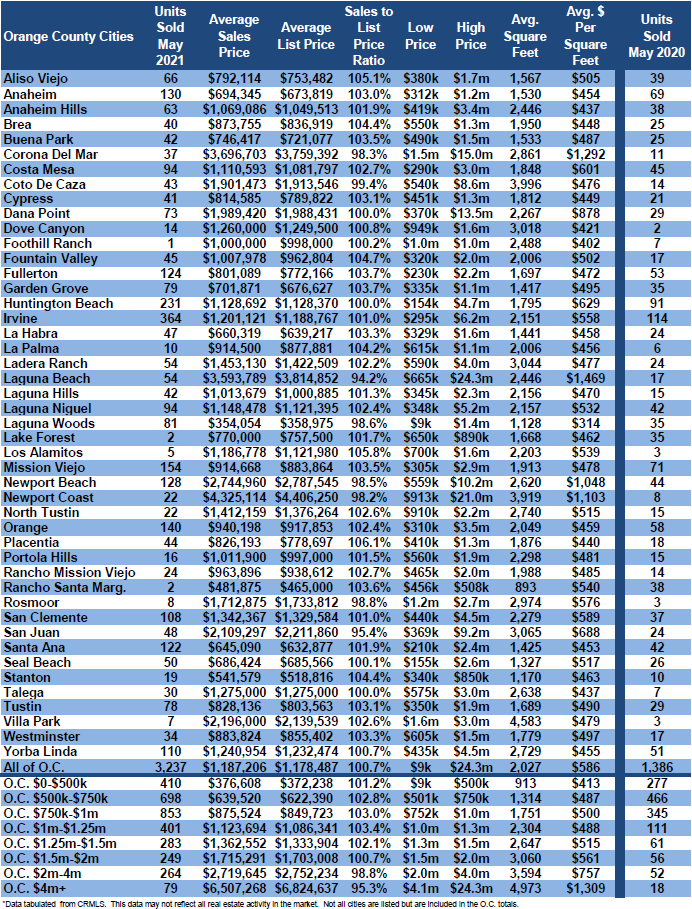
• There were 3,237 closed residential resales in May, 134% more than May 2020’s 1,386 closed sales. May marked an 7% decline from April 2021. The sales to list price ratio was 100.7% for all of Orange County. Foreclosures accounted for just 0.1% of all closed sales, and short sales accounted for 0.1%. That means that 99.8% of all sales were good ol’ fashioned sellers with equity.
Have a great week.
Sincerely,
Steven Thomas
Quantitative Economics and Decision Sciences
Cell 949.874.8221
Copyright 2021- Steven Thomas, Reports On Housing – All Rights Reserved. This report may not be reproduced in whole or part without express written permission by author.