
May 4, 2021
The lower price ranges are disappearing with far fewer
homes available to purchase, and it is impacting the
number of affordable closed sales.
Vanishing Lower Ranges
A mind-blowing 29% fewer homes have come on the market below $750,000 so far this year.
For the most part, prices do not remain the same. Over time, just about everything becomes more expensive. After a while, society digests the higher values. Gasoline was $1.12 per gallon back in 2002, compared to $4.20 today. A visit to the Magic Kingdom would set a Mickey Mouse fan back $41 back in 2000, a lot cheaper than the $114 Disneyland ticket this month. In 2010, mouth-watering, sliced bacon was selling for $3.86 per pound versus $5.85 today. Change is inevitable, and so are higher prices.
Housing is definitely not an exception to increasing prices. In the first quarter of 2012, there were 5,553 closed sales below $750,000, 87% of all sales. It was 71% of all sales in 2016, and 51% last year. In 2021, only 41% of all sales were below $750,000 in the first quarter. As home prices have appreciated over the years, the lower price ranges have dwindled and became a smaller percentage of the housing stock. It is not merely the fact that fewer homeowners within these more affordable price ranges have not placed their homes on the market; instead, it has more to do with home values appreciating and surpassing the lower range thresholds. These ranges are vanishing.
The data illustrate just how staggering the shortage of lower range homes has become this year. Through April 15th, compared to the average of 2018 and 2019 (year over year data in housing is not accurate this year due to COVID-19 skewing housing in 2020), an astonishing 31% fewer homes have been placed on the market below $500,000 and 29% fewer for homes between $500,000 and $750,000. Overall, in Orange County, there are 4% fewer homes that were placed on the market. Yet above $750,000, there were 23% more FOR-SALE signs. Due to record low mortgage rates, the active listing inventory is at unprecedented ultra-low levels in every price range, but the differences are more staggering below $750,000. There are 647 homes available today below $750,000, which is 28% all active listings, compared to the 2018 to 2019 average of 2,365 homes, or 37% of all listings.
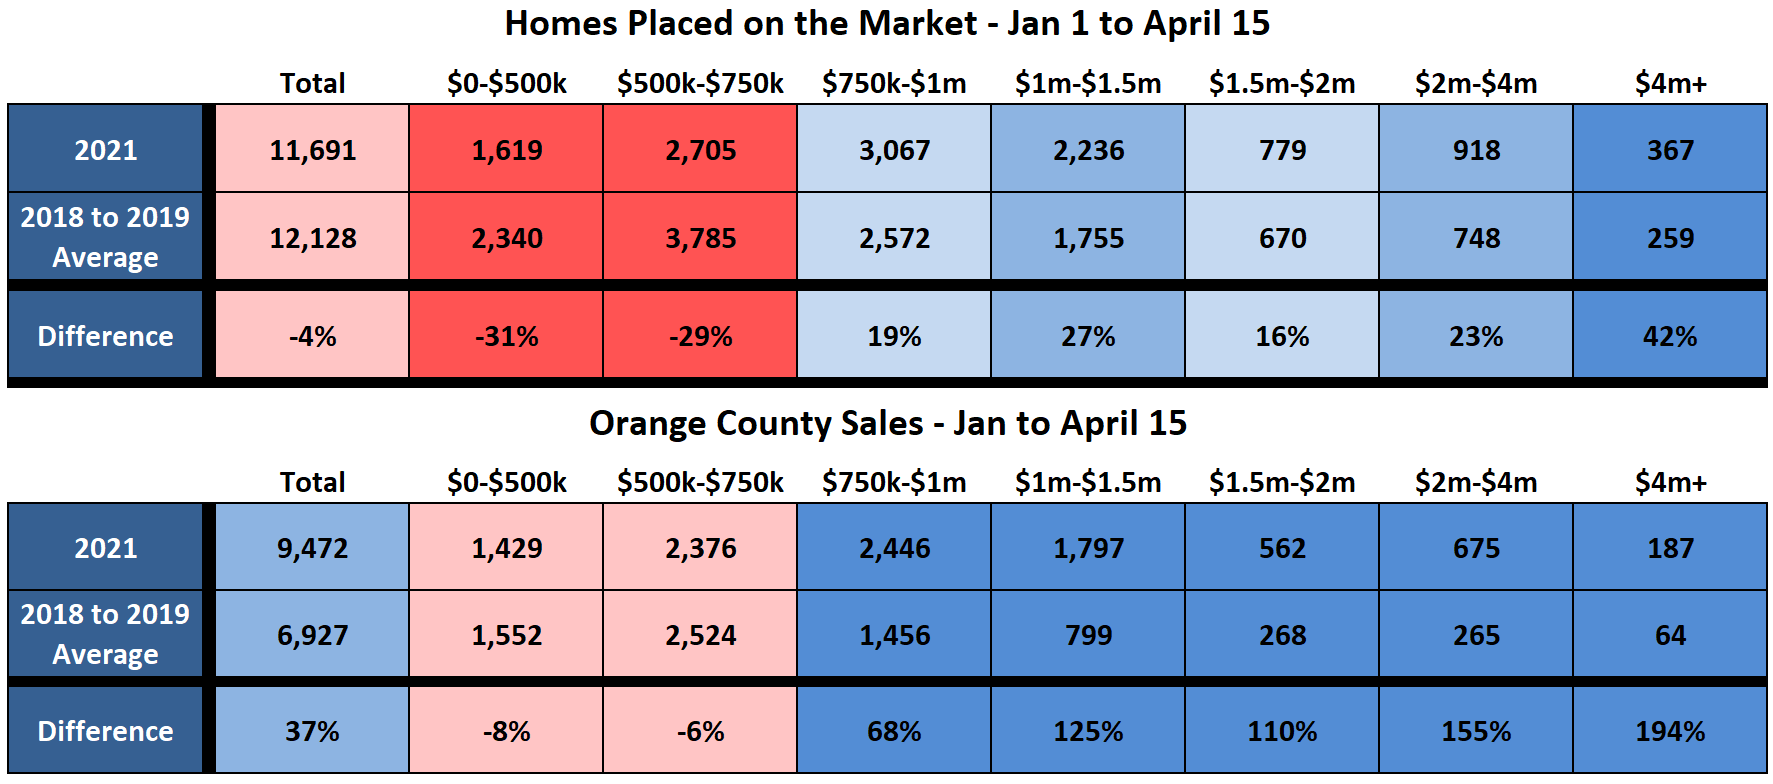
Closed sales in Orange County are off the charts. It is the strongest start to a year since 2005. Compared to the average from 2018 to 2019, sales were up 37%, an extra 2,545 closed sales. Yet, homes below $500,000 were off by 8%, and homes from $500,000 to $750,000 were off by 6%. The number of closed sales above $750,000 is mind-blowing. There were 68% more closed sales from $750,000 to $1 million, an extra 990. All price ranges above $1 million experienced at least double the number of closed sales. Above $4 million, ultra-luxury, it was nearly triple the number of sales, up 194%.
The erosion of more affordable housing has been going on for years. This trend will continue as long as the market remains hot. With a depressed, unfathomably low inventory and unrelenting demand fueled by record low rates, this sizzling market is poised to continue for quite some time. The torrid pace will remain through the end of 2021 and is poised to endure through 2022 as well.
For buyers anticipating more homes in the affordable price ranges coming on the market soon, it is just not going to happen. The number of opportunities is diminishing over time. Buyers who wait will be confronted with fewer available options to purchase. More and more homes are surpassing the $500,000 and $750,000 thresholds. In 2012, there were 1,941 detached single family residential homes sales below $500,00 in the first quarter, 53% of all detached closed sales, compared to 29 this year, 0.6% of all closings. In 2012, there were 1,001 detached closed sales in the first quarter between $500,000 and $750,000, 27% of all detached closings, versus 721, or 16%, this year. That means that 80% of all detached sales in 2012 were below $750,000. This year, it was just shy of 17%.
The bottom line: while it may be challenging to find a home in the lower ranges today, as homes appreciate, it will only become more challenging in the future.
Active Listings
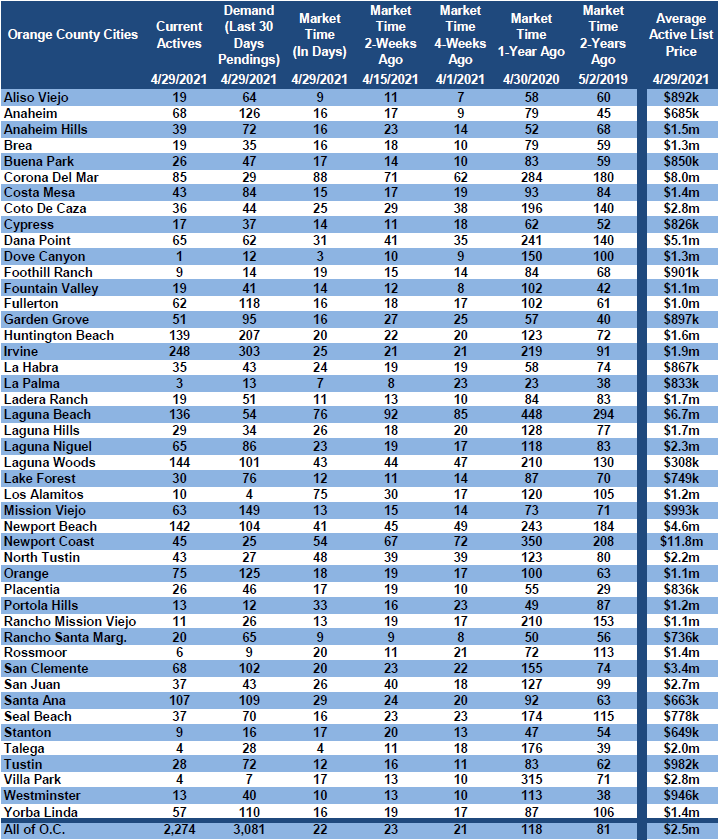
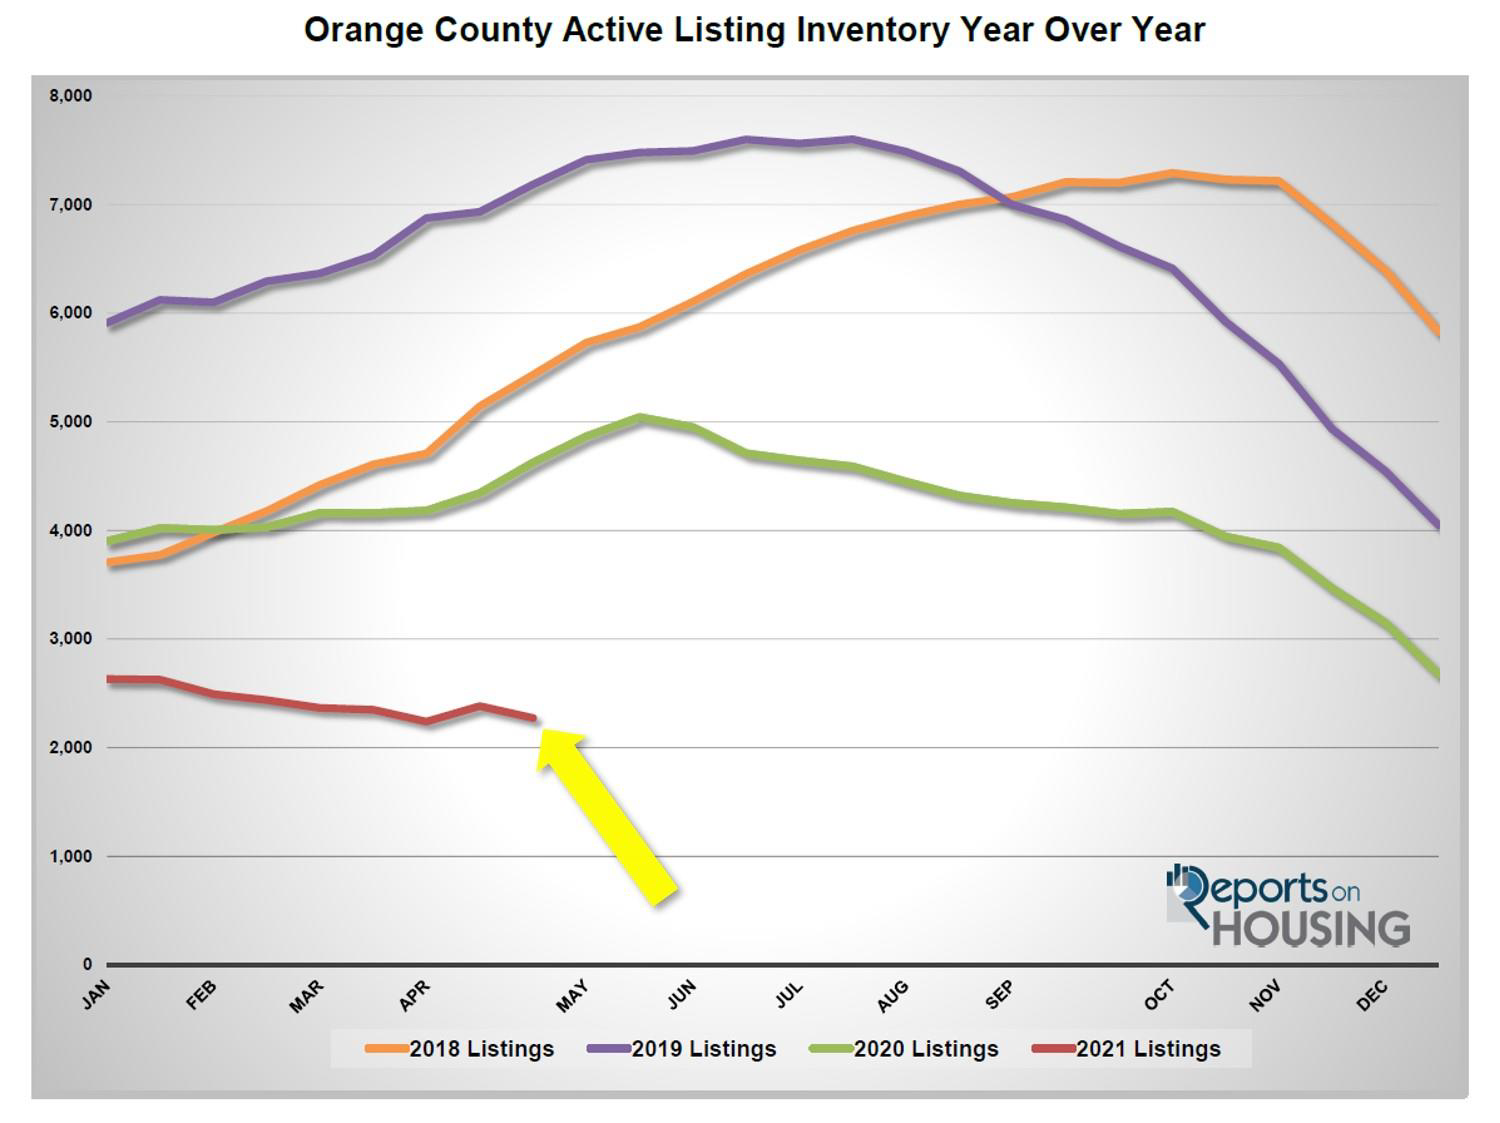
The current active inventory dropped by 5% in the past couple of weeks, its second lowest level since tracking.
The active listing inventory shed 110 homes in the past couple of weeks, down 5%, and now sits at 2,274 homes, 34 more homes than the lowest level ever since tracking began in 2004 achieved at the start of April at 2,240. The inventory looked like it was finally rising a couple of weeks ago after posting the largest increase in a year with more homes coming on the market and rates increasing slightly; yet, with elevated demand and rates easing in recent weeks, the inventory slipped back down to unprecedented levels. Homes are being placed into escrow faster than they are coming on. It will be challenging for the inventory to rise until after demand downshifts slightly during the summer months and mortgage rates rise on the backs of excellent economic news.
Since comparing year over year data in housing is not accurate this year due to COVID-19 skewing the data last year, it is much better to compare current levels to the 5-year average from 2015 to 2019. From April 1st to April 15th, there were 274 fewer new FOR-SALE signs in Orange County, 13% less than that 5-year average. This trend started in January and has resulted in fewer homes on the market to start the year. The trend is even more profound in the Inland Empire and San Diego County. The lack of available replacement homes has many homeowners alarmed about selling. They are fearful that there will be “nothing to buy,” limiting the number willing to participate. Also, while home values are soaring, many homeowners want to sit back and wait for their homes to continue to rapidly appreciate before cashing in on the market.
Last year at the end of April there were 4,625 homes on the market, 2,351 additional homes, or 103% more. The 5-year average from 2015 to 2019 is 5,940, an extra 3,666 homes, or 161% more. There were a lot more choices for buyers compared to today.
Demand
Demand did not change much in the past couple of weeks.
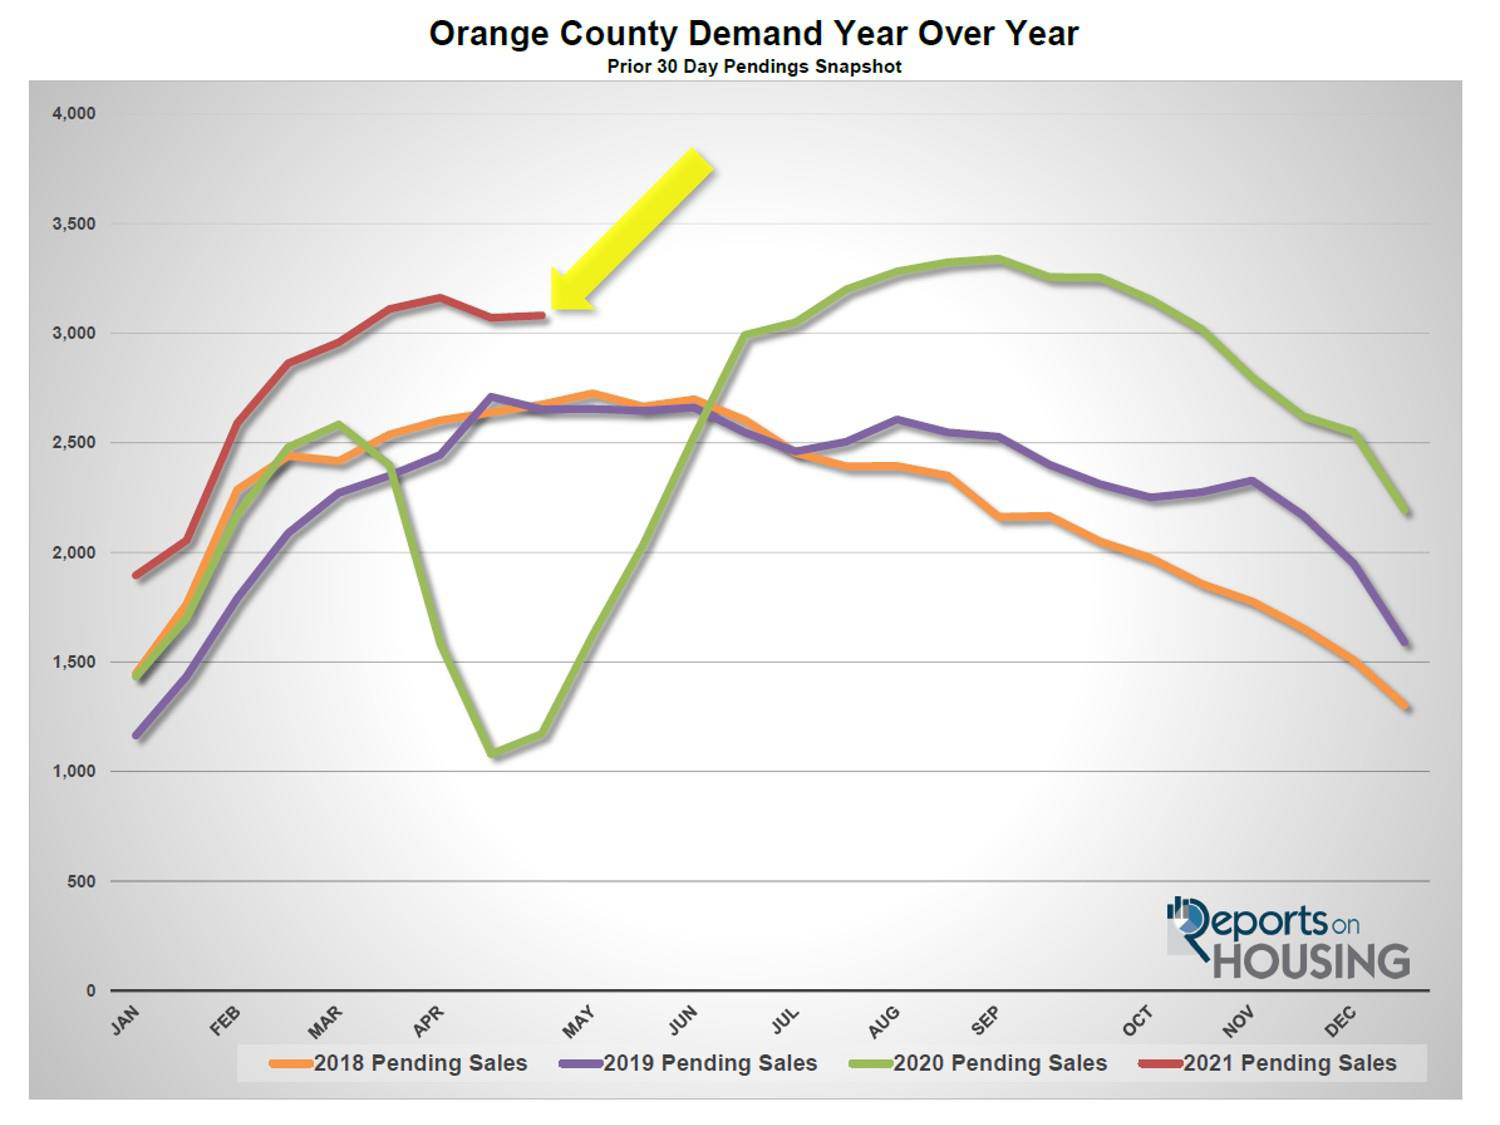
Demand, a snapshot of the number of new pending sales over the prior month, increased from 3,070 to 3,081 in the past couple of weeks, adding 11 pending sales, nearly unchanged. According to Freddie Mac’s Primary Mortgage Market Survey®, rates have dropped down to 2.98% as of April 29th, breaking below 3% for the first time since February, further fueling this crazy market. From here we can expect demand to remain elevated through the end of the month, and then ease a little bit as housing transitions to the Summer Market. Graduations, end of school activities, and the distractions of summer, from the beach to family vacations, will be magnified this year due to coming out of the COVID-19 fog now that society is getting vaccinated. Demand will decelerate slightly from the rapid pace of the Spring Market when there are fewer distractions.
Last year, demand was at 1,172, starting to rise after hitting the lowest point since the Great Recession due to the start of the pandemic. The 5-year average for demand from 2015 through 2019, a much better comparison, was at 2,931 pending sales, 150 fewer pending sales, or 5% less.
In the past two-weeks the Expected Market Time (the number of days to sell all Orange County listings at the current buying pace) decreased from 23 to 22 days. It remains a very Hot Seller’s Market (less than 60 days) where there are a ton of showings, sellers get to call the shots during the negotiating process, multiple offers are the norm, and home values are rising rapidly. Last year the Expected Market Time was at 118 days, drastically different than today. The 5-year average from 2015 through 2019 was at 61 days, much slower than today, but still a Seller’s Market.
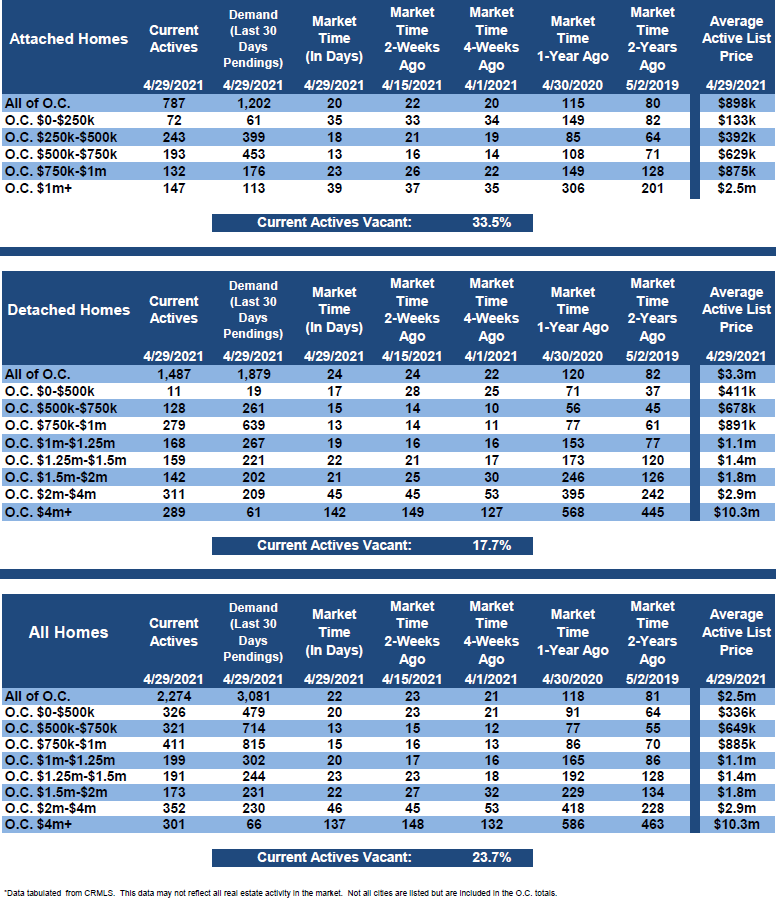
Luxury End
The luxury market improved in the past couple of weeks.
In the past two weeks the luxury inventory of homes priced above $1.5 million decreased by 48 homes, down 5%, and now sits at 826, the lowest level in years. At the same time, luxury demand increased by 5 pending sales, up 1%, and now sits at 527, its highest level ever. With the inventory dropping and demand increasing slightly, the overall Expected Market Time for luxury homes priced above $1.5 million decreased from 50 to 47 days, its strongest level on record and is technically a Hot Seller’s Market.
Expect the luxury market to continue to improve until peaking sometime this month.
Year over year, luxury demand is up by 423 pending sales, or 407%, and the active luxury listing inventory is down by 405 homes, or 33%. The Expected Market Time last year was at 355 days, substantially slower than today amidst the backdrop of the pandemic. Year over year statistics for luxury will be much more comparable starting in July.
For homes priced between $1.5 million and $2 million, the Expected Market Time decreased from 27 to 22 days. For homes priced between $2 million and $4 million, the Expected Market Time increased from 45 to 46 days. For homes priced above $4 million, the Expected Market Time decreased from 148 to 137 days. At 137 days, a seller would be looking at placing their home into escrow around September 2021.
Orange County Housing Summary
• The active listing inventory decreased by 110 homes in the past two-weeks, down 5%, and now totals 2,274, its second lowest level since tracking began in 2004 behind 2,240 achieved on April 1st. From April 1 to April 15, there were 13% fewer homes that came on the market compared to 5-year average between 2015 to 2019 (2020 was skewed do to COVID-19), 274 less. Last year, there were 4,625 homes on the market, 2,351 additional homes, or 103% more.
• Demand, the number of pending sales over the prior month, increased by 11 pending sales in the past two-weeks, nearly unchanged, and now totals 3,081. Rates dropped down to below 3% for the first time since February, keeping demand at its current brisk pace. Last year, there were 1,172 pending sales, 62% fewer than today. Keep in mind, it was the start of the pandemic too, which negatively affected demand through May.
• The Expected Market Time, the number of days to sell all Orange County listings at the current buying pace, decreased from 23 days to 22 in the past couple of weeks, an extremely Hot Seller’s Market (less than 60 days). It was at 118 days last year, slower than today.
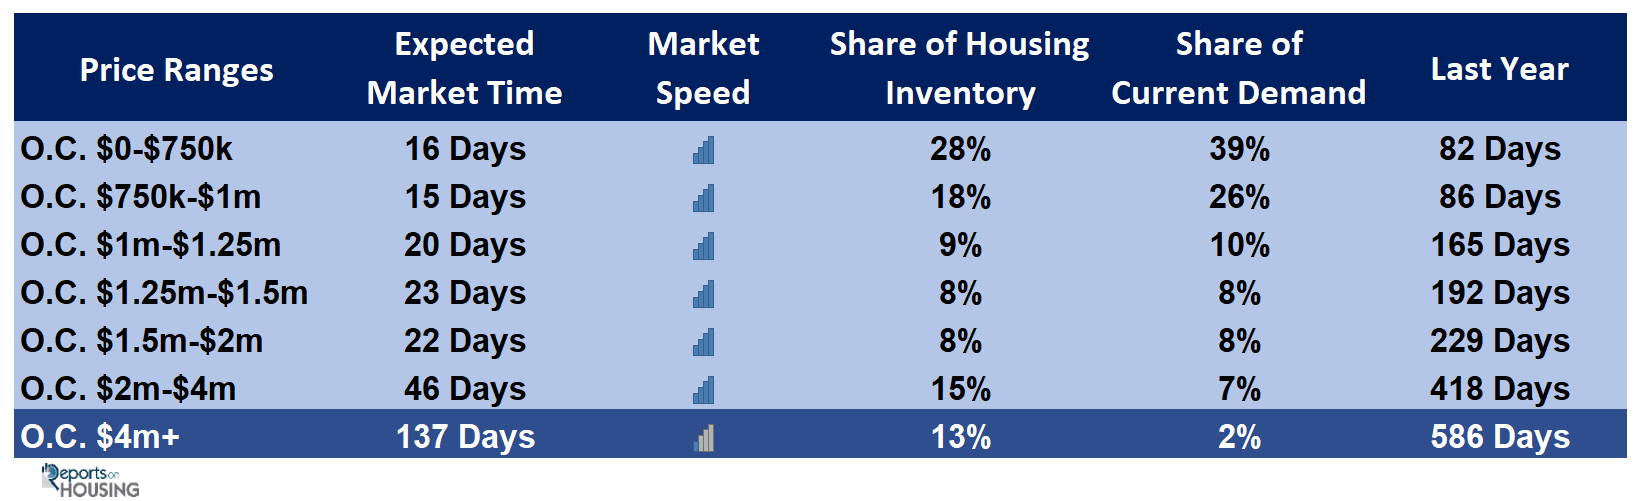
• For homes priced below $750,000, the market is a Hot Seller’s Market (less than 60 days) with an Expected Market Time of 16 days. This range represents 28% of the active inventory and 39% of demand.
• For homes priced between $750,000 and $1 million, the Expected Market Time is 15 days, a Hot Seller’s Market. This range represents 18% of the active inventory and 26% of demand.
• For homes priced between $1 million to $1.25 million, the Expected Market Time is 20 days, a Hot Seller’s Market.
• For homes priced between $1.25 million to $1.5 million, the Expected Market Time is 23 days, a Hot Seller’s Market.
• For homes priced between $1.5 million and $2 million, the Expected Market Time decreased from 27 to 22 days. For homes priced between $2 million and $4 million, the Expected Market Time increased from 45 to 46 days. For homes priced above $4 million, the Expected Market Time decreased from 148 to 137 days.
• The luxury end, all homes above $1.5 million, accounts for 36% of the inventory and 17% of demand.
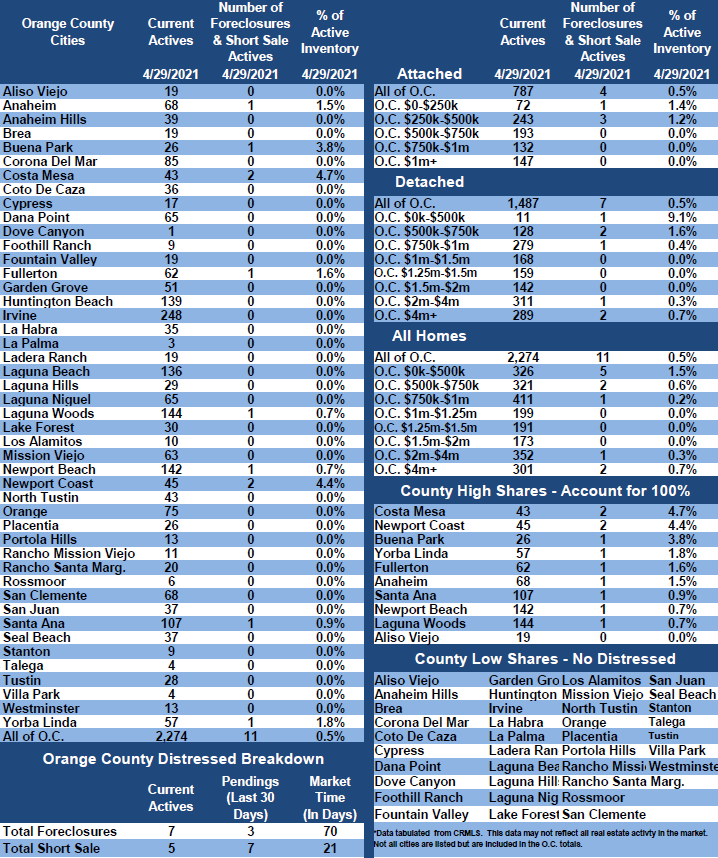
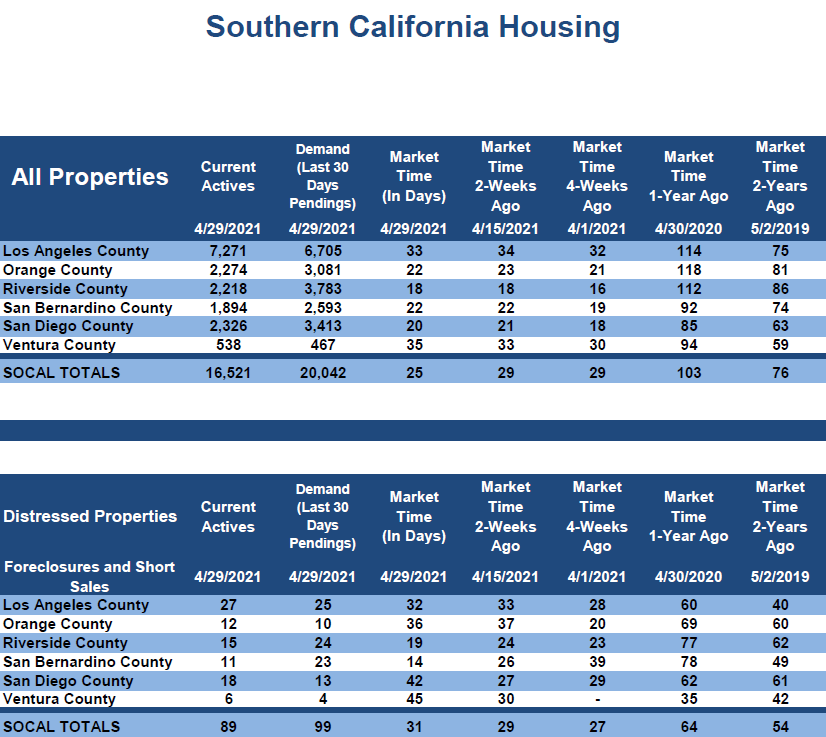
• Distressed homes, both short sales and foreclosures combined, made up only 0.5% of all listings and 0.3% of demand. There are only 7 foreclosures and 5 short sales available to purchase today in all of Orange County, 12 total distressed homes on the active market, up 1 from two-weeks ago. Last year there were 44 total distressed homes on the market, more than today.
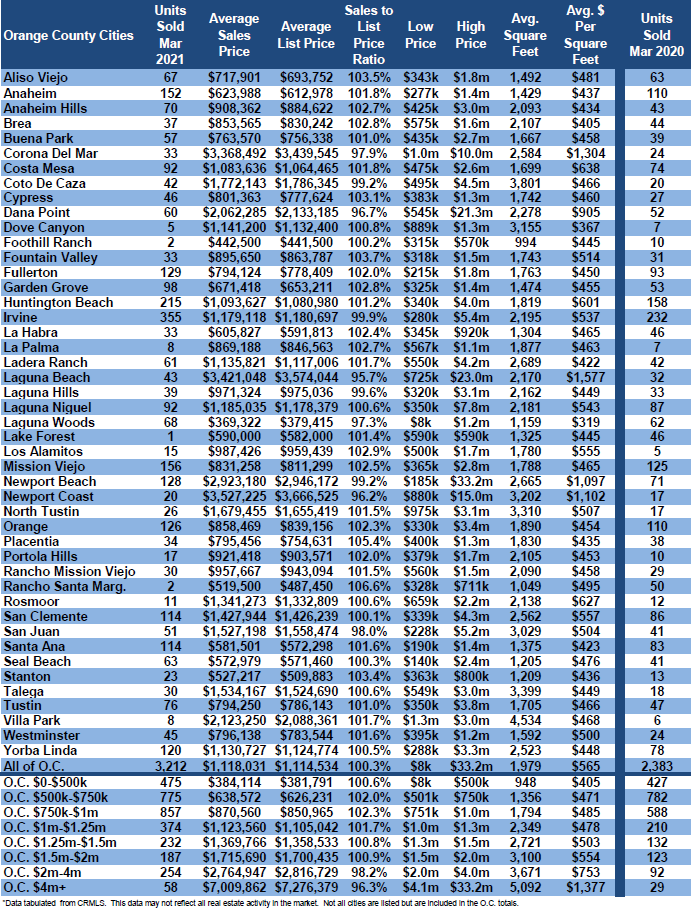
• There were 3,212 closed residential resales in March, 35% more than March 2020’s 2,383 closed sales. March marked a 41% rise over February 2021. It was the strongest March closing month since 2005. The sales to list price ratio was 100.3% for all of Orange County. Foreclosures accounted for just 0% of all closed sales, and short sales accounted for 0.09%. That means that 99.91% of all sales were good ol’ fashioned sellers with equity.
Have a great week.
Sincerely, Steven Thomas Quantitative Economics and Decision Sciences
Cell 949.874.8221
Copyright 2021- Steven Thomas, Reports On Housing – All Rights Reserved. This report may not be reproduced in whole or part without express written permission by author.