
December 13, 2021
Everyone is intensely focused on the prices of home
when the real focus should be the ability to write a check
for the monthly mortgage payment.
Monthly Mortgage Payment
The low mortgage rate environment has resulted in substantially smaller payments, allowing home prices to rise considerably as well.
Everyone is acutely aware that home prices have been soaring for the past year-and-a-half. They have far exceeded the runup in values prior to the Great Recession. This has many people on edge, wondering how values can continue to rise beyond their current record highs. In focusing just on prices, it is no wonder they fear an end to the pandemic housing run.
In analyzing today’s housing market, it is not just about home prices. Household incomes and mortgage rates over time tell a completely different story. In 1980, the median detached home price in Orange County was $108,000. That sounds incredibly cheap and an unbelievable deal; however, mortgage rates averaged 13.75% and the median household income was only $22,000. The monthly mortgage payment was a larger proportion of a new homeowner’s monthly income than today.
Similarly, in 2007, prior to the Great Recession, the median detached home price in Orange County climbed to $728,000, a lot lower than today’s $1,120,000 level as reported by the California Association of REALTORS® for the month of October. Yet, mortgage rates averaged 6.34% and the median household income was at $73,107. The monthly mortgage payment was an even larger proportion of a new homeowner’s monthly income compared to today, significantly larger.
According to Freddie Mac’s Primary Mortgage Market Survey®, a 30-year fixed rate mortgage is currently at 3.1%. Yes, rates were lower earlier this year, but in comparing today to any time prior to the start of the pandemic in March 2020, today’s rate would be a record low. The lowest rate prior to COVID occurred in November 2012 at 3.31%. Household incomes have been methodically rising over time, which will most likely surpass $100,000 in Orange County this year. The current low-rate environment, coupled with higher incomes, continues to entice a flood of buyers to pursue the purchase of a home.
In analyzing the housing market and where it stands today, home prices are a critical component, yet household incomes and mortgage rates are equally important factors as well. As household incomes rise, families’ monthly paychecks rise. As interest rates drop, home buyers are looking at smaller monthly payments. Taking a closer look at monthly payments and where they stand today, for a $1 million home and 10% down, a buyer is looking at a monthly payment of $3,843 at today’s 3.1% rate. When rates were lower this year, at 2.75%, it was a savings of $169 per month or $2,028 per year. The 5-year savings would be $10,140. Many expect rates to rise next year to
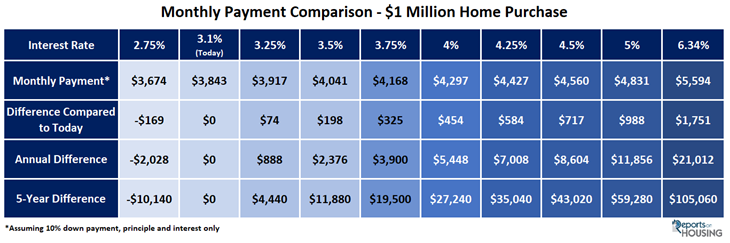
3.5%. That would be an additional $198 more per month compared to today, or $2,376 per year, or $11,880 over 5-years. At 4%, it would be an additional $5,448 per year, or $27,240 in 5-years. In November 2018, rates reached nearly 5%. That would be an extra $988 per year, or just under $12,000 annually. In 5-years, it accumulates to almost $60,000.
Prior to the Great Recession, mortgage rates were at 6.34%. For a $1 million home, the monthly payment would be $5,594 every single month. The monthly difference of $1,751 per month adds up fast. Annually, it is $21,012 more. In 5-years the difference totals $105,060.
These comparisons put today’s housing run into proper perspective. Rates are not projected to climb to 4% or higher any time soon, yet it is where rates have been in the past. The higher rates were accompanied by lower household incomes as well. Current trend lines indicate that low mortgage rates are here to stay, and household incomes will continue to methodically climb. Buyers should ultimately approach the home purchasing process by taking a careful look at their family budgets. What a buyer pays should be in alignment with their budget and monthly payment comfort level. After purchasing, buyers will be sitting down and writing a check out to the mortgage company each and every month. After closing escrow, they will no longer care too much about how much they paid for their home. Instead, they will care about the monthly mortgage payment that is deducted from their checking account for the next 30 years.
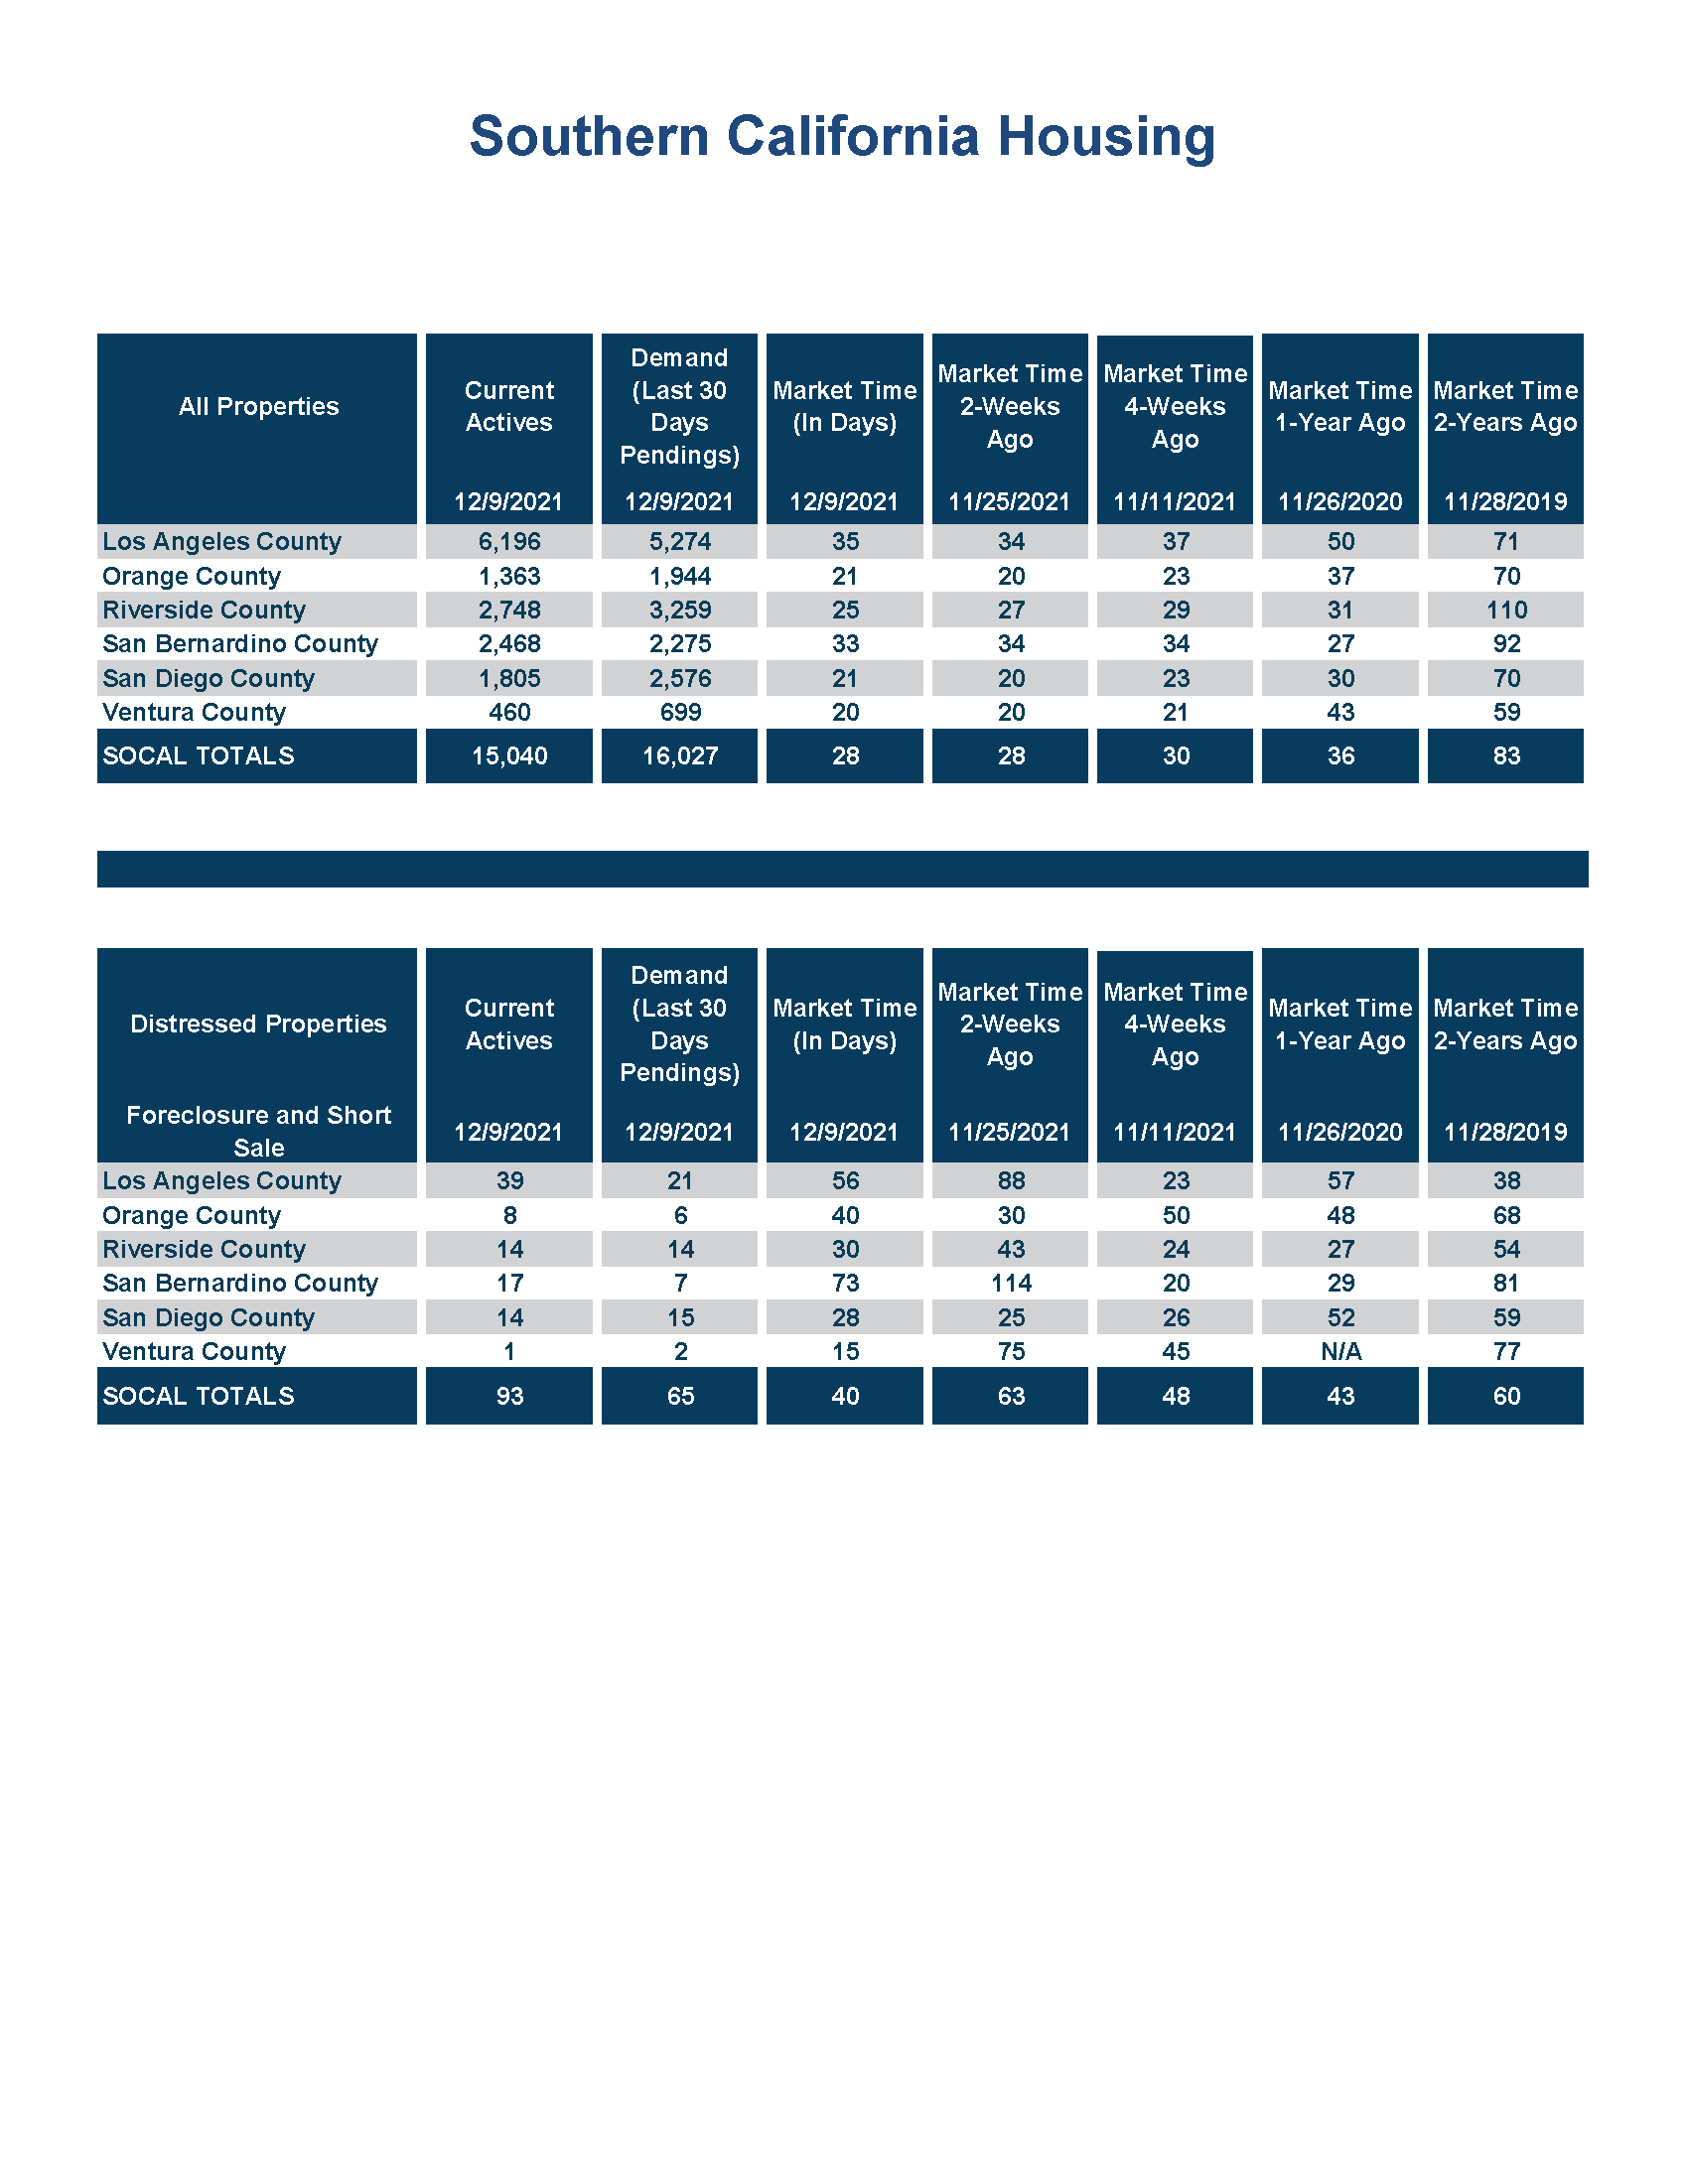
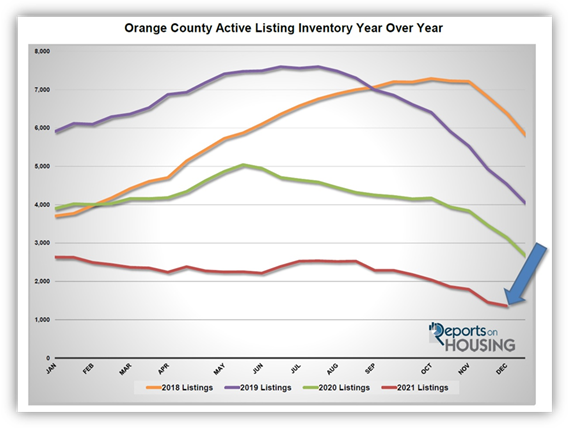
Active Listings
The current active inventory dropped another 6% in the past two weeks.
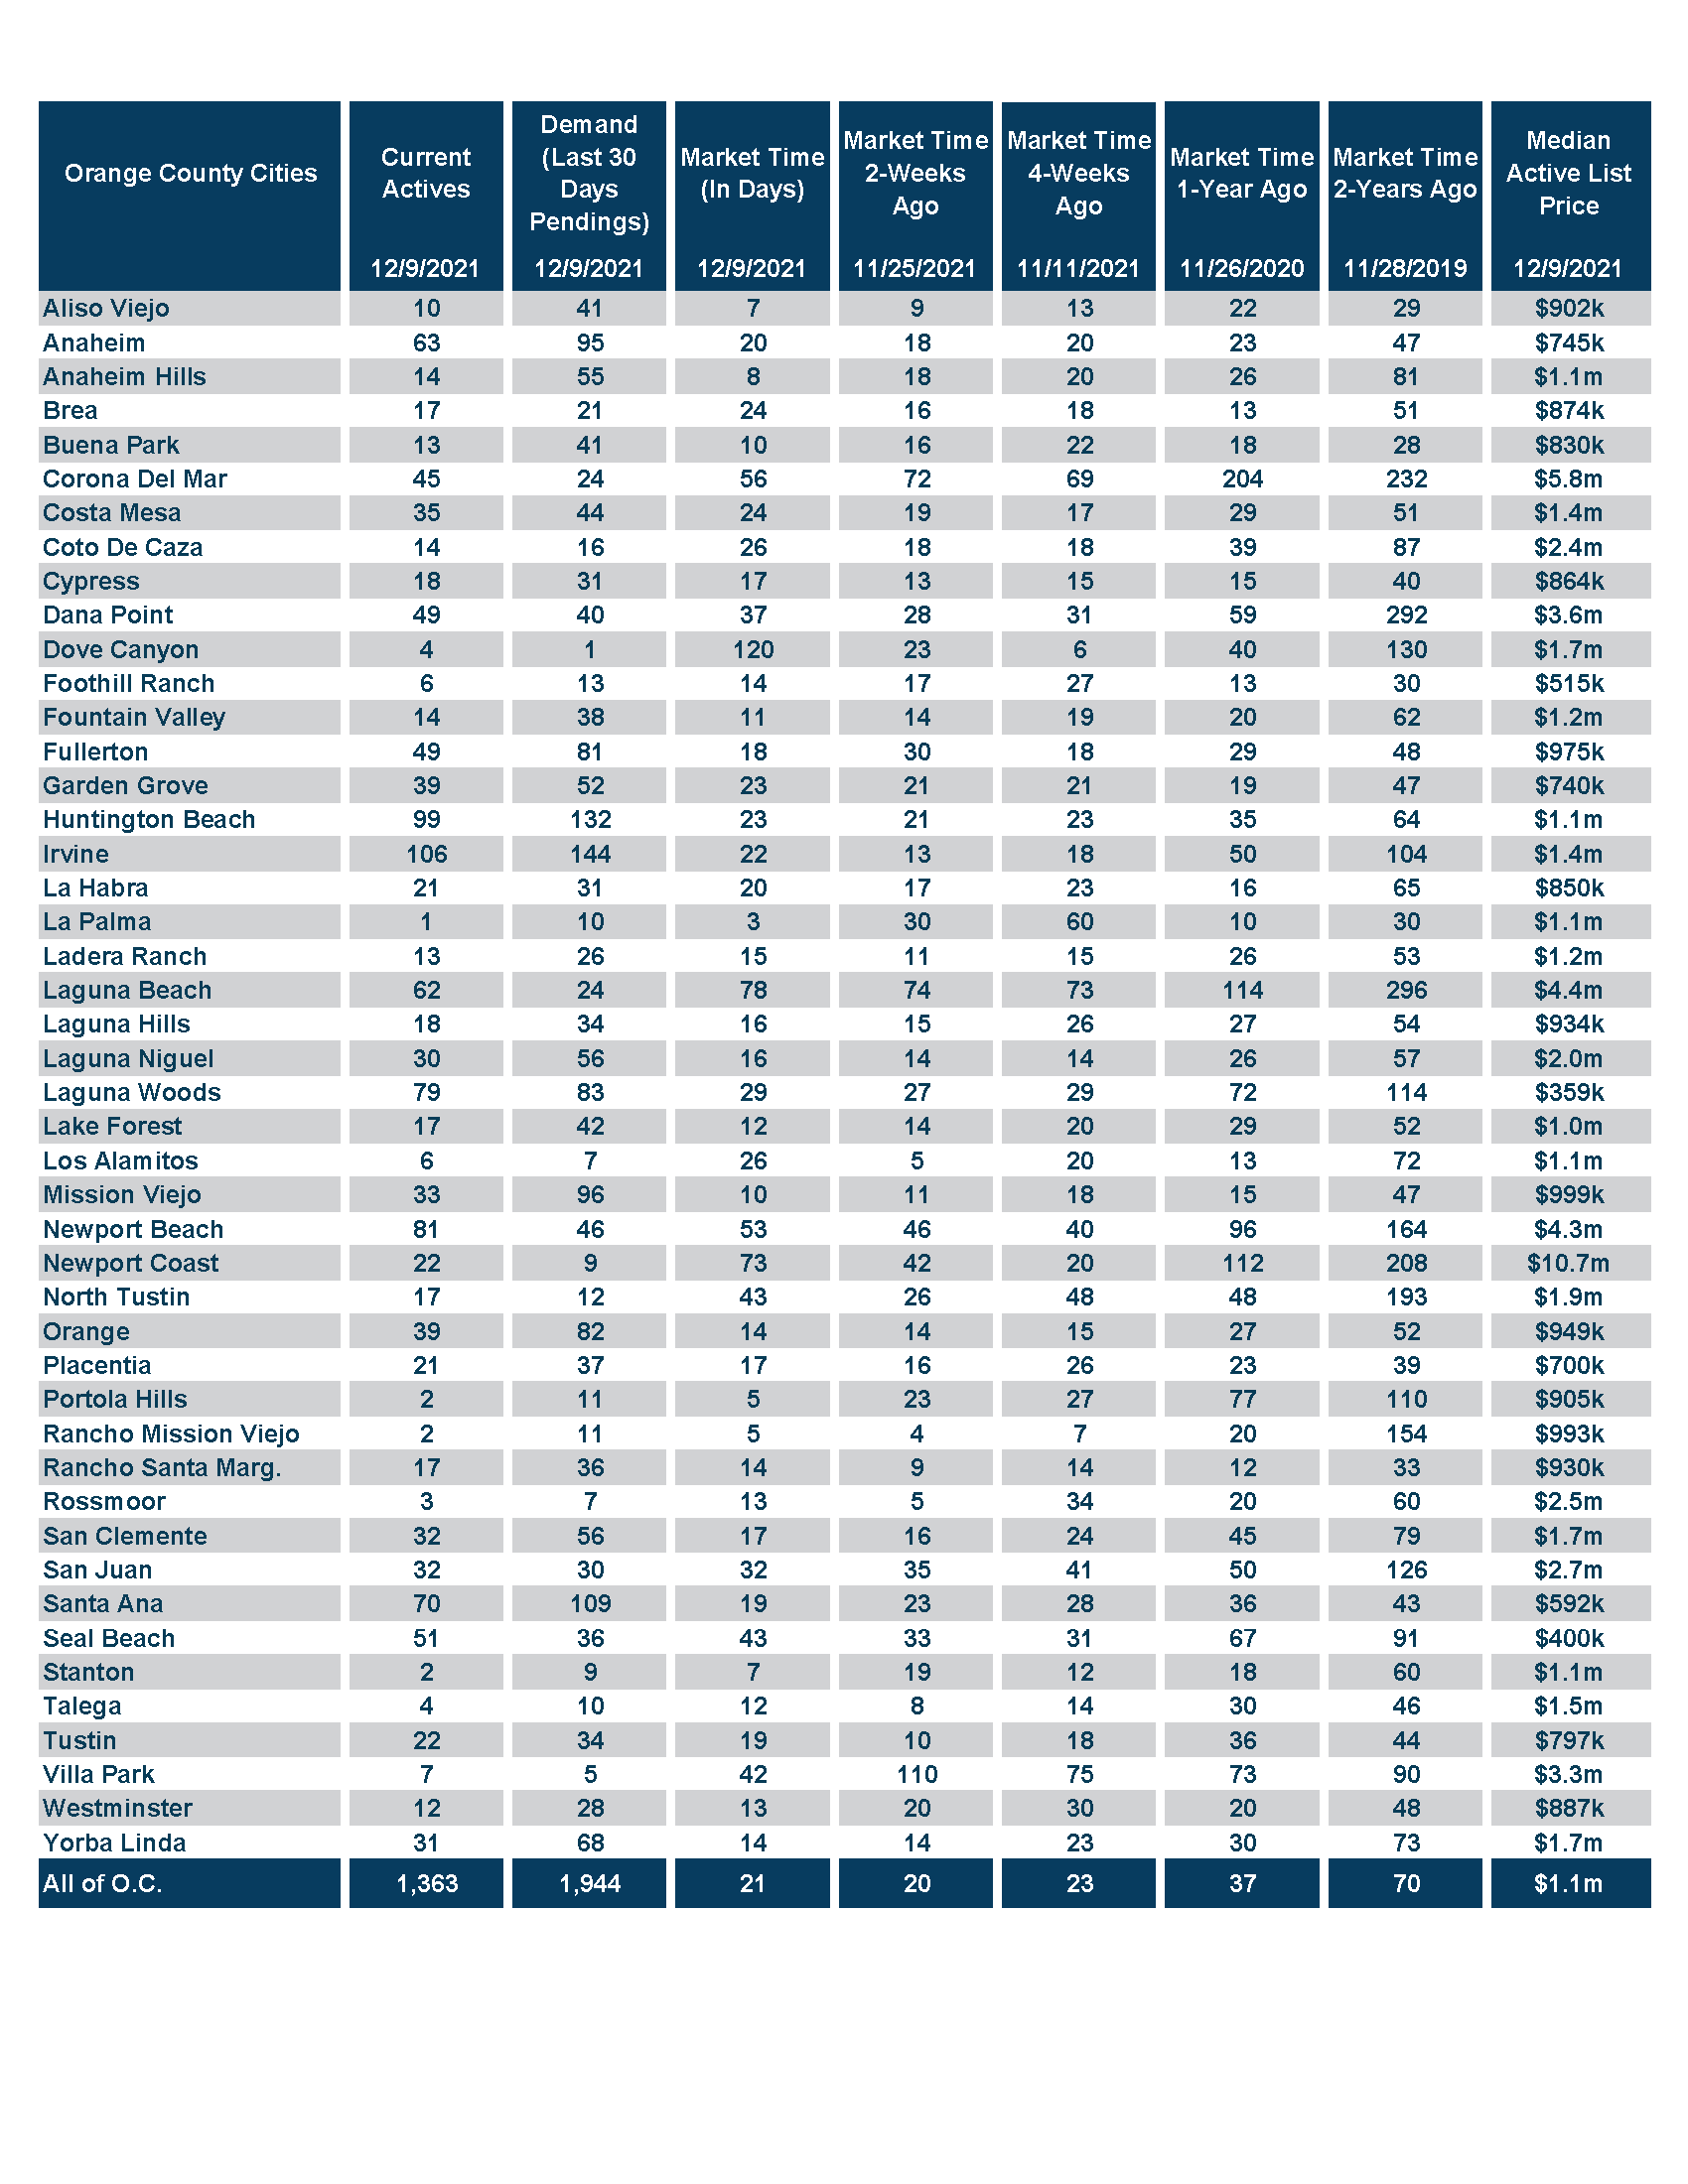
The active listing inventory shed 94 homes in the past couple of weeks, down 6%, and now sits at 1,363 homes, the lowest level since tracking began in 2004. The fewest number of homes are placed on the market in December and the second fewest is November. The inventory was already low prior, but with elevated demand due to low mortgage rates, along with fewer homes placed on the market, the inventory will continue to plunge by year’s end, like it does every year. It will hit a new record low upon ringing in a New Year. Additionally, fewer homes are coming on the market, down 8%, or 175 fewer FOR-SALE signs in the month of November, further magnifying the inventory crisis.
Last year, the inventory was at 3,152, 131% more, or an additional 1,789 homes. The 3-year average prior to COVID is 4,988, an extra 3,625 homes, or 266% more, triple compared to today. There were a lot more choices back then.
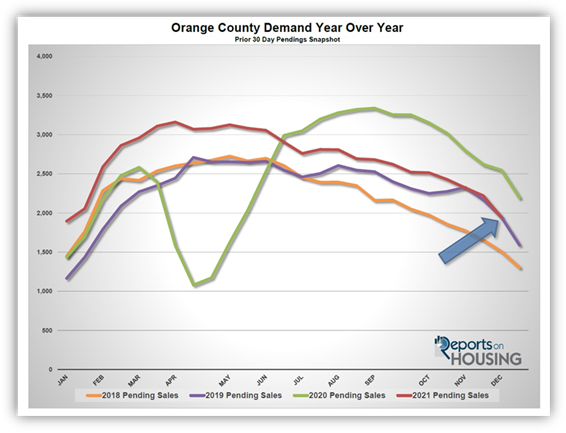
Demand
Demand plunged by 12% in the past couple of weeks.
Demand, a snapshot of the number of new escrows over the prior month, plunged from 2,221 to 1,944 in the past couple of weeks, shedding 277 pending sales, down 12%, its largest drop of the year and its lowest level since January. Fewer and fewer home purchase opportunities combined with moving deeper into the Holiday Market has sidelined many prospective home buyers. Many buyers are ultimately taking a break until the start of 2022 just around the corner. This market has been tough on buyers. With such an anemic number of available homes to purchase, buyers are tripping over each other to try to get to the front of the line and hit pay dirt. Even today, amid the holiday season, buyers can expect multiple offer situations and homes flying off the market in days. Demand will continue to plunge through the end of this month as fewer homeowners enter the fray.
Last year, demand was at 2,549, 31% more than today due to a delay in the Spring Market because of COVID and more available homes to purchase. The 3-year average prior to COVID (2017 to 2019) is 1,774 pending sales, 9% less than today. With an enormous drop in demand compared to the smaller drop in supply, the Expected Market Time (the number of days to sell all Orange County listings at the current buying pace) increased from 20 to 21 days. At 21 days, it is an extremely insane, HotSeller’s Market (less than 60 days) where there are a ton of showings, sellers get to call the shots during the negotiating process, multiple offers are the norm, and home values are rising rapidly. Last year, it was at 37-days. The 3-year average prior to COVID was at 87 days, much slower than today, but still a Slight Seller’s Market.
Luxury End
Luxury demand plunged in the past couple of weeks.
In the past two weeks the luxury inventory of homes priced above $1.5 million decreased by 27 homes, down 5%, and now sits at 509, the lowest level since tracking began in 2004. Luxury demand plunged by 63 pending sales, down 16%, and now sits at 323, its largest drop of the year and its lowest level since January. With a larger drop in the demand compared to supply, the overall Expected Market Time for luxury homes priced above $1.5 million increased from 42 to 47 days. It remains an extremely Hot Seller’s Market for luxury.
Year over year, luxury demand is up by 5 pending sales or 2%, and the active luxury listing inventory is down by 587 homes or 54%. The Expected Market Time last year was at 103 days, exceptionally hot for luxury, but more than double where it stands today, indicating just how unbelievably hot the luxury market is right now.
For homes priced between $1.5 million and $2 million, the Expected Market increased from 21 to 24 days. For homes priced between $2 million and $4 million, the Expected Market Time increased from 39 to 46 days. For homes priced above $4 million, the Expected Market Time increased from 103 to 112 days. At 112 days, a seller would be looking at placing their home into escrow around April 2022.
Orange County Housing Summary
- The active listing inventory shed 94 homes in the past two weeks, down 6%, and now totals 1,363 homes, its lowest level since tracking. In November, there were 8% fewer homes that came on the market compared to the 3-year average prior to COVID (2017 to 2019), 175 less. Last year, there were 3,152 homes on the market, 1,789 additional homes, or 131% more.
- Demand, the number of pending sales over the prior month, plunged by 277 pending sales in the past two weeks, down 12%, and now totals 1,944, its largest drop of the year and the lowest level since January. Last year, there were 2,549 pending sales, 31% more than today due to a delay in the Spring Market because of COVID.
- With an enormous drop in demand compared to the smaller drop in supply, the Expected Market Time, the number of days to sell all Orange County listings at the current buying pace, increased from 20 to 21 days in the past couple of weeks, an extremely Hot Seller’s Market (less than 60 days). It was at 37 days last year, slower than today.
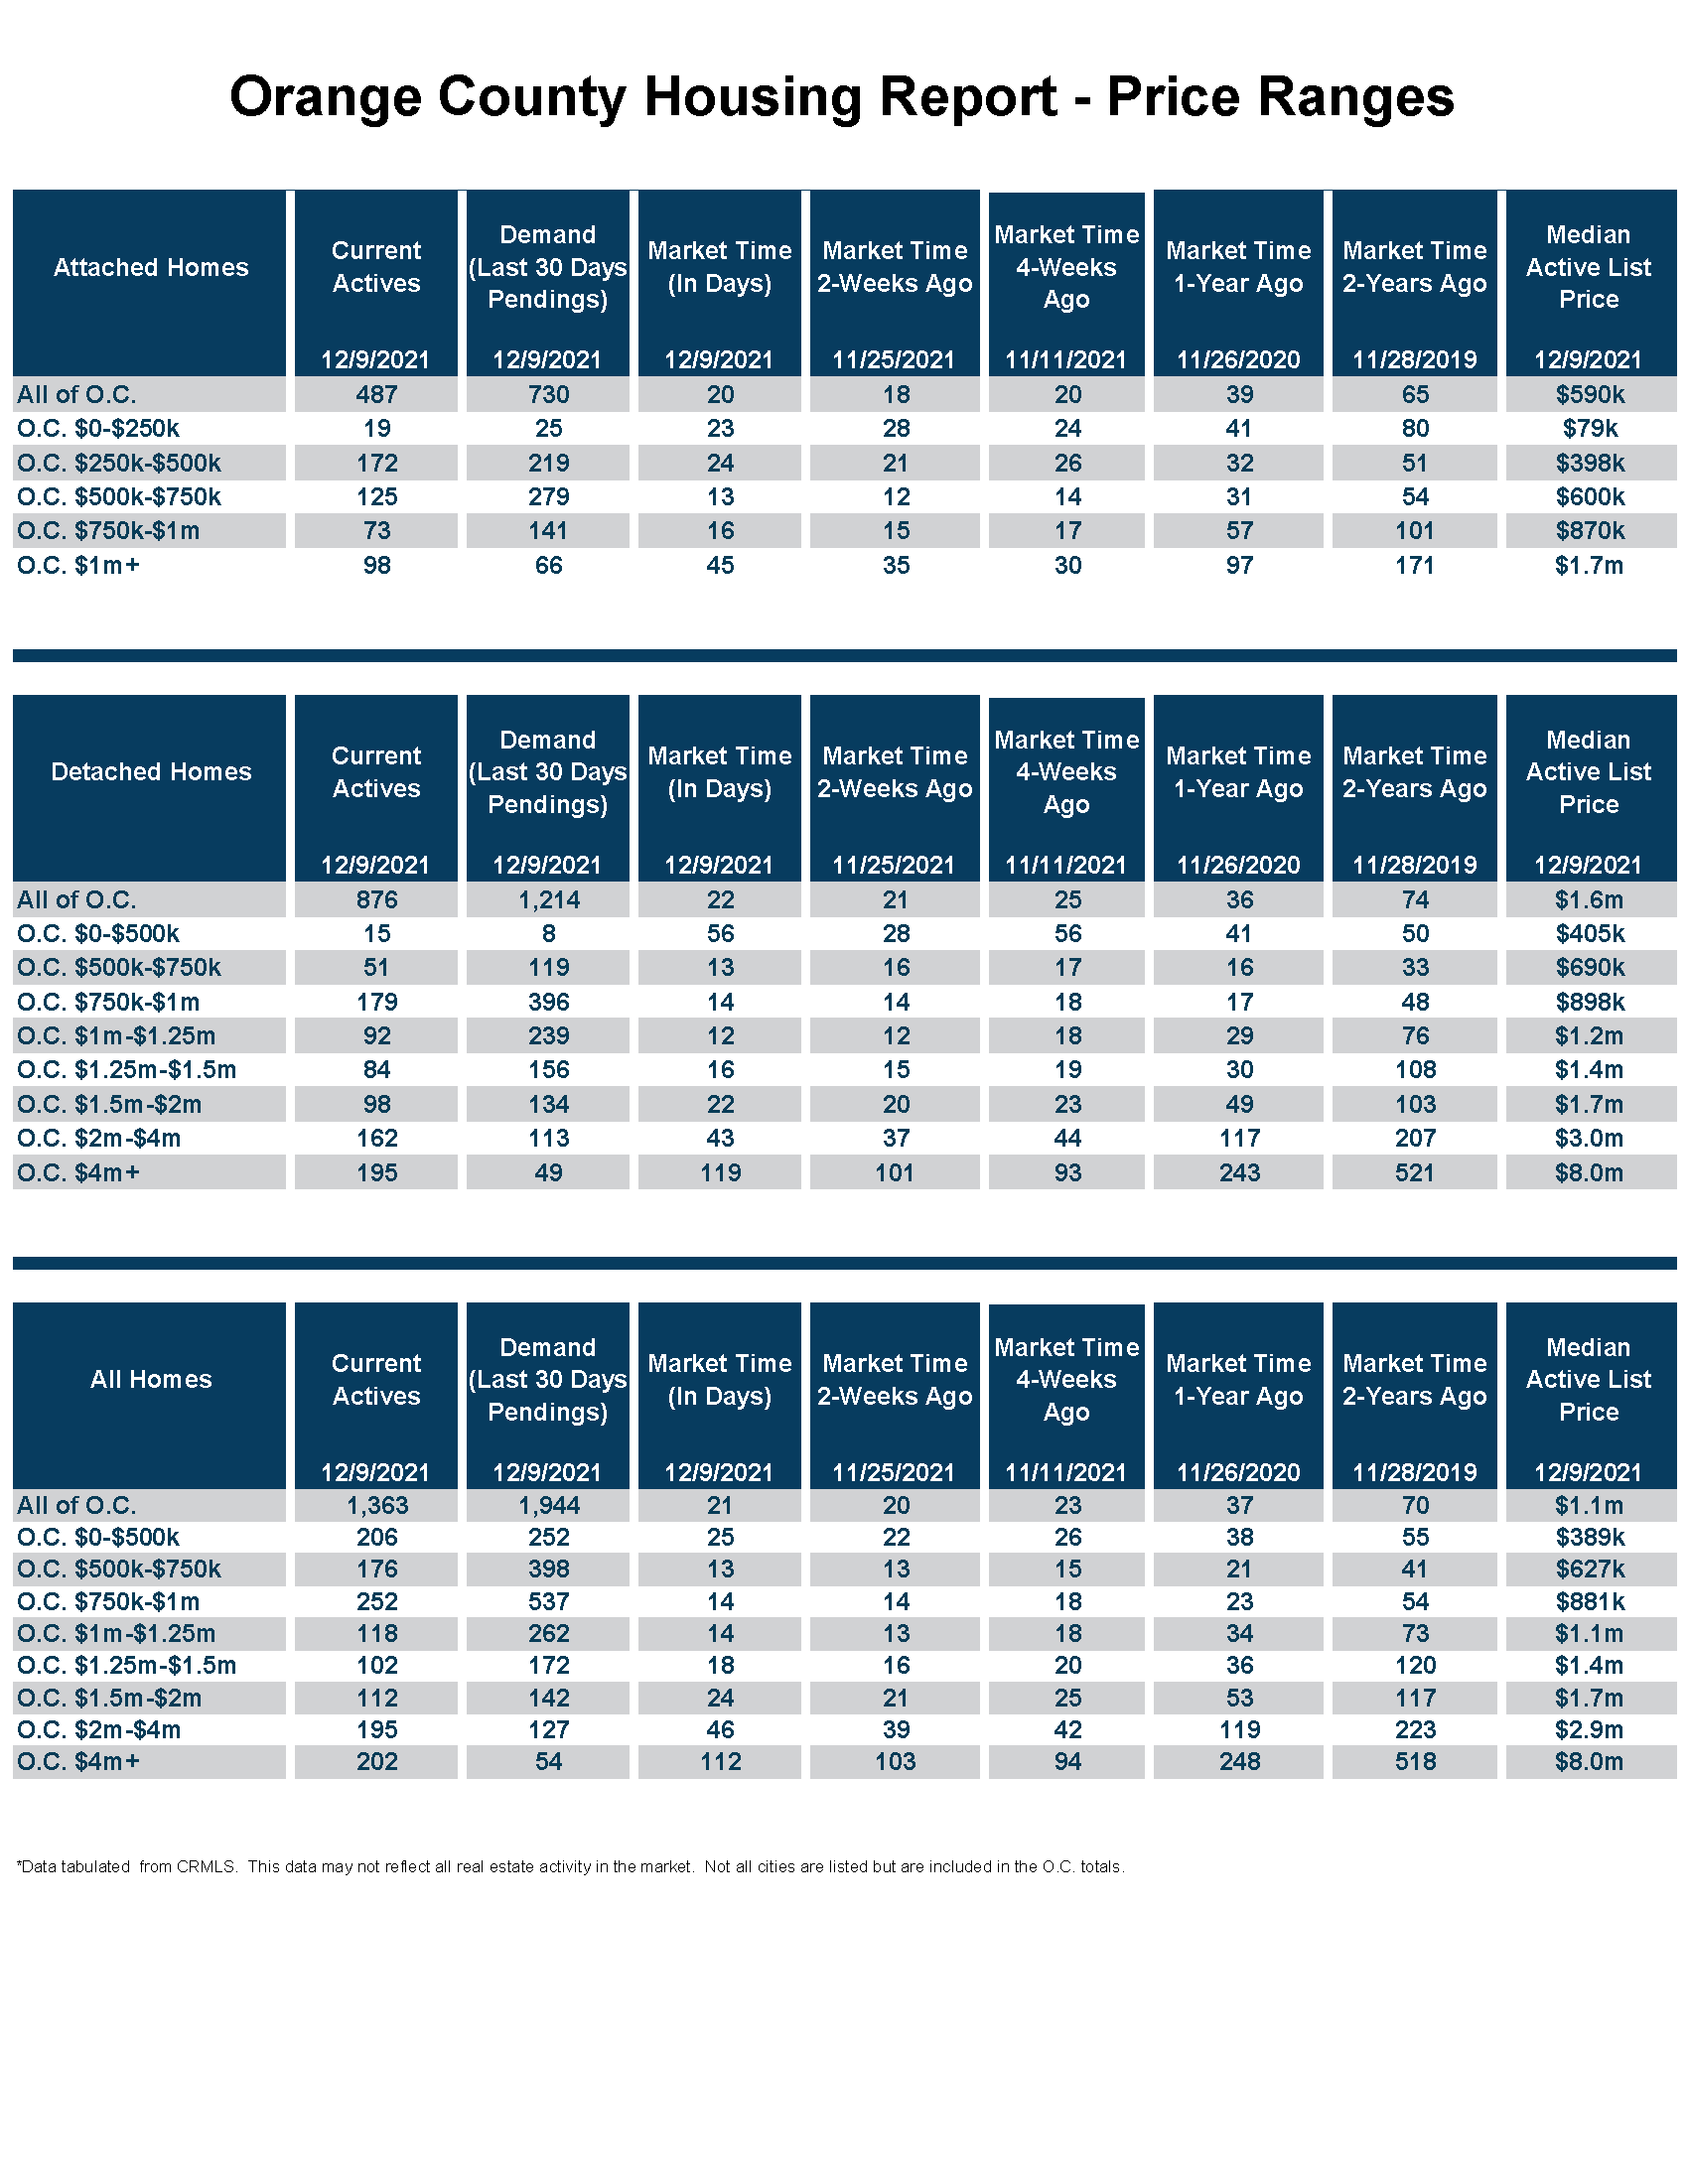
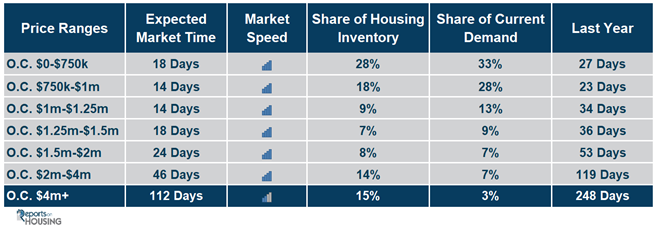
- For homes priced below $750,000, the market is a Hot Seller’s Market (less than 60 days) with an Expected Market Time of 18 days. This range represents 28% of the active inventory and 33% of demand.
- For homes priced between $750,000 and $1 million, the Expected Market Time is 14 days, a Hot Seller’s Market. This range represents 18% of the active inventory and 28% of demand.
- For homes priced between $1 million to $1.25 million, the Expected Market Time is 14 days, a Hot Seller’s Market. This range represents 9% of the active inventory and 13% of demand.
- For homes priced between $1.25 million to $1.5 million, the Expected Market Time is 18 days, a Hot Seller’s Market. This range represents 7% of the active inventory and 9% of demand.
- For homes priced between $1.5 million and $2 million, the Expected Market increased from 21 to 24 days. For homes priced between $2 million and $4 million, the Expected Market Time increased from 39 to 46 days. For homes priced above $4 million, the Expected Market Time increased from 103 to 112 days.
- The luxury end, all homes above $1.5 million, accounts for 37% of the inventory and 17% of demand.
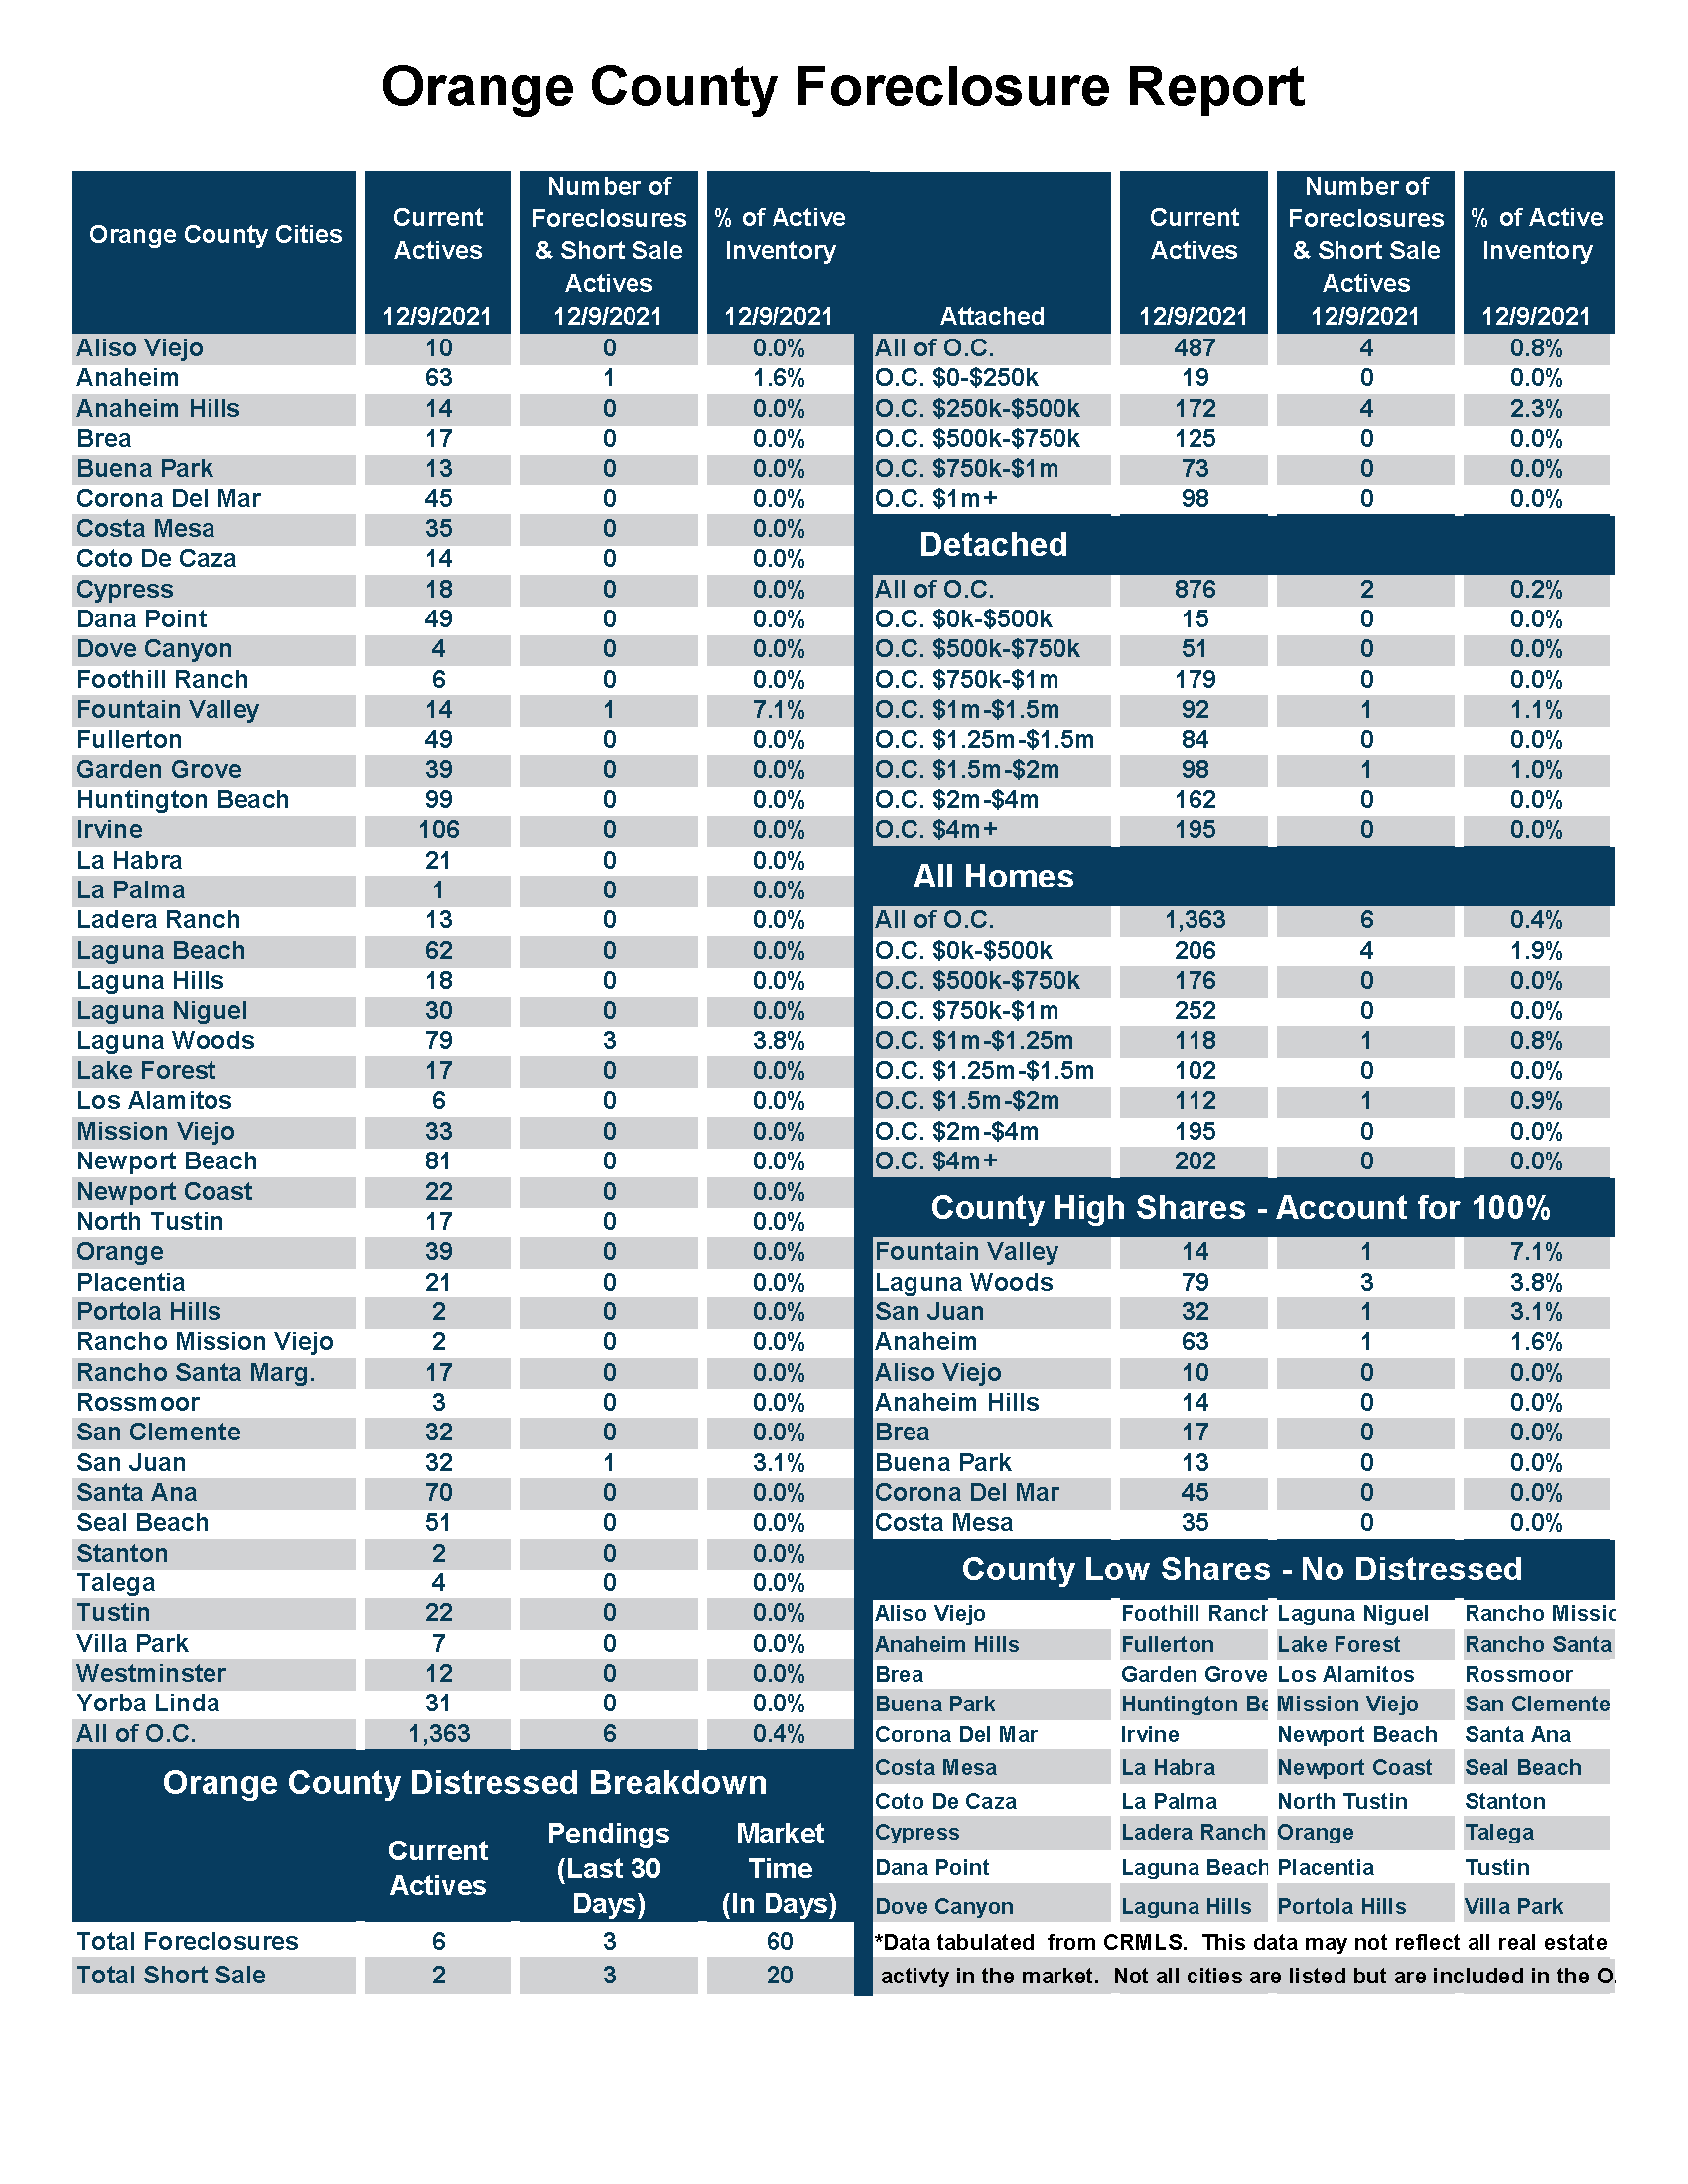
- Distressed homes, both short sales and foreclosures combined, made up only 0.6% of all listings and 0.4% of demand. There are only 6 foreclosures and 2 short sales available to purchase today in all of Orange County, 8 total distressed homes on the active market, up 1 from two weeks ago. Last year there were 8 total distressed homes on the market, same as today.
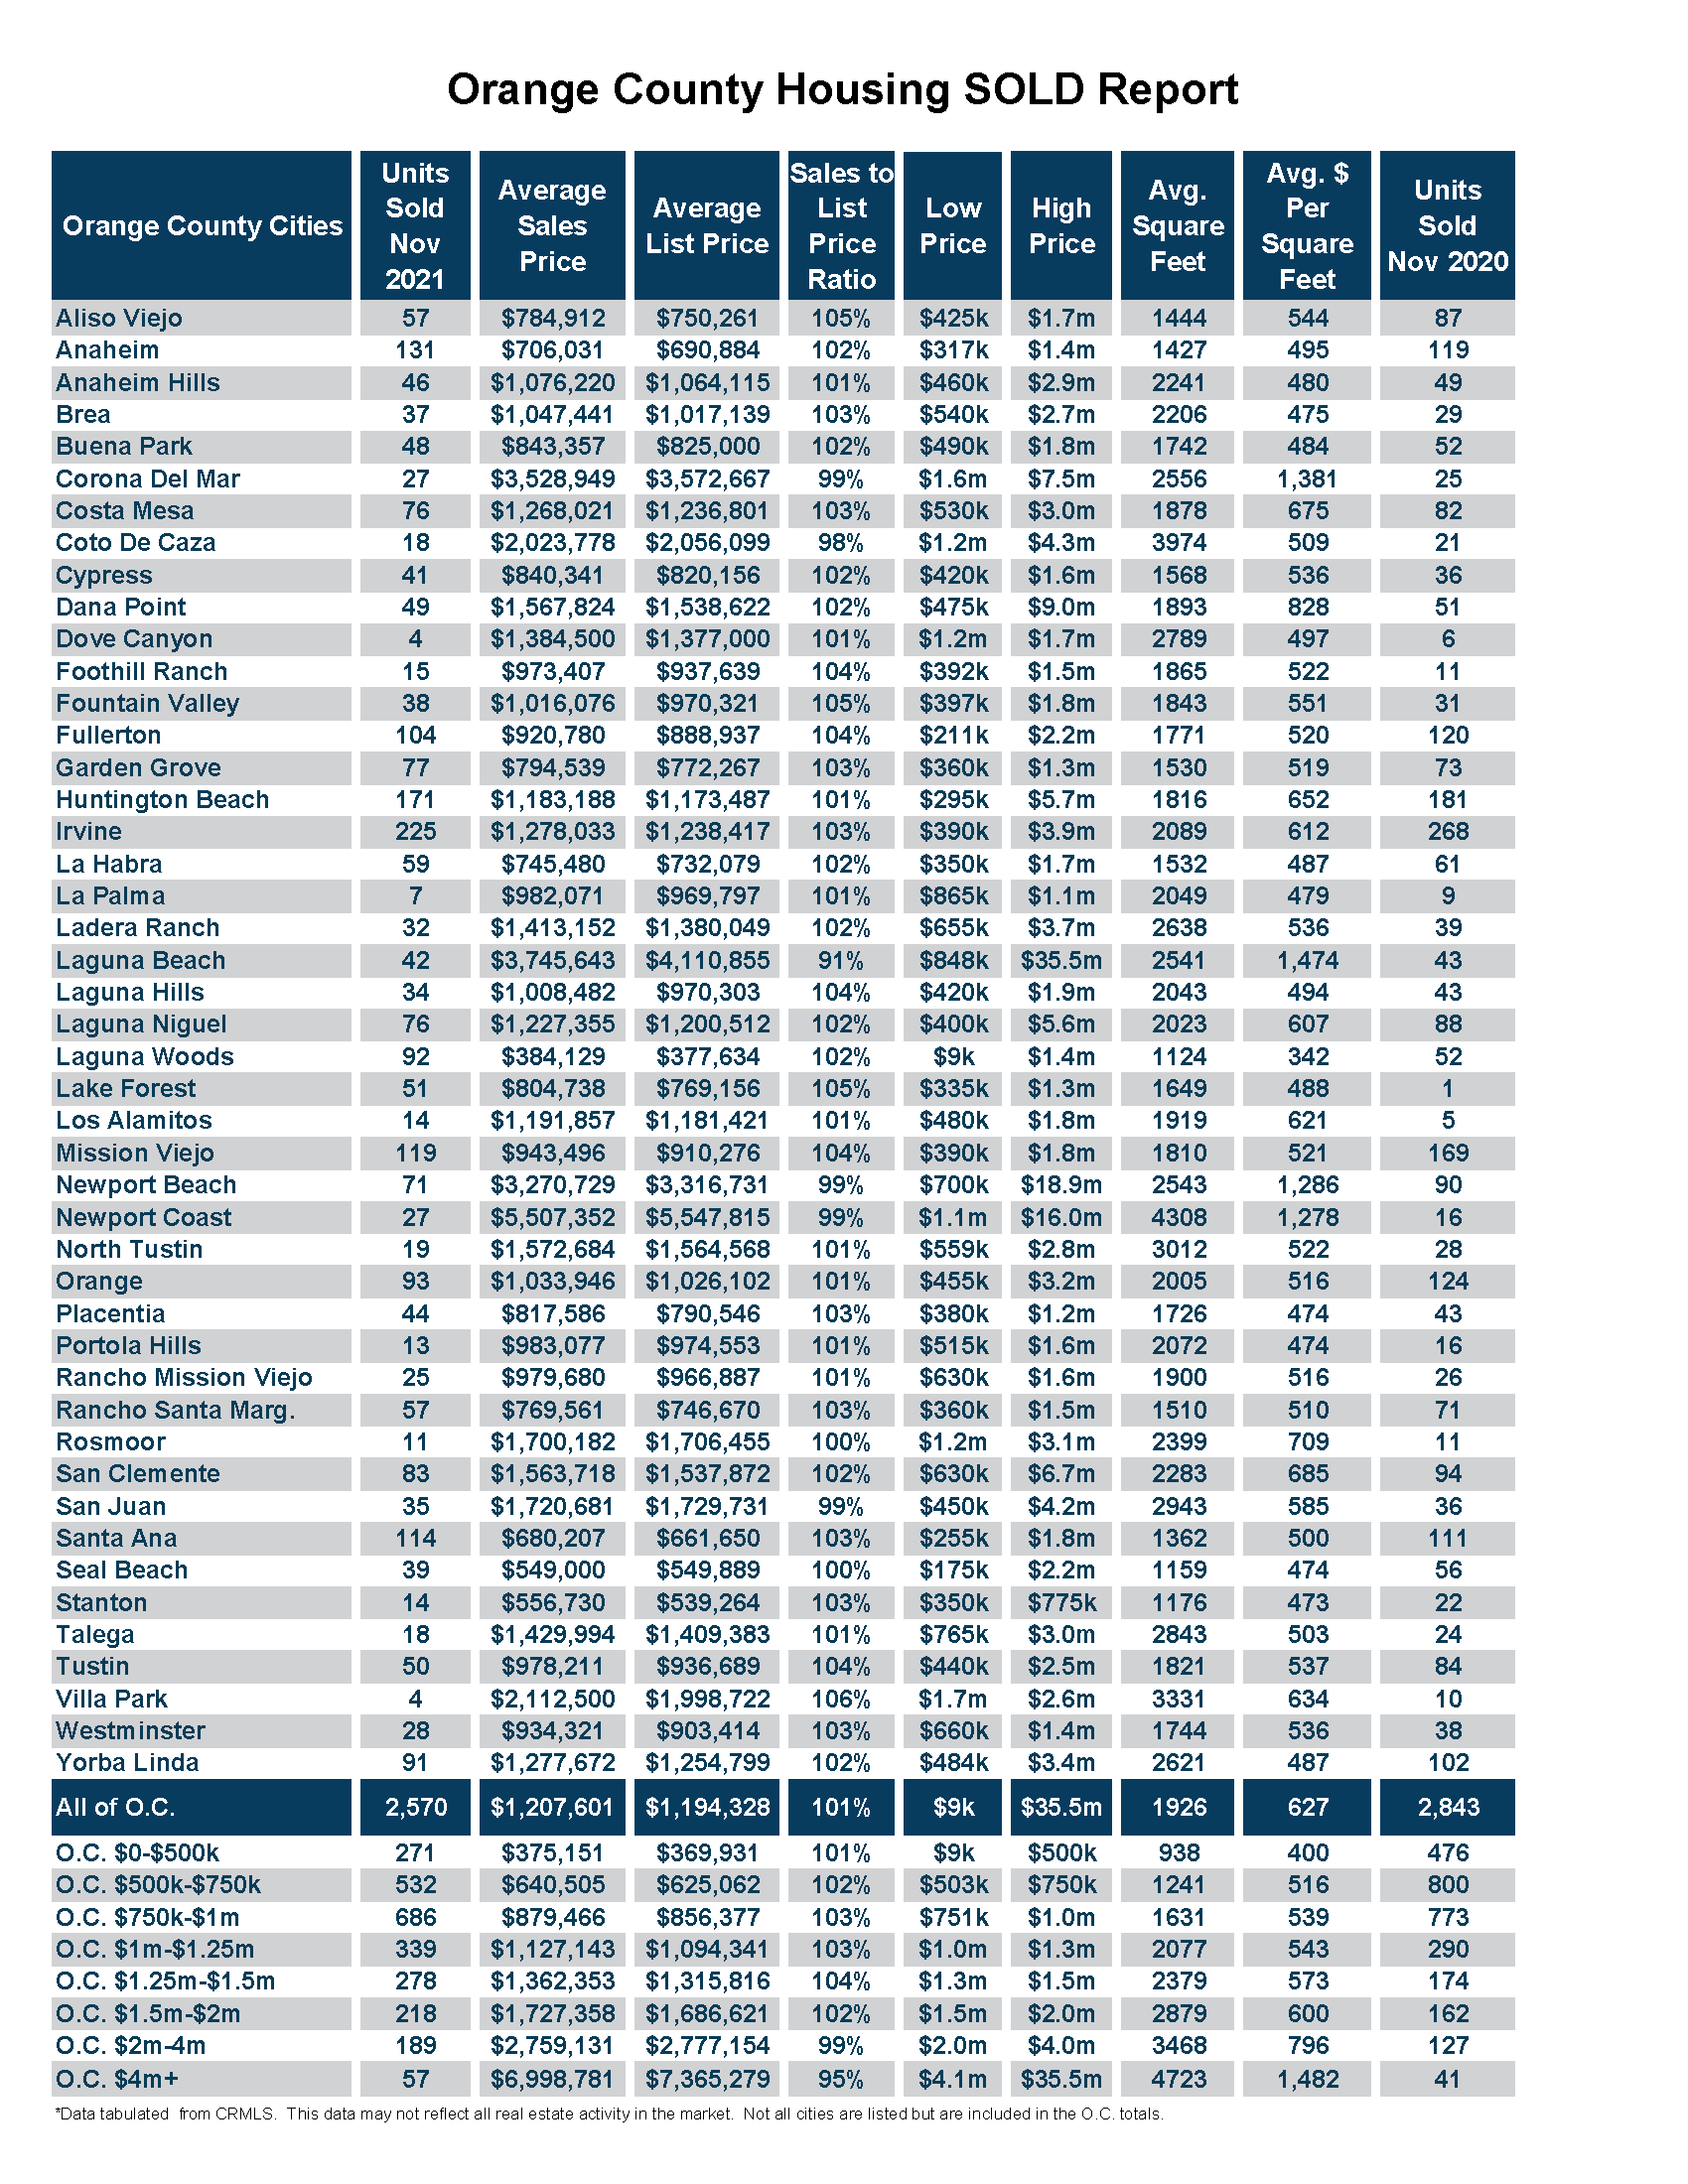
- There were 2,570 closed residential resales in November, 10% less than November 2020’s 2,843 closed sales. For the year, through November, there have been 32,669 closed sales, 20% higher than last year. September marked a 7% drop compared to October 2021. The sales to list price ratio was 101.1% for all of Orange County. Foreclosures accounted for just 0.2% of all closed sales, and short sales accounted for 0.2%. That means that 99.6% of all sales were good ol’ fashioned sellers with equity.
Have a great week.
Sincerely,
Steven Thomas
Quantitative Economics and Decision Sciences
Cell 949.874.8221
Copyright 2021- Steven Thomas, Reports On Housing – All Rights Reserved. This report may not be reproduced in whole or part without express written permission by author.